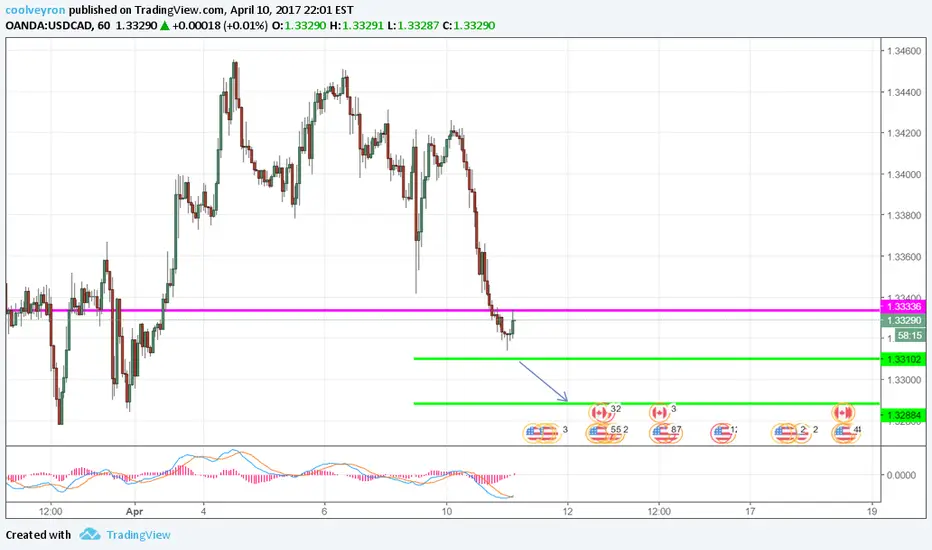
Short USDCAD Short Term based on 30M, 1H, 4H + Fundamentals.Good Morning all,
Sorry I'm late with this analysis - entered the trade very early this morning and was unable to write up my analysis before now so I apologise for the late entry, however we have plenty room for pips yet so I thought it would be worth adding.
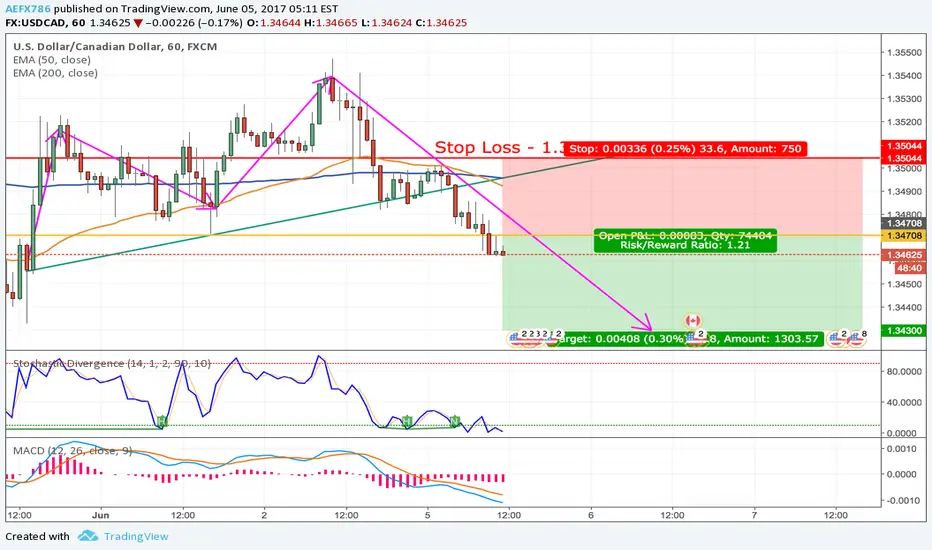
The USDCAD has been trading in a tight range but we've seen a bearish breakout below a lower trendline and coupled with some fundamentals, this has given us the opportunity to go short on this pair.
Technicals:
EMA50 has crossed below EMA200 (Death Cross) on both the 30min, 1H and the 4H charts.
After breakout, price broke below major support at 1.34708 with potential for a further leg down.
Fundamentals:
With Oil prices rising and consolidating in a bullish manner, we can expect some support for the CAD in the short term.
With US data being choppy and great uncertainty as tensions rise with North Korea and whether the FED will hike rates in June or not, I would consider the USD being the weaker of the pair.
Place your stop at 1.35044 and price targets of 1.34300 but we're not setting a TP, we will let this run and adjust our stop accordingly to secure profits.
This research is for informational purposes and should not be construed as personal advice. Trading any financial market involves risk. Trading on leverage involves risk of losses greater than deposits.
Please comment below and Like if you agree with my analysis.
Usdcad1hr
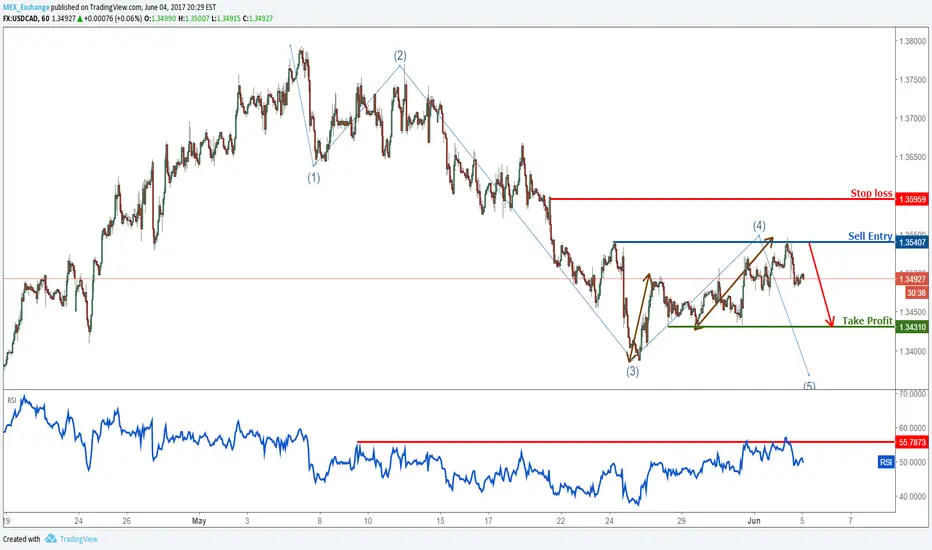
USDCAD remain bearish below major resistanceSell below 1.3540. Stop loss at 1.3595. Take profit at 1.3431.
Reason for the trading strategy (technically):
Price is seeing major resistance below 1.3540 (Fibonacci retracement, Fibonacci extension, horizontal swing high resistance, Elliott wave theory) and we expect to see further bearish movement below this level to at least 1.3431 support (Fibonacci retracement, horizontal swing low support).
RSI (55,5,3) is seeing strong resistance below the 55% level where we expect to see further bearish movement.

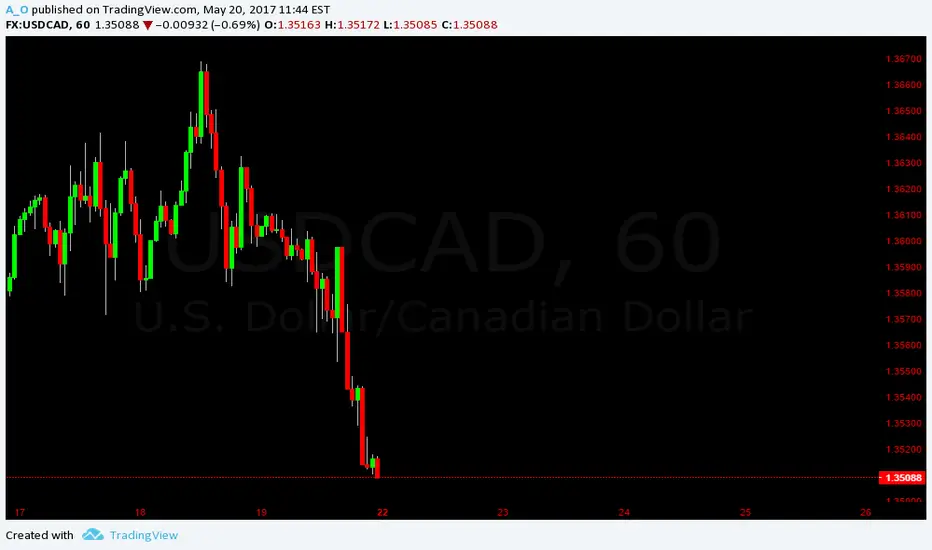
USDCAD Short High ProbalityThere is a strong downtrend on the 4-hour chart, it might just continue in the coming days untill Friday.
USDCAD 240 AnalysisThe upside battle continues. Another Shark Pattern completed. Would you like to swim?

USDCAD buy opportunity H1Buy after the breakout of price level indicated by yellow line.
close the trade around ~30 pips. TP and enjoy !
keep it simple :)

USDCAD H1 quick short trade.A sweet and quick sell entry !
Put pending sell stop after the breakout.
Keep it simple :)
USDCAD - COMING DOWNTOWN! Price just this past week hit a key support area on the daily chart, now we just need a little bit of patience for price to give us the right confirmation for it to come to show signs of continuation to the downside. BE DISCIPLINED AND WAIT!
Click to join: t.me
Need one on one guidance? Let a trader help!
www.blueprintforex.com
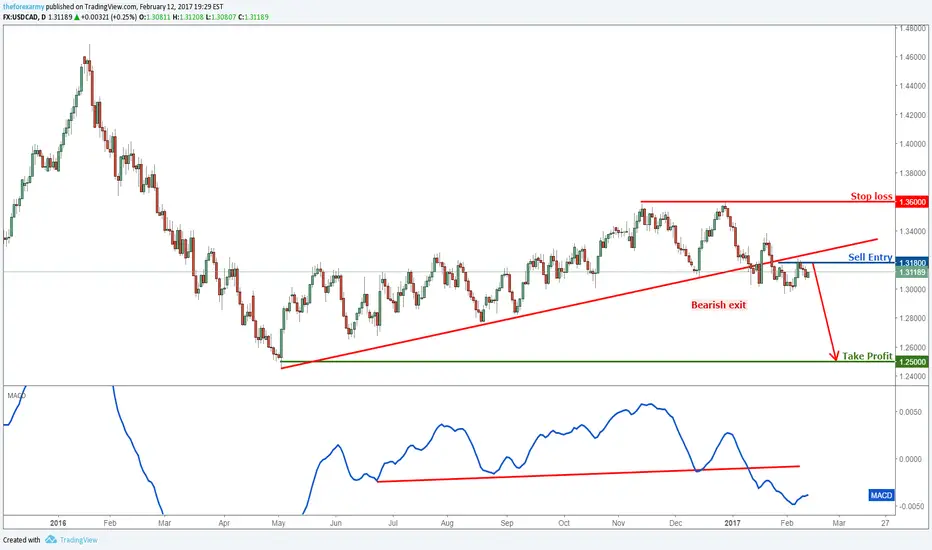
USDCAD Weekly View: Remain bearishSell below 1.3180. Stop loss at 1.3600. Take profit at 1.2500.
Reason for the trading strategy:
We remain bearish below 1.3180 resistance (Fibonacci retracement, bearish pullback) especially with the break of our long term ascending-turned-resistance line signalling a bearish exit to be seen for a drop towards at least 1.2500 support (major swing low support, Fibonacci projection).
MACD has broken a key support-turned-resistance line signalling a drop is expected.
Wait for clear signal on long or short USDCADWait for clear signal on long or short USDCAD
Need a clearly signal to take action

long USDCAD @ 1h @ trading capability for this 51st week`16This is only a trading capability - no recommendation !!!
Next week i`ll confirm or change my opinion about this SetUp :)
Buying/Selling or even only watching is always your own responsibility ...
Best regards
Aaron


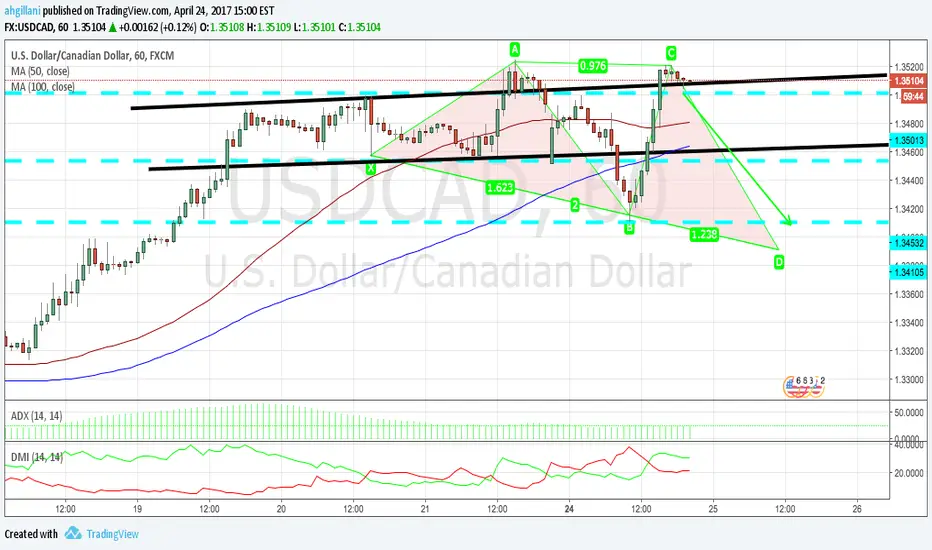
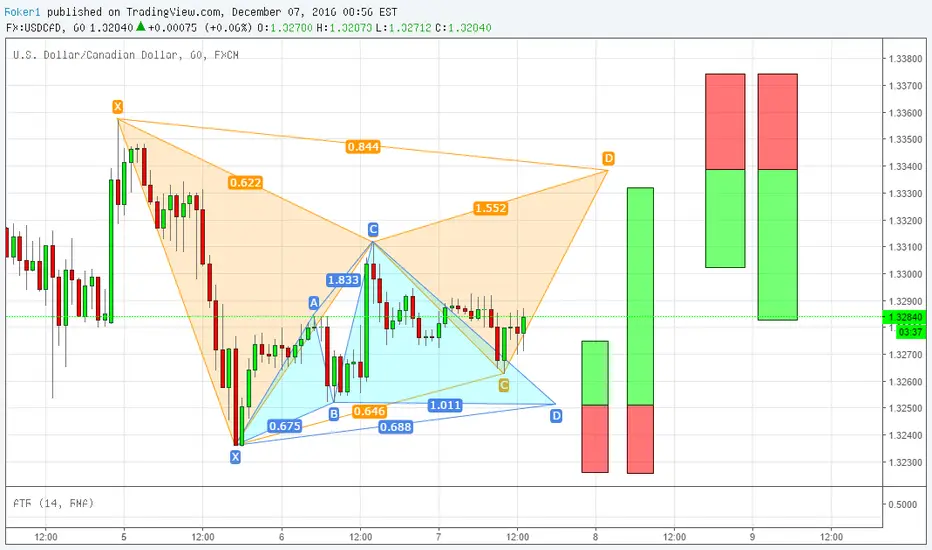
Couple of patterns on USDCADHey traders,
i'm already involved in a USDCAD trade, but for educational purpose i want to share with you this setup in lower timeframe.
As you can see in 4hr chart, we broke and closed below X, that invalidates our previous pattern (even though we're still in that trade) giving us reason to believe price is heading lower. Considering that, i search for selling signals down on 1hr and 15m timeframe.
In 1hr chart we can see we have a nice bearish Gartley that completes at previous support that was broken. With such a small B, we'd get a inverse risk to reward ratio; that's way i would enter this trade some pips above the completion just to have a 1:1RR.
In the meantime you can trade also the smaller Cypher and you could set second target up to D Gartley's completition.
I'm not entering any of those cause i'm already involved, but i hope you find it useful.
If you have any question, please ask.
Otherwise, see you in the next chart!
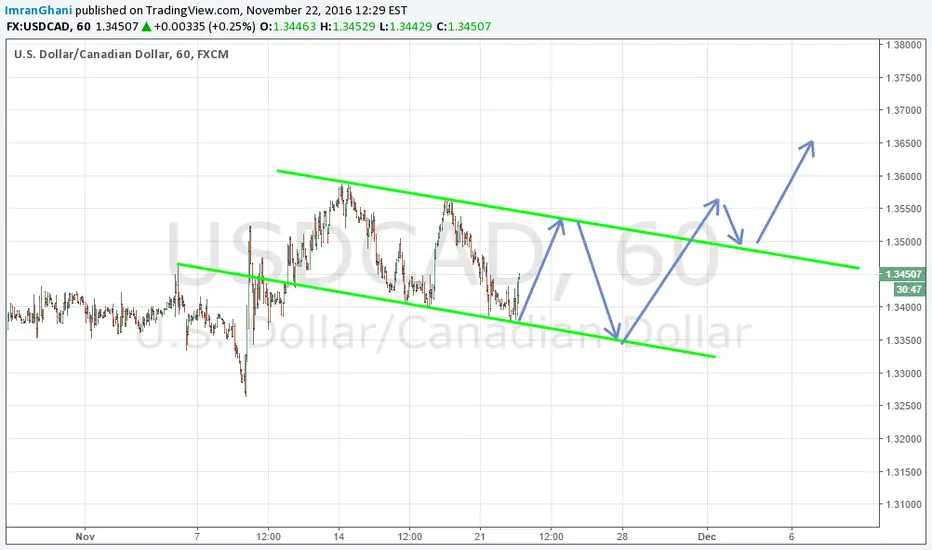
USDCAD to raise 125 pipsCAD is showing signs of strength, but they are all pumped up by the elections in the US. Its just a matter of time until it will start to go back up. Which colour do you think is more plausible?

Trend Continuation trade on USDCADHi traders,
not so much on my radar today, but i still want to share one of my short term analysis.
As i've explained in the attached analysis USDCAD was at a decision point this week; now it seems to have decided to go up, this is easily understandable from my chart: we have two consecutive break of structure to the upside.
This is enough to call it a bullish trend. Now we know from our bigger analysis that we have potential a good amount of pips until the next important level is reached, and so we want to be involved as soon as the market gives us an opportunity.
For my personal trading style, i want to have always a minimum of 1:1 Risk to Reward, so i've outlined a box in wich i'll be interested in long opportunities.
Besides, if you are a pattern trader, there's also a cypher pattern waiting for completion.
Let's see how it goes.
If you want to share your idea, don't hesitate to comment.
Otherwise, see you in the next chart.

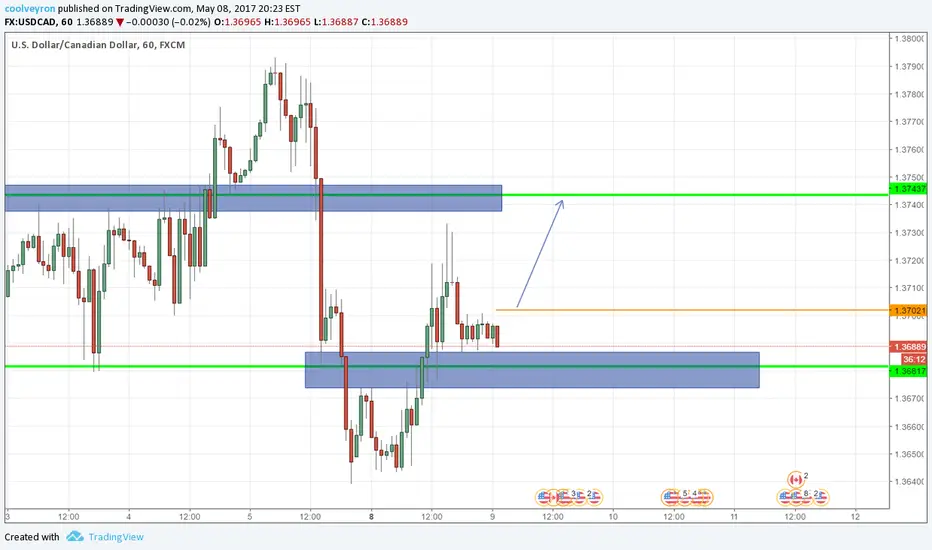
USDCAD Possible Sell SetupUSDCAD Possible Sell Setup. It's possible for the price to go even higher and reach 1.34300, so do not open a sell position until the price break the yellow line and please trade with patience and care. have a nice weekend.


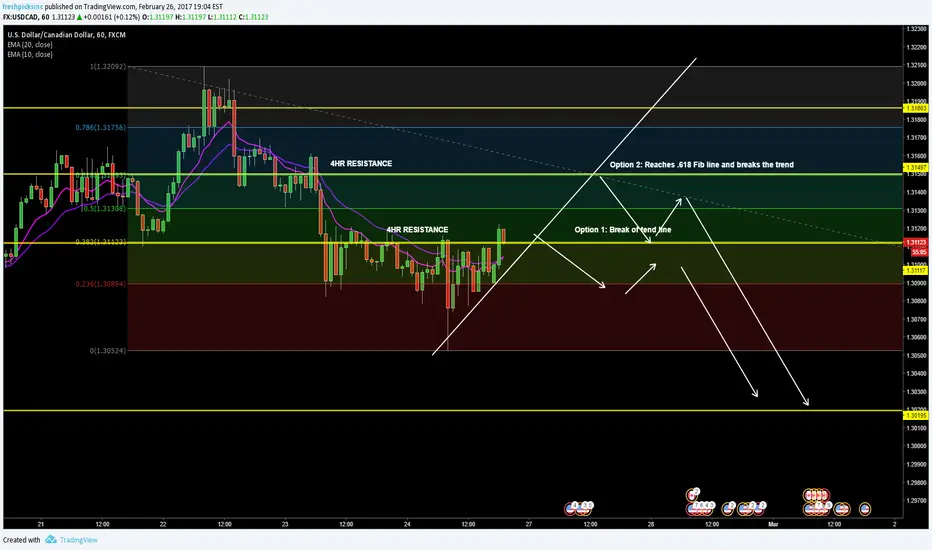
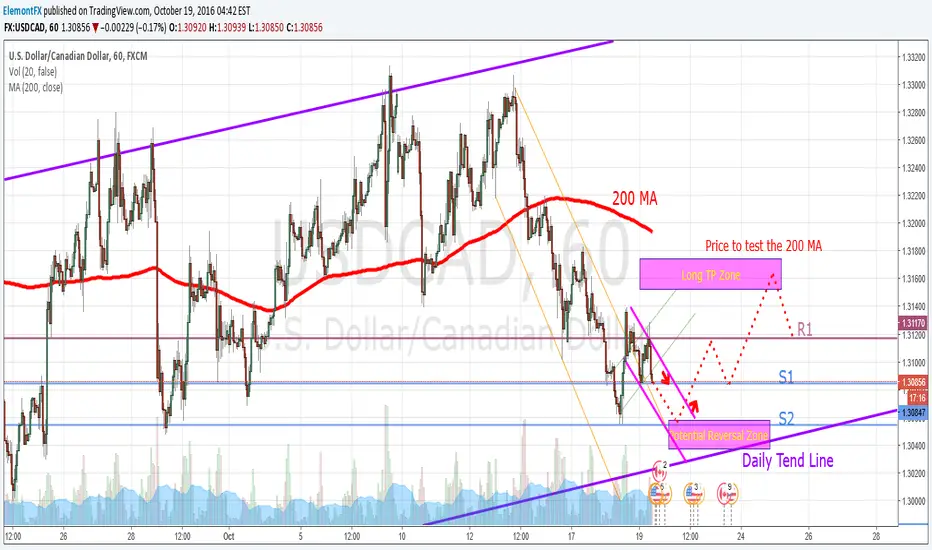
USDCAD 1H Upcoming Trade SetupsUSDCAD has broken through two different trends on the 1H, currently back in a downtrend.
We expect price to continue to S2 upon breaking S1, where it can find support at the Potential Reversal Zone before it begins a reversal to retest the 200 MA.
Trade Setups:
If it breaks S1 in the next few candlesticks, short to S2
Enter long at Potential Reversal Zone, aim for TP at Long TP Zone (200 MA). Partial TPs along the way if suitable.
Stop losses above/below the respected levels for minimal risk.
USDCAD Gartley Pattern CompleteWill the retracement for the target transpire in this market? I'm not sure but if you can handle the risk, Why not strive for the reward? Good Luck!
