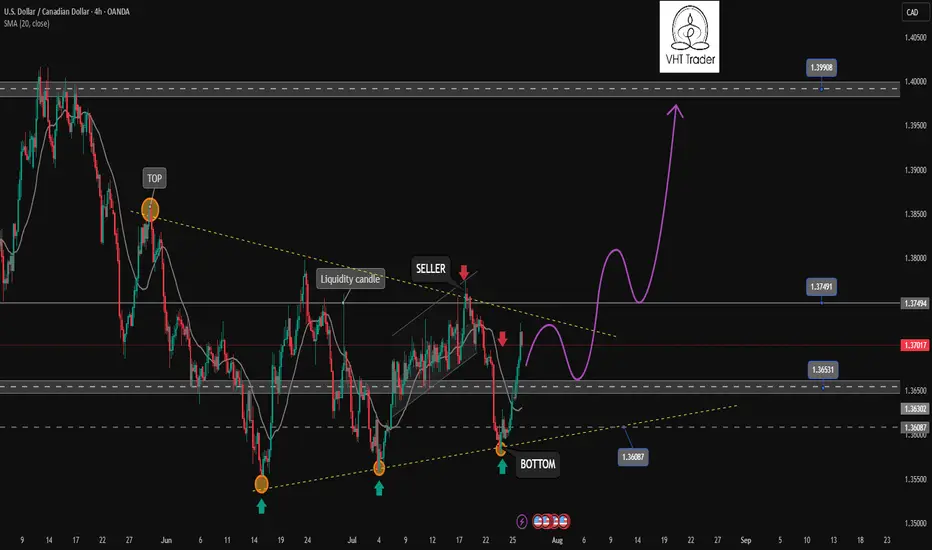
Uptrend is coming. Opportunity for buyers✏️ OANDA:USDCAD is trading close to the upper boundary of the triangle pattern. There is a high possibility that the current bullish momentum will break the upper boundary and form an uptrend for the USDCAD pair. The important price zone for the sellers at the moment is 1.075. If the buyers are strong enough to push the price above 1.075, the sellers will only be really interested in the price zone of 1.340, the high of the pair in May.
📉 Key Levels
Buy trigger: Reject and Trading above 1.365
BUY DCA Break 1.375
Target: 1.400
Leave your comments on the idea. I am happy to read your views.
Usdcadshort
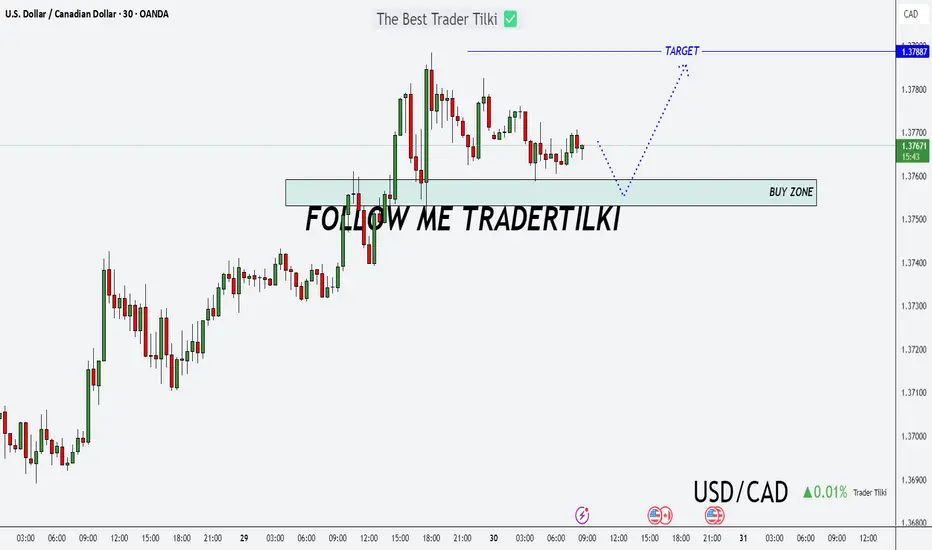
A New Day, A New Opportunity: USDCAD Buy StrategyGood morning Traders,
USDCAD has reached a key support zone between 1.37531 and 1.37592.
I'm opening a buy position from this level, aiming for the 1.37887 target.
Feel free to adjust your stop-loss based on your own margin and risk tolerance.
Your likes are my biggest source of motivation when sharing analysis. Thanks to everyone who supports with a simple like!
USDCAD SELLUSD/CAD rallies to 1.3680 as the market focuses on a hawkish Fed
The US Dollar extends its recovery for the second consecutive day, supported by strong US data. Upbeat US business activity and Jobless Claims support the Fed's "wait and see" rhetoric. In Canada, the weak Retail Sales data keep hopes for a BoC rate cut alive.
The year will be politically marked by Trump’s return to the White House. A Republican government is seen as positive for financial markets, but Trump’s pledge to cut taxes and impose tariffs on foreign goods and services may introduce uncertainty to both the political and economic landscape.
Canada’s political crisis peaked in late 2024 with a no-confidence vote against Prime Minister Justin Trudeau, leading to snap elections and a weakened Liberal minority government. Policy uncertainty and economic challenges dominate 2025’s outlook, raising concerns over market stability and investor confidence.
The BoC is set to continue easing interest rates through 2025, at least at a faster pace than the Fed is expected to, which could apply pressure on CAD’s already-rising rate differential.
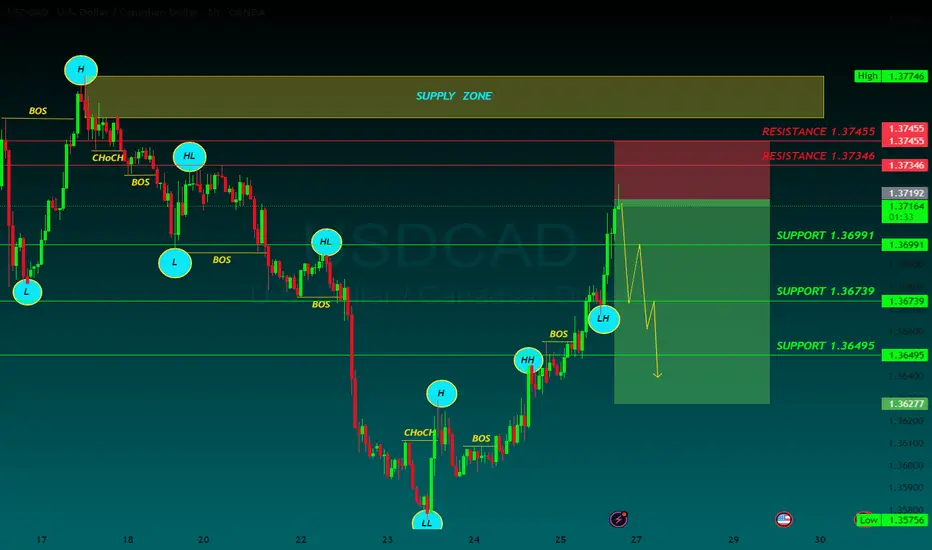
SUPPORT 1.36991
SUPPORT 1.36739
SUPPORT 1.36495
RESISTANCE 1.37346
RESISTANCE 1.37455
USDCAD BUYUSD/CAD returns below 1.3600, with YTD lows, at 1.3540 coming into view
The US Dollar extends its decline for the fourth consecutive day, with the Canadian Dollar supported by a brighter market mood, as the trade deal between the US and Japan provided some certainty about the outlook of global trade and boosted hopes of more such deals.
In the USD/CAD 2025 Forecast, FXStreet analyst Joshua Gibson suggests uncertainty and risk-off sentiment could strengthen the US Dollar (USD) early in 2025, while the Canadian Dollar (CAD) is expected to weaken in the first quarter. However, CAD investors may reassess prospects as the year progresses, focusing on the Federal Reserve (Fed) - Bank of Canada (BoC) policy dynamics.
From a technical point of view, USD/CAD could face a technical ceiling near the 1.4400 level after the Canadian Dollar's sharp 8.5% decline in 2024 sent the pair to 56-month highs. However, technical indicators like the MACD suggest caution, as short positions may only become viable once clear sell signals emerge, likely during the first quarter.
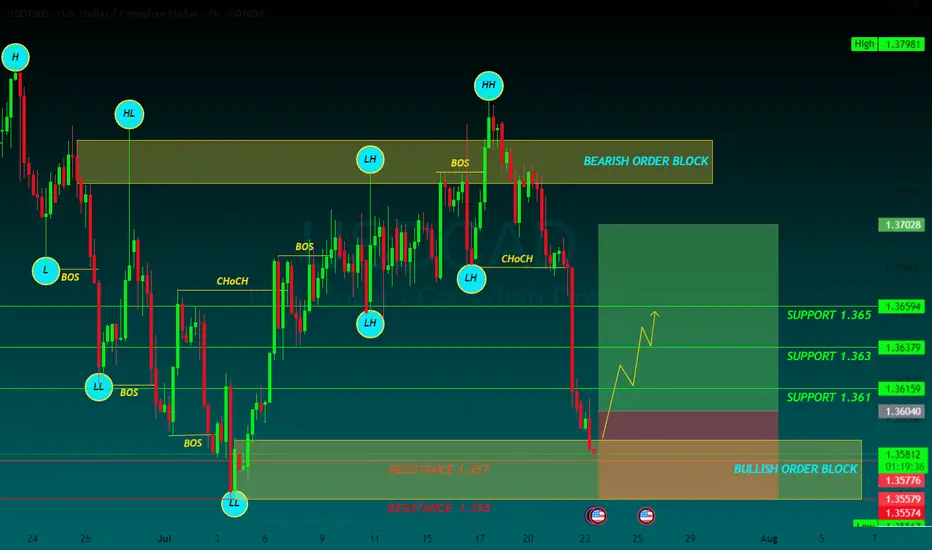
SUPPORT 1.361
SUPPORT 1.353
SUPPORT 1.361
RESISTANCE 1.357
RESISTANCE 1.355
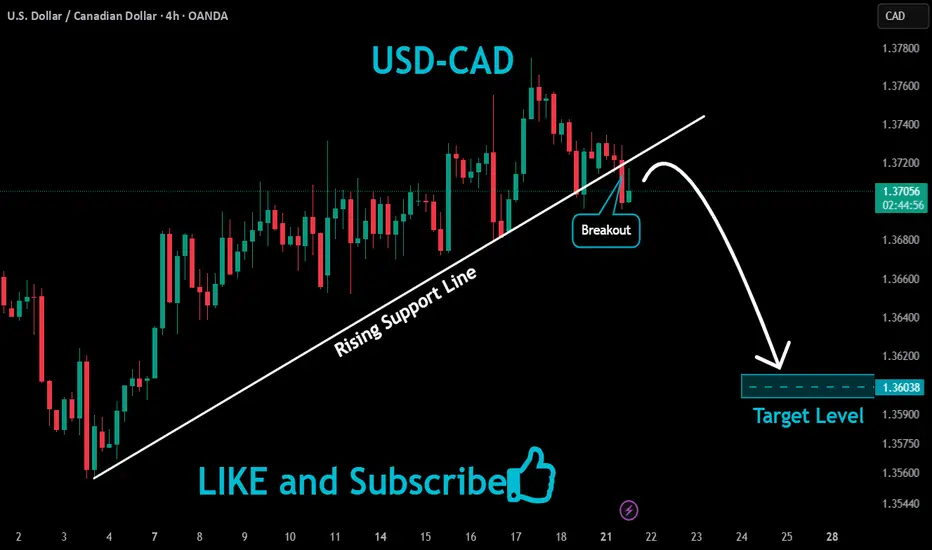
USDCAD Bearish Breakout!
HI,Traders !
#USDCAD was trading along
The rising support line but
Now we are seeing a bearish
Breakout so we are bearish
Biased and we will be expecting
A further bearish move down !
Comment and subscribe to help us grow !
USDCAD SELLUSD/CAD retakes 1.3700, eyes multi-week top amid a broadly firmer USD
The USD/CAD pair attracts some dip-buying during the Asian session on Thursday and climbs further beyond the 1.3700 mark amid a broadly firmer US Dollar. Spot prices have now reversed the previous day's retracement slide from a three-week high and seem poised to appreciate further
The year will be politically marked by Trump’s return to the White House. A Republican government is seen as positive for financial markets, but Trump’s pledge to cut taxes and impose tariffs on foreign goods and services may introduce uncertainty to both the political and economic landscape.
Canada’s political crisis peaked in late 2024 with a no-confidence vote against Prime Minister Justin Trudeau, leading to snap elections and a weakened Liberal minority government. Policy uncertainty and economic challenges dominate 2025’s outlook, raising concerns over market stability and investor confidence.
The BoC is set to continue easing interest rates through 2025, at least at a faster pace than the Fed is expected to, which could apply pressure on CAD’s already-rising rate differentia
TP 1 1.37214
TP 2 1.37095
TP 3 1.36987
RESISTANCE 1.37413

USD/CAD(20250718)Today's AnalysisMarket news:
① Kugler: It is appropriate to keep the interest rate policy stable for "a while".
② Daly: Whether to cut interest rates in July or September is not the most critical.
③ Bostic: It may be difficult to cut interest rates in the short term.
Technical analysis:
Today's buying and selling boundaries:
1.3735
Support and resistance levels:
1.3827
1.3792
1.3770
1.3700
1.3678
1.3644
Trading strategy:
If it breaks through 1.3770, consider buying in, the first target price is 1.3792
If it breaks through 1.3735, consider selling in, the first target price is 1.3700

USD/CAD(20250716)Today's AnalysisMarket news:
① The annual rate of the overall CPI in the United States in June rose to 2.7%, the highest since February, in line with market expectations, and the monthly rate was 0.3%, the highest since January, in line with market expectations; the annual rate of the core CPI rose to 2.9%, the highest since February, lower than the expected 3%, but slightly higher than 2.8% last month, and the monthly rate was 0.2%, lower than the market expectation of 0.3%.
② Interest rate futures still show that the Fed is unlikely to cut interest rates this month, but there is a high possibility of a 25 basis point cut in September.
③ Fed mouthpiece: The CPI report will not change the Fed's policy direction.
④ Trump: Consumer prices are low and the federal funds rate should be lowered immediately. The Fed should cut interest rates by 3 percentage points.
⑤ Fed Collins: The core inflation rate is expected to remain at about 3% by the end of the year, and the Fed should maintain active patience.
Technical analysis:
Today's buying and selling boundaries:
1.3708
Support and resistance levels:
1.3766
1.3744
1.3730
1.3685
1.3671
1.3650
Trading strategy:
If the price breaks through 1.3730, consider buying, the first target price is 1.3744
If the price breaks through 1.3708, consider selling, the first target price is 1.3685

USDCAD's Opportunity Bell Is Ringing — Don’t Miss Out!Hey there, my valued friends!
I’ve prepared a fresh USDCAD analysis just for you.
📌 If the 1.37245 level breaks, the next target will be 1.38000.
Every single like you send my way is the biggest motivation behind sharing these analyses.
🙌 Huge thanks to each and every one of you who supports me!
Would you like to add a visual or a catchy headline to boost engagement even more? I can help with that too.
USDCAD LONG DAILY FORECAST Q3 D10 W28 Y25USDCAD LONG DAILY FORECAST Q3 D10 W28 Y25
Professional Risk Managers👋
Welcome back to another FRGNT chart update📈
Diving into some Forex setups using predominantly higher time frame order blocks alongside confirmation breaks of structure.
Let’s see what price action is telling us today! 👀
💡Here are some trade confluences📝
✅Daily Order block identified
✅4H Order Block identified
✅1H Order Block identified
🔑 Remember, to participate in trading comes always with a degree of risk, therefore as professional risk managers it remains vital that we stick to our risk management plan as well as our trading strategies.
📈The rest, we leave to the balance of probabilities.
💡Fail to plan. Plan to fail.
🏆It has always been that simple.
❤️Good luck with your trading journey, I shall see you at the very top.
🎯Trade consistent, FRGNT X
USDCAD Short From Falling Resistance! HI,Traders !
#USDCAD is going up
And will soon hit a falling
Resistance line from where
We will be expecting a
Local bearish pullback
And a move down !
Comment and subscribe to help us grow !
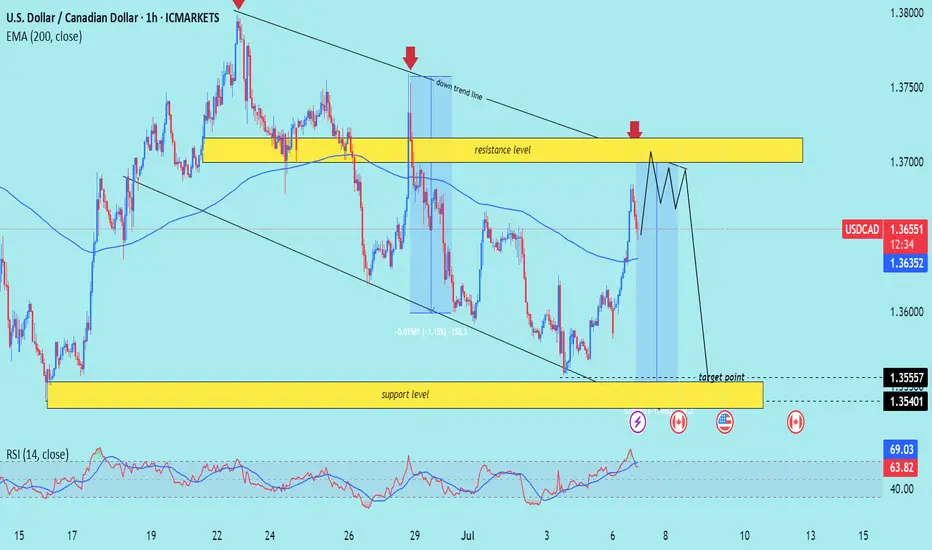
USD/CAD) Down Trand Read The captionSMC trading point update
Technical analysis of USD/CAD (U.S. Dollar / Canadian Dollar) on the 1-hour timeframe, with a focus on a potential double-top formation at strong resistance, followed by a drop toward support:
---
Analysis Overview
Trend Structure: Downward-sloping channel with lower highs and lower lows.
Confluence Area: The current rally is approaching both the upper channel boundary and a significant horizontal resistance zone (~1.3660–1.3700).
---
Key Technical Elements
1. Resistance & Double-Top Setup
The price nears the resistance zone (yellow) where it previously reversed (noted by red arrows).
A cap-and-float pattern (double/top-like structure) is projected: price pushes higher, hesitates, tests resistance again, then fails—a sign of weakening bullish momentum.
2. EMA 200 Interaction
The 1-hour EMA 200 (blue line at ~1.3635) sits just below current price.
A failure to sustain above this level reinforces the bearish case.
3. RSI Overextension
RSI (14) is around 64–69, indicating near-overbought conditions on this timeframe, suggesting a potential pullback.
4. Price Targets
Initial target: Lower channel boundary near 1.3556 (highlighted support).
Extended target: Beneath to 1.3540, aligning with the broader Demand zone.
---
Proposed Trade Setup
Step Action Level
Entry Short near top of resistance/channel (after double-top confirmation) 1.3680–1.3700
Stop-Loss Above recent high and channel resistance ~1.3720
Take Profit 1 Near EMA 200/lower channel bounce ~1.3556
Take Profit 2 Extended move to demand zone ~1.3540
Estimated Move ~1.15% drop from midday highs –
---
Risk & Event Factors
Scheduled Canadian or U.S. data releases (icons shown) could introduce volatility and disrupt technical patterns.
A breakout above ~1.3720 would invalidate this bearish thesis and shift bias bullish.
Mr SMC Trading point
---
Summary
Expecting a cap-and-float double-top formation at key resistance near 1.3660–1.3700, followed by a trend continuation drop toward 1.3556–1.3540. The bearish setup is supported by a down-channel structure, EMA 200 failure, and overbought RSI conditions.
Please support boost 🚀 this analysis)
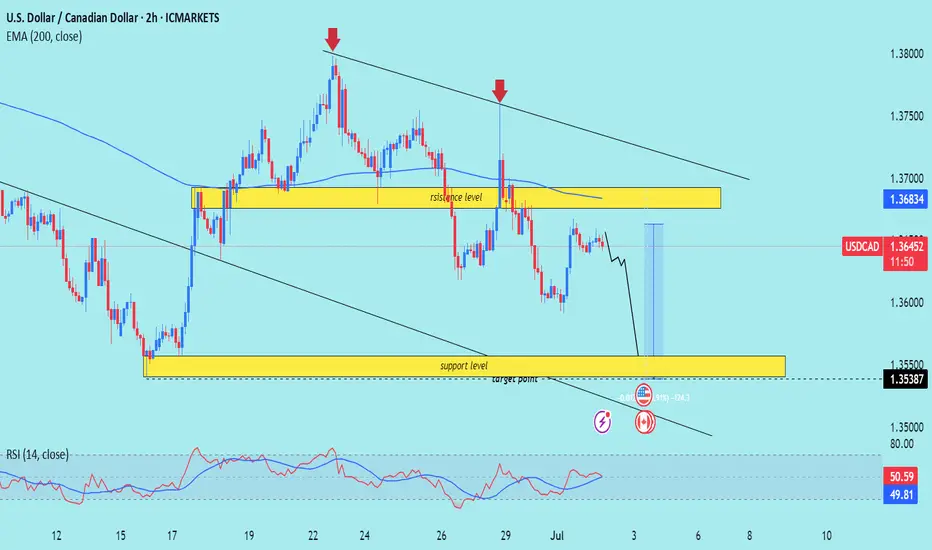
USD /CAD) bearish reversal analysis Read The captionSMC trading point update
Technical analysis of USD/CAD pair on the 2-hour timeframe, suggesting that the price is likely to drop toward the support zone. Here's the detailed idea behind the analysis:
---
Chart Breakdown (2H – USD/CAD)
1. Resistance Zone (Yellow Box - Top):
Marked as a strong supply area where price has repeatedly been rejected (highlighted by red arrows).
Acts as a key zone where sellers are in control.
Also aligns with a descending trendline, reinforcing bearish pressure.
2. Support Zone (Yellow Box - Bottom):
This is the target point marked at 1.35387, which previously served as a demand zone.
The chart suggests this level as the next significant area where price might find buyers.
3. Trend Context:
Price is moving within a descending channel (black trendlines), confirming the overall downtrend.
The 200 EMA (1.36834) is acting as dynamic resistance, keeping price under pressure.
4. Projected Move (Blue Box):
Shows a potential drop of ~91 pips toward the support level.
A bearish wave is anticipated as per the black zigzag line on the chart.
5. RSI Indicator:
RSI is near neutral (49.02 and 49.70) — suggesting no overbought/oversold conditions, but confirming lack of bullish momentum.
RSI is aligned with price trending down.
Mr SMC Trading point
---
Summary:
Bias: Bearish
Entry Zone: Near current price or minor pullback (1.364–1.365)
Target: 1.35387 (support zone)
Invalidation: Break and close above resistance level / 200 EMA (~1.3685)
Trend: Downtrend within channel
---
Please support boost 🚀 analysis)
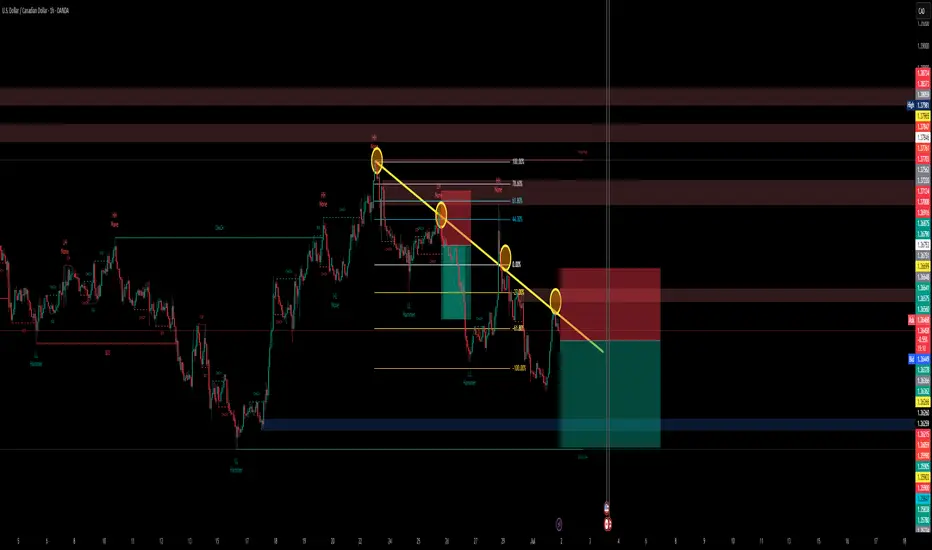
USDCADTrend Reversal Structure + Lower High + Supply Zone Rejection
Key Confirmations:
1.Market Shift from Bullish to Bearish (Structure Break)
Price formed a Lower High (LH) after a Higher High (HH).
A clear Break of Structure (BOS) to the downside occurred (marked on the chart), indicating a shift in trend from bullish to bearish.
2.Trendline Respect + Rejection
A clean downward trendline is drawn connecting HH → LH → lower LH.
Price rejected perfectly from the trendline, confirming resistance and bearish momentum.
3.Supply Zone Rejection
Price action touches a previously tested supply zone (highlighted in red).
That zone acted as resistance, and price failed to break above.
4.Bearish Continuation Setup
After forming a Lower Low (LL), price pulls back to create another Lower High (LH) – classic bearish continuation pattern.
USD/CAD ShortSell-limit order: 1.3838
Stop-loss: 1.3903
Target 1: 1.3705
Target 2: 1.3605
Target 3 (optional runner): 1.3455
Place the limit at 1.3838 and keep the stop above 1.3900; scale out at the listed targets as price moves in your favor.

USDCAD ( Weekly CLS Setup) Everything is clear here: a bearish order flow, with signs of manipulation and liquidity grabs above the structure highs. EUR/USD is trending upwards, presenting a good opportunity for a short trade on USD/CAD
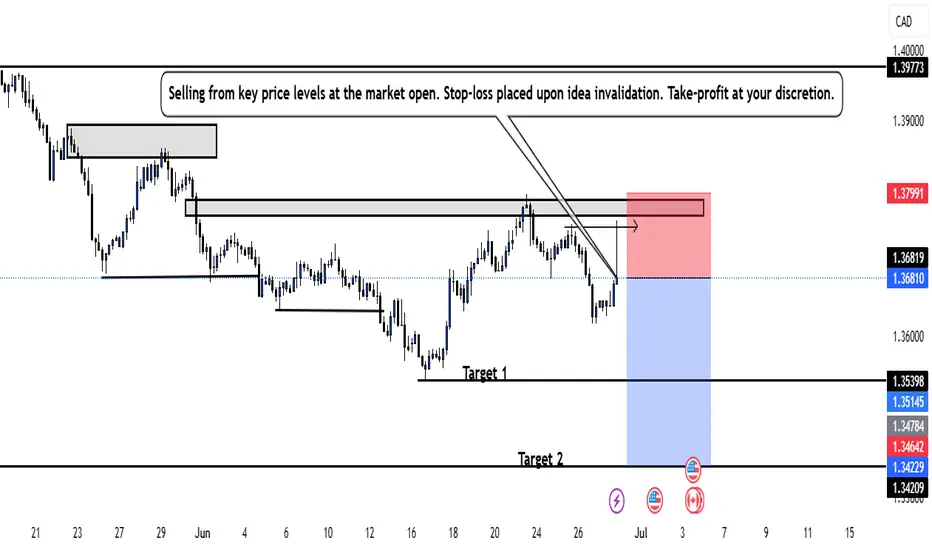
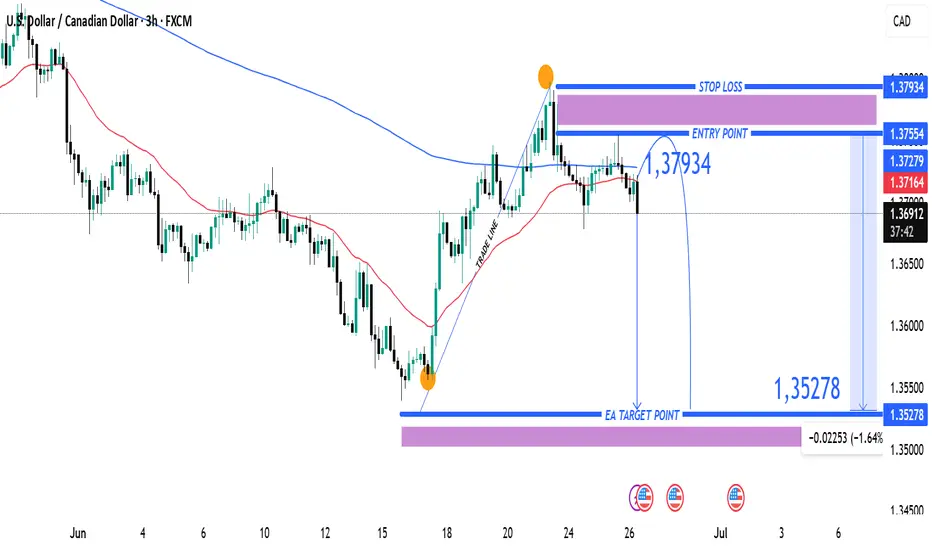
USDCAD Bearish Reversal Trade Setup – 3H Chart Analysis (June 26 Entry Zone: 1.37279 – 1.37554
🔹 Stop Loss: 1.37934
🔹 Target: 1.35278
🔹 Risk-to-Reward (RR): ~1:2.5
🧠 Technical Breakdown
Trend Overview:
Overall trend shows a downtrend from earlier June, followed by a corrective bullish move.
Price failed to sustain above the 200 EMA (blue line), indicating continued bearish pressure.
Trade Line Break:
A steep bullish trendline was broken, signaling a potential trend reversal or deeper pullback.
Bearish Rejection Zone:
The purple zone (1.37279 – 1.37554) acted as resistance.
Price formed a lower high and rejected this zone, confirming selling interest.
Entry Strategy:
Short entry is ideally within or just below the rejection zone.
Aggressive entry already in play at current market price (1.36909) after confirmation.
Target Zone:
Projected towards 1.35278, aligning with previous support and fib retracement zone.
Large purple support zone near the target suggests a potential reversal area.
⚠️ Risk Notes
Be cautious of USD volatility due to upcoming economic events (noted with icons on the chart).
Stop loss above previous swing high minimizes risk of fakeouts.
✅ Summary:
This is a bearish swing setup aiming for a significant drop toward 1.35278. The clean rejection from resistance and trendline break supports a high-probability short opportunity with favorable risk-reward.
USDCAD - Outlook Short on all IndicatorsUSDCAD - Outlook Short on all Indicators
TVC:DXY
FRED:TREASURY
ECONOMICS:USGD
US CONS
- The US Treasury is under $353.5 Billion.
- DXY will continue to fall.
- The Decline of the US Dollar will continue.
- US Debt has exceeded $36 Trillion
- US Federal Debt Deficiency of over $2 Trillion (Must be paid prior to Interest Payments)
- US Federal Interest (over $1 Trillion)
- War in Iran
- USD could be converted to GOLD and moved to BTC
- Moody's US credit rating reduce.
- Interest Rate Cuts
US PROS
- Trump could get funding from another country.
- Interest Rate increases
- Positive FOMC in July
USDCAD: Price Approaching Buying Zone, Will DXY Bounce Back? The USDCAD pair has dropped significantly in recent times, particularly as the DXY index has plummeted. The extremely bearish nature of the DXY suggests that the price of USDCAD is melting. Both fundamental and technical indicators indicate a potential bullish price reversal for this pair, which could potentially hit our first take-profit area. This is a swing analysis, so please give time for the trade to get activated and for it to work out in our favour.
Please note that this analysis does not guarantee that the price will move as suggested. Before trading, it’s essential to conduct your own research.
If you’d like to assist us, we encourage you to consider the following actions:
- Like our ideas
- Provide comments on our ideas
- Share our ideas
Kind regards,
Team Setupsfx_
Much love ❤️🚀
USDCAD: If This Breaks, USDCAD Might Be Lining Up a Smooth DropUSDCAD tapped into a clear liquidity zone and showed signs of weakness at the top. Price is now hovering near a potential break of structure, and a fair value gap has formed just above.
If we get that break, the idea is to wait for price to retrace into the FVG, then look for a clean continuation to the downside.
There’s also a bearish trendline holding well, adding pressure to the move. On top of that, a head and shoulders pattern is forming, another clue that momentum could be shifting lower.
No need to rush. Let the break happen. Let price return. Then act.
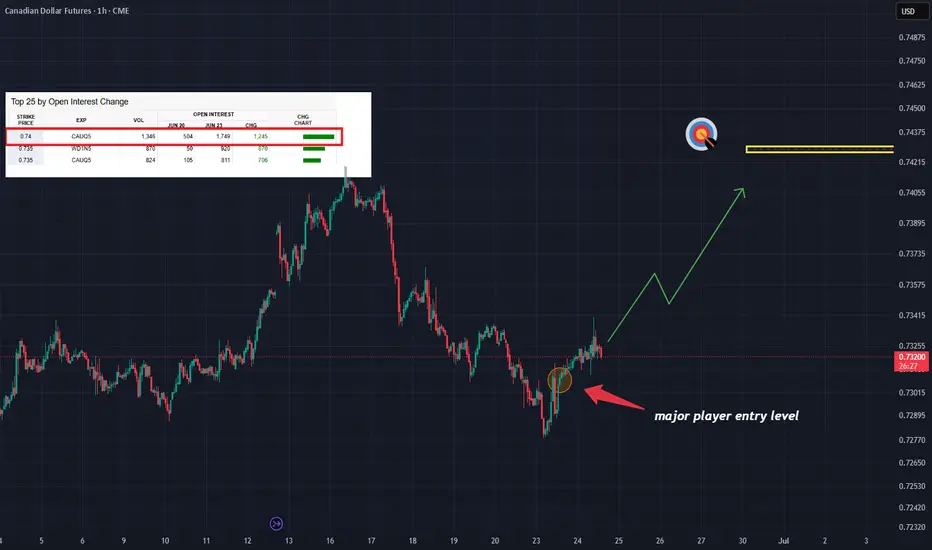
CAD Option Flow Positive Sentiment. It's worth taking a closer Based on the analysis of yesterday's trading on CME, we have captured an excellent portfolio in the lens.
The trader methodically formed this position in a 5-minute period of time, which is a good sign.
Сonfirmation - the market is already moving in his direction
But, reasonable entry level - above 0.7339.
Don't rush it. The risk/profit ratio is still at acceptable levels, but it's worth waiting for the resistance to be overcome.
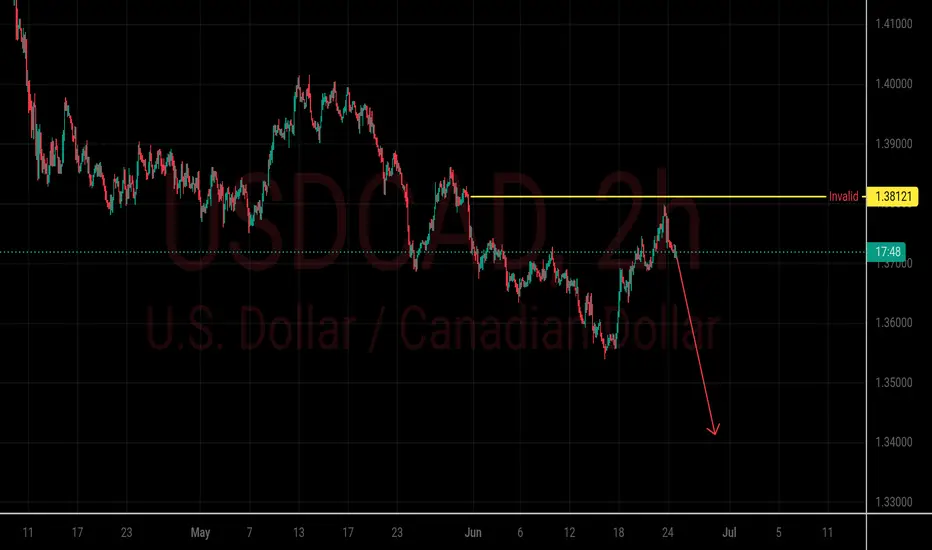
USDCAD Bearish OutlookTrend: Bearish (Lower highs and lower lows)
Key Resistance / Invalidation Level: 1.38121
Current Price: ~1.3700–1.3750 range
Expected Move: Further downside towards the 1.3500–1.3420 area unless price breaks and closes above 1.38121.
---
🎯 Trade Plan
Setup: Look for bearish entries on retracements towards the 1.3700–1.3750 area.
Invalidation: A confirmed breakout and close above 1.38121.
Target: 1.3500–1.3420 range.
--
⚡️ Summary
USDCAD remains in a downtrend, making lower highs and lower lows. As long as price stays below 1.38121, the bearish outlook is favored.
---
⚠️ Disclaimer
This is NOT financial advice. All trading involves significant risk, and you should only trade with money you can afford to lose. Always do your own analysis or consult with a qualified financial advisor before making any trading decisions.
USDCAD H4 AnalysisUSDCAD Showing a Bearish Flag. If it breaks this zone above, Most probably can fly up to 1.37836 and higher to 1.38654. If no, Can rally between 1.36359, 1.35415 or even lower. Trading Analysis from 23-06-25 to 27-06-25. Take your risk under control and wait for market to break support or resistance on smaller time frame. Best of luck everyone and happy trading.🤗
