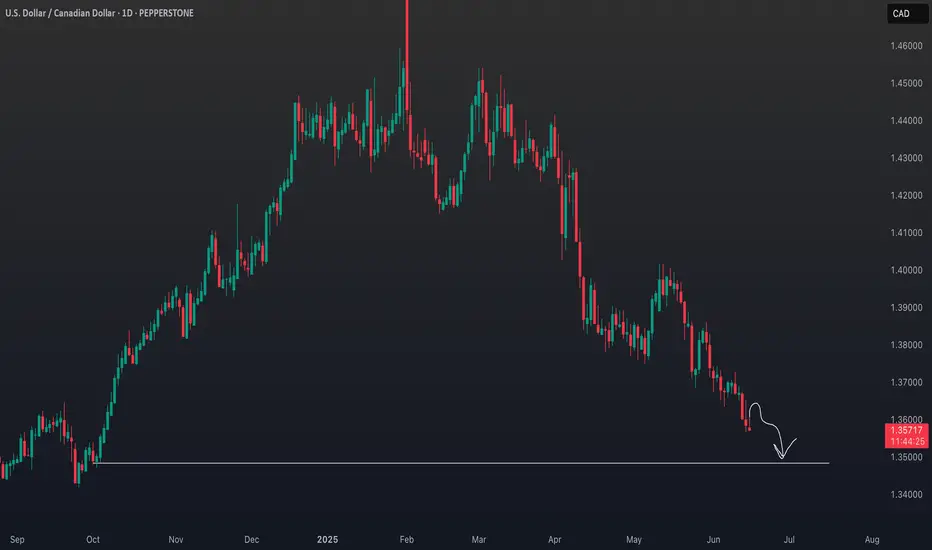
USDCAD - ShortAwaiting a weekly break in the 100 and 200 Moving Average then take to $1.35 or lower.
Usdcadshort

SHORT ON USD/CADUSD/CAD has given a confirmation choc (change of character) from up to down on the lower timeframe (5min) from a MAJOR supply area.
I will be selling USD/CAD looking to make over 100 pips to the next demand level.
USD/CAD(20250618)Today's AnalysisMarket news:
World Gold Council: 95% of central banks expect gold reserves to rise in the next 12 months.
Technical analysis:
Today's buying and selling boundaries:
1.3642
Support and resistance levels:
1.3778
1.3727
1.3694
1.3590
1.3557
1.3506
Trading strategy:
If the price breaks through 1.3694, consider buying, the first target price is 1.3727
If the price breaks through 1.3642, consider selling, the first target price is 1.3590
USDCAD - Strong SellStrong Sell under 200 moving average and 100 moving average. OIL prices will rise due to middle east conflict. Which will increase the price of CAD expecting around .74 cents or higher with full support.

USD/CAD)) Bearish Trand analysis Read The captionSMC trading point update
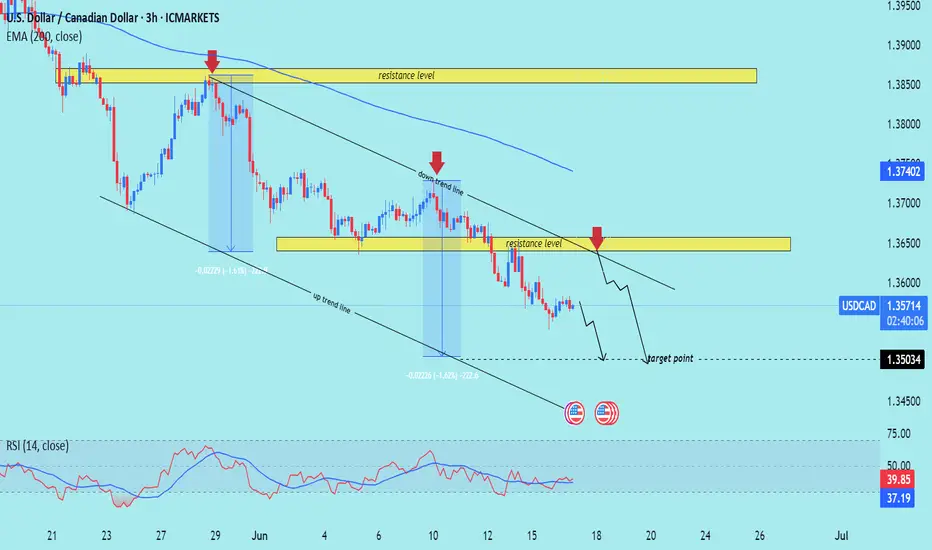
Technical analysis of USD/CAD on the 3-hour timeframe, using Smart Money Concepts (SMC) and classic technical analysis. Here's a breakdown
---
Key Technical Insights:
Overall Trend:
The pair is in a clear downtrend, confirmed by:
Lower highs and lower lows
Price trading below the 200 EMA (currently at 1.37402)
Respect for the downtrend channel
---
Resistance Zones:
1. Upper Resistance Zone (~1.38400 – 1.38750):
Strong historical sell area (price sharply reversed here in late May)
2. Mid Resistance Zone (~1.36450 – 1.36750):
Price reacted twice here and dropped.
Aligns with the downtrend line and was recently tested again (red arrow).
---
Bearish Projections:
After the latest pullback into the resistance zone, price is expected to:
Reject the zone
Continue following the descending structure
Target marked around 1.35034, which coincides with:
Previous low
Lower boundary of the descending channel
Mr SMC Trading point
---
Chart Tools & Features Used:
Trendlines: Clearly marking the downtrend channel
200 EMA: Used as dynamic resistance
Fib-like measured move: Mirrored previous impulse moves (-1.61%) suggesting a symmetric drop
Arrows: Indicating reaction points from resistance
---
Conclusion:
Bias: Bearish
Invalidation: Break and hold above 1.36500 would weaken the bearish outlook.
Next Move: Potential sell setups on lower timeframe retests or bearish confirmations within the resistance zone.
Please support boost 🚀 this analysis)
USDCAD Bearish Bias: Beware Liquidity Traps & Reversal Risks.I'm currently keeping a close eye on USDCAD, which has been in a strong bearish trend. 📉
In this video, I explain how the market is unfolding across both the higher and lower timeframes, and why it’s critical to watch them in conjunction. On the lower timeframes, we often see a clean sequence of lower highs and lower lows, as the algos set up a seemingly a smooth trend. But traders should be cautious ⚠️
Why? Because on the higher timeframes, the market can easily pull back, triggering a liquidity hunt. This is often when the algorithm targets stop orders above recent highs, before resuming the trend 🧠💥
While my bias remains bearish, I'm also aware of the risk that the market could shift gears unexpectedly to run stops and shake out weak hands. This concept is fully broken down in the video — with examples of how to spot these traps and prepare accordingly 🎯

USDCAD Under Pressure: Chart Signals & Macro Forces Point South!The USDCAD pair is under clear pressure, as illustrated in this chart 📊. The visual structure highlights a persistent bearish trend, with price action consistently forming lower highs and lower lows. The chart is reinforcing the idea that sellers are dominating the market. Notably, the drawn arrow in the chart points toward previous higher timeframe lows, suggesting that these areas could be the next logical targets for price action if the current trend persists.
On the fundamental side, the US dollar has been weakened by dovish signals from the Federal Reserve and softer economic data, fueling expectations of potential rate cuts later this year 🏦. In contrast, the Canadian dollar has been buoyed by strong commodity prices—especially oil—and a relatively hawkish Bank of Canada. The bearish structure seen in the chart aligns with these macro drivers, as the CAD continues to benefit from both domestic strength and global demand for commodities.
Geopolitically, ongoing global trade tensions and shifting risk sentiment have further supported the Canadian dollar, as investors seek stability in commodity-backed currencies 🌍. The combination of these factors, as reflected in the chart, suggests that USDCAD remains vulnerable, and a move down to retest previous higher timeframe lows is a real possibility unless there’s a significant shift in the underlying fundamentals.
Traders should keep an eye on the key support zones highlighted in the chart, as these could provide clues for potential exhaustion or reversal in the current trend 🔎.
Disclaimer: This analysis is for informational purposes only and does not constitute financial advice. Please conduct your own research or consult a professional before making any trading decisions.
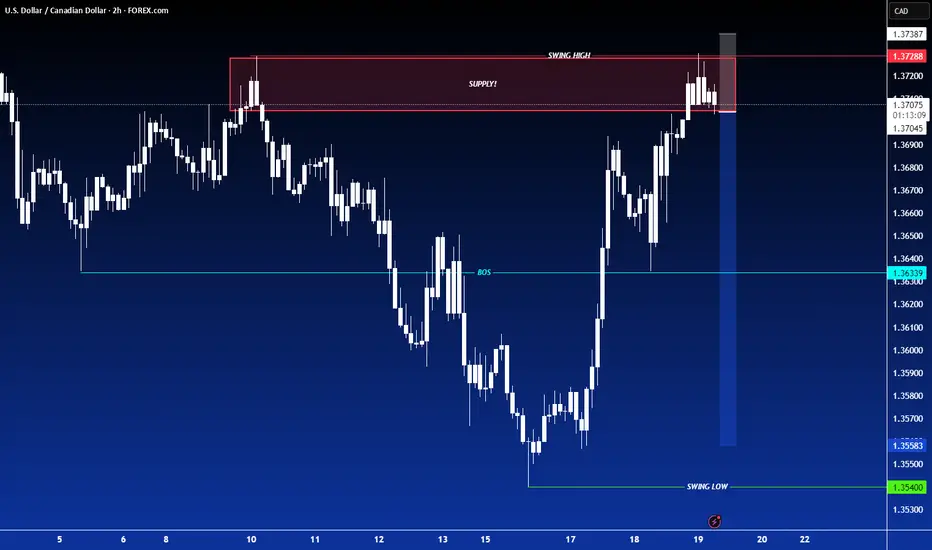
USD/CAD) Down Trand analysis Read The captionSMC trading point update
Technical analysis of USD/CAD (U.S. Dollar / Canadian Dollar) currency pair on the 2-hour timeframe, and it suggests a potential sell setup based on price action, key levels, and momentum indicators.
---
Chart Summary
Pair: USD/CAD
Timeframe: 2H
Current Price: 1.36432
EMA 200: 1.37436
Direction Bias: Bearish
Volume: 6.92K
Key Tool: EMA 200, RSI, Support/Resistance Zones
---
Technical Breakdown
1. Resistance Zone / Supply Area (~1.3680 - 1.3700)
The yellow box highlights a strong resistance zone.
Marked by three red arrows, where price has repeatedly rejected.
Indicates clear seller dominance in this area.
2. Break of Support Level
Price broke below the yellow support area and is now trading below it.
This signals a bearish breakout from a consolidation zone.
3. EMA 200 Trend Confirmation
EMA 200 (blue line) is sloping down.
Price is below the EMA, confirming bearish trend bias.
Acts as dynamic resistance.
4. Bearish Flag/Channel Break
A bearish flag or wedge pattern seems to have been broken downward.
The measured move (blue vertical line) suggests the projected drop.
---
Target Point
Target Price: 1.34951
This is based on the measured move from the resistance zone.
It aligns with the previous demand/support zone.
---
RSI (Relative Strength Index)
RSI (14) is 36.37, approaching the oversold zone.
This shows strong bearish momentum, but it also means price may stall or bounce slightly before continuing downward.
---
Trade Setup Idea
Entry: After confirmation of breakout below 1.3640
Stop Loss: Above 1.3700 (resistance zone)
Take Profit: 1.34951
Risk-to-Reward: ~1:2+
---
Risk Management & Caution
If price moves back into the yellow zone or breaks above 1.3700, the setup is invalidated.
Watch for high-impact news events (marked on the chart with U.S. flags) that may trigger volatility.
Mr SMC Trading point
---
Conclusion
This is a well-structured bearish idea based on:
Resistance rejections
Break of support
Downward EMA slope
Bearish RSI reading
It reflects strong downside potential toward 1.3495, offering a clean shorting opportunity for swing traders
Please support boost 🚀 this analysis)

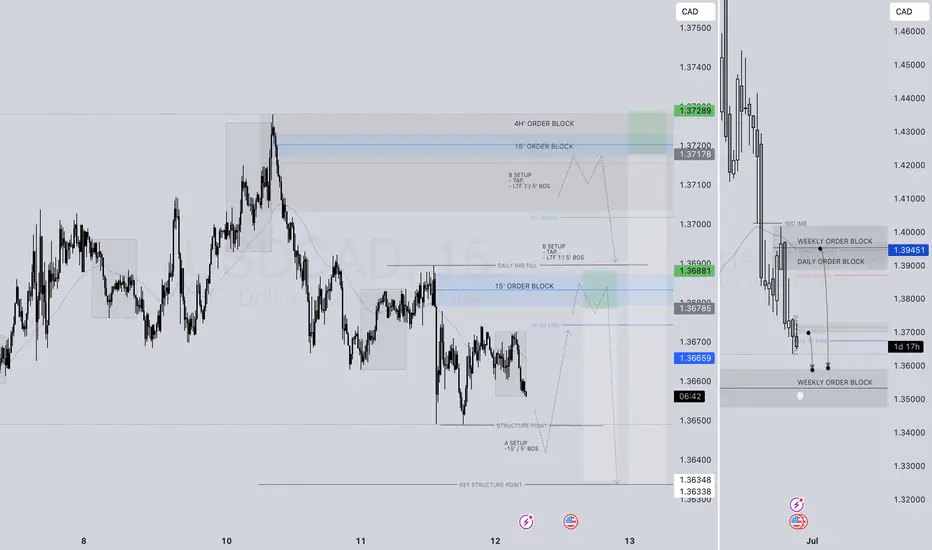
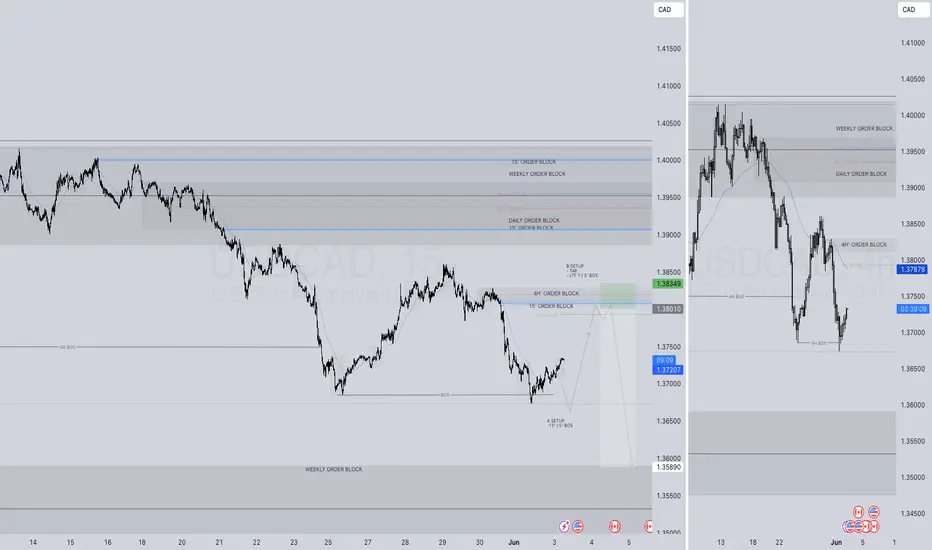
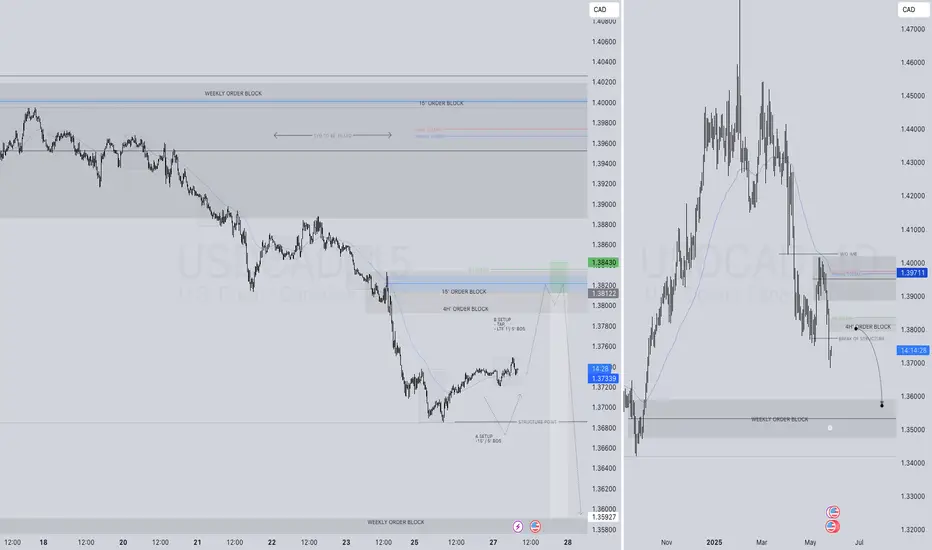
USDCAD SHORT FORECAST Q2 W24 D12 Y25USDCAD SHORT FORECAST Q2 W24 D12 Y25
Professional Risk Managers👋
Welcome back to another FRGNT chart update📈
Diving into some Forex setups using predominantly higher time frame order blocks alongside confirmation breaks of structure.
💡Here are some trade confluences📝
✅4H order block rejection
✅HTF 50 EMA
✅Intraday bearish breaks of structure to be identified
✅15’ order block identified
🔑 Remember, to participate in trading comes always with a degree of risk, therefore as professional risk managers it remains vital that we stick to our risk management plan as well as our trading strategies.
📈The rest, we leave to the balance of probabilities.
💡Fail to plan. Plan to fail.
🏆It has always been that simple.
❤️Good luck with your trading journey, I shall see you at the very top.
🎯Trade consistent, FRGNT X
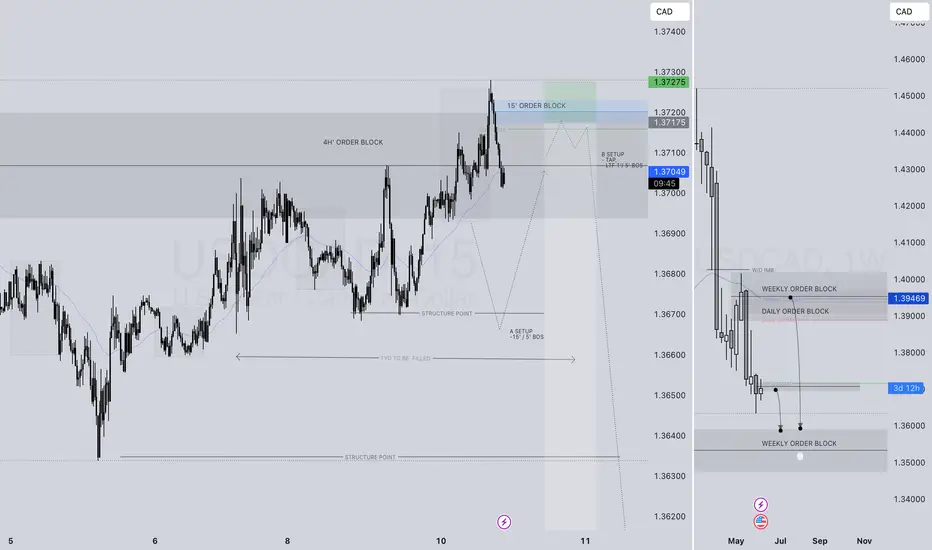
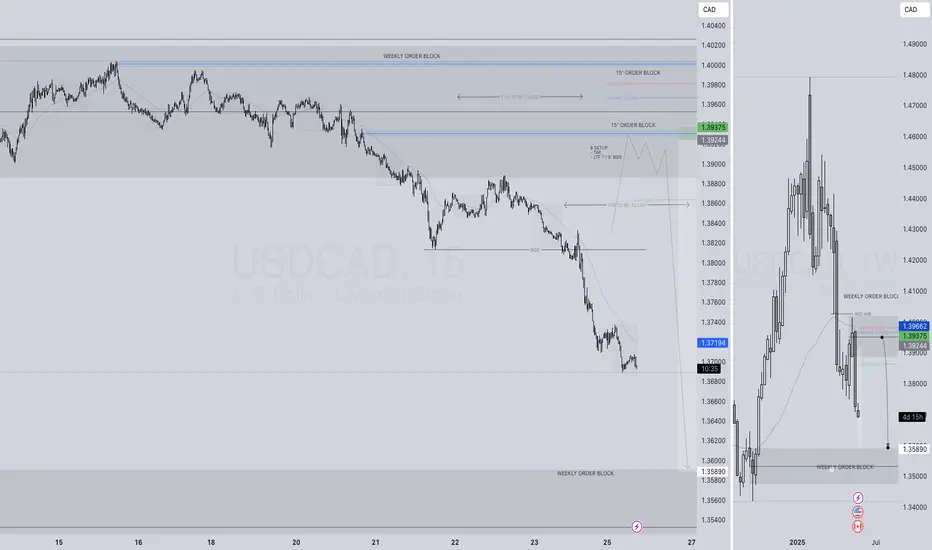
USDCAD SHORT FORECAST Q2 W24 D10 Y25🔥👀USDCAD SHORT FORECAST Q2 W24 D10 Y25
TECHNICAL HOTPICK ! 💥💥
Professional Risk Managers👋
Welcome back to another FRGNT chart update📈
Diving into some Forex setups using predominantly higher time frame order blocks alongside confirmation breaks of structure.
💡Here are some trade confluences📝
✅4H order block rejection
✅HTF 50 EMA
✅Intraday bearish breaks of structure to be identified
✅15’ order block identified
🔑 Remember, to participate in trading comes always with a degree of risk, therefore as professional risk managers it remains vital that we stick to our risk management plan as well as our trading strategies.
📈The rest, we leave to the balance of probabilities.
💡Fail to plan. Plan to fail.
🏆It has always been that simple.
❤️Good luck with your trading journey, I shall see you at the very top.
🎯Trade consistent, FRGNT X
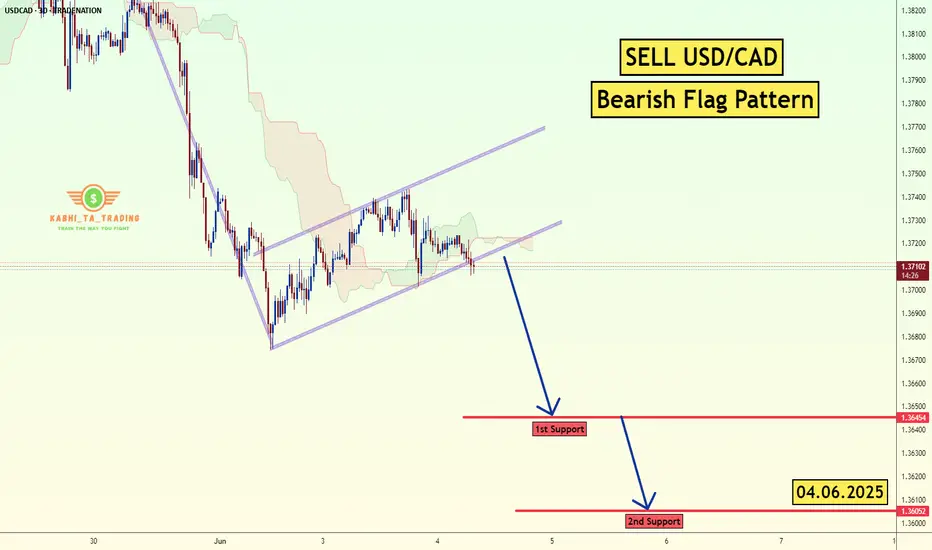
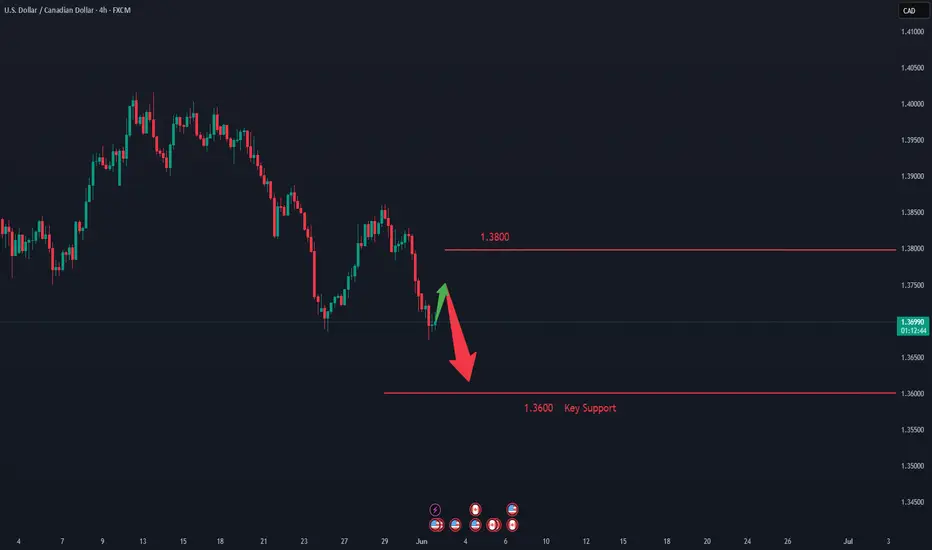
USD/CAD - Bearish Flag (04.06.2025)The USD/CAD Pair on the M30 timeframe presents a Potential Selling Opportunity due to a recent Formation of a Bearish Flag Pattern. This suggests a shift in momentum towards the downside in the coming hours.
Possible Short Trade:
Entry: Consider Entering A Short Position around Trendline Of The Pattern.
Target Levels:
1st Support – 1.3645
2nd Support – 1.3605
🎁 Please hit the like button and
🎁 Leave a comment to support for My Post !
Your likes and comments are incredibly motivating and will encourage me to share more analysis with you.
Best Regards, KABHI_TA_TRADING
Thank you.
Disclosure: I am part of Trade Nation's Influencer program and receive a monthly fee for using their TradingView charts in my analysis.
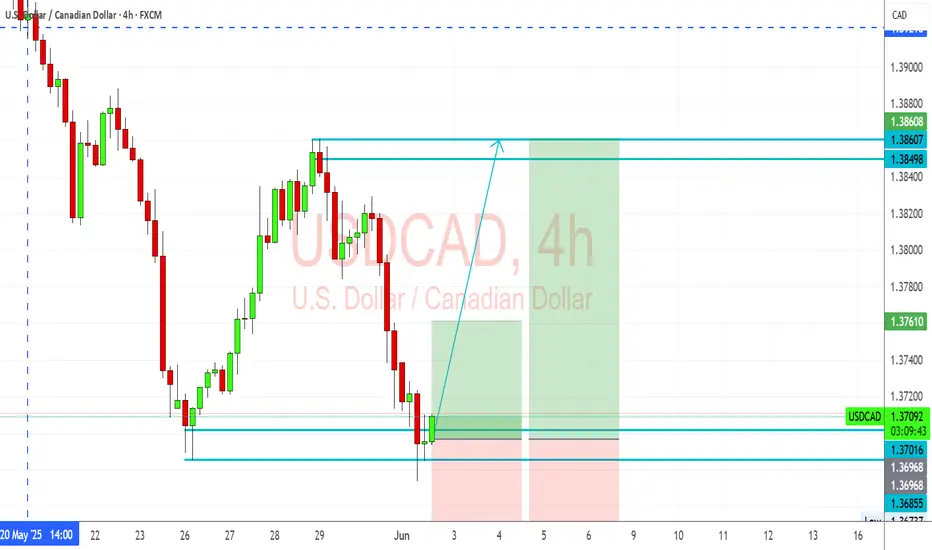
USDCAD Rebound from Key Support – Bullish Setup in PlayUSDCAD pair has reached a technical inflection point at key support around 1.3700, where it is attempting a rebound after several days of bearish momentum. With recent Canadian data showing underlying economic strain and the U.S. dollar reacting to rate expectations and tariff news, this area becomes crucial for the next directional move.
🔍 Technical Analysis
Support Level: Price has respected the horizontal support at 1.3700–1.3685, forming a possible double-bottom structure on the 4H chart.
Bullish Reversal Zone: The latest candle shows a strong rejection wick at the support zone, suggesting bullish interest. The structure aligns with a classic bullish reversal pattern.
Target Zones:
First TP: 1.3849 (previous high / supply zone).
Second TP: 1.3860–1.3870 (Fibonacci extension + minor resistance).
Invalidation (SL): Below 1.3685, further downside may open to 1.3632.
🧠 Fundamental Context
U.S. Side:
GDP and NFP data have recently come out mixed, reducing the immediate pressure on the Fed to hike rates further.
Tariff uncertainty and appeal plans by the Trump administration are increasing near-term USD volatility.
US bond yields are firming again, giving the dollar mild support.
Canada Side:
Canadian Q1 GDP disappointed at 0.1%, lower than expected.
BoC is likely to hold rates steady, but the economy shows weak business investment and softening consumption growth.
Crude oil, Canada’s key export, is still under pressure, slightly weakening CAD.
✅ Conclusion
This setup favors a short-term long on USDCAD from current levels, targeting the upper resistance zone at 1.3849–1.3860. A break and close above 1.3870 could extend toward 1.3900. However, caution should be exercised with upcoming U.S. labor and trade data that may fuel volatility.
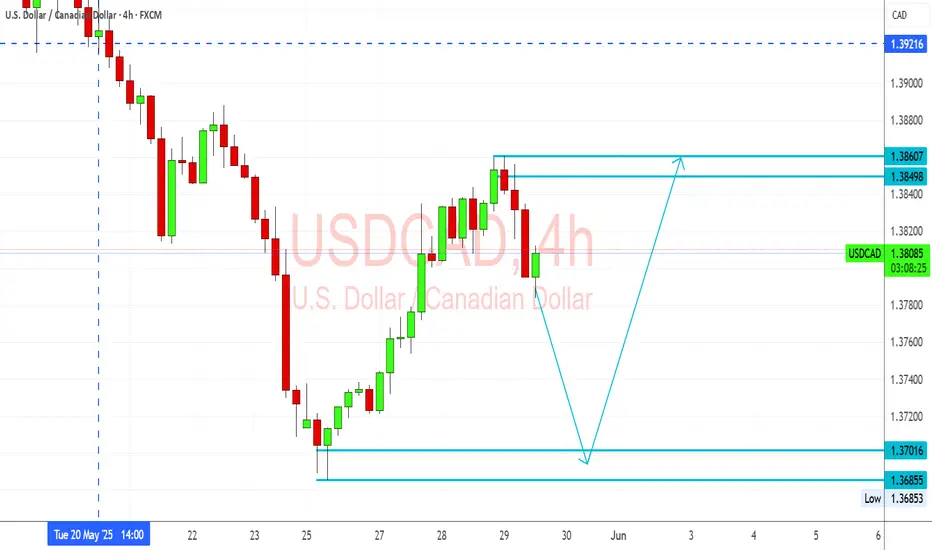
USDCAD Price Rebounding from Key Support as CAD WeakensUSDCAD is showing signs of a potential reversal from key support around the 1.3700–1.3685 zone. The pair had been declining steadily but recent weakness in the Canadian Dollar — driven by soft economic data and oil market uncertainty — is starting to shift momentum back in favor of the U.S. Dollar. As long as support holds, there is room for a bullish continuation toward 1.3860 or higher in the near term.
Technical Analysis (4H Chart)
Trend Structure: After a strong impulsive drop earlier in May, USDCAD formed a rounded bottom near 1.3685, followed by a corrective bounce. The recent retracement toward the support area is forming a potential higher low setup.
Support Zone:
Primary Support: 1.3700–1.3685
This is a clean structure zone and previous demand level. Price tested this area on May 24–25 and rebounded sharply.
Resistance Zone:
Short-Term Target: 1.3849–1.3860
This is the next major horizontal resistance, and aligns with previous price congestion before the latest decline.
Price Projection:
The chart suggests a bullish wave may develop from the support zone, targeting the 1.3860 level. If broken, a further move toward 1.3920 (May swing high) is possible.
Invalidation Level:
A daily close below 1.3680 would negate the bullish bias and signal a deeper correction or trend continuation lower.
Fundamental Analysis
U.S. Dollar (USD) Drivers:
Q1 GDP second estimate shows steady but modest growth.
Consumer Confidence fell recently, capping upside for the USD short term.
The Fed remains cautious, signaling that inflation risks persist — keeping interest rates elevated, which supports USD.
U.S. Treasury yields have been stable to slightly higher, also helping support the dollar.
Canadian Dollar (CAD) Drivers:
Canada's balance of payments posted a larger-than-expected deficit in Q1 — a negative for CAD.
Oil prices, which heavily influence CAD, have been under pressure from global demand uncertainty.
Domestic demand is softening: flat retail sales and weak trade balance data reduce CAD appeal.
Bank of Canada is showing signs of policy caution, especially as inflation slows faster than in the U.S.
Conclusion
Outlook: Short-term bullish
USDCAD is likely to bounce from the 1.3700–1.3685 zone and retest 1.3849–1.3860 if CAD weakness continues.
Trade Plan (if trading):
Buy Zone: 1.3700–1.3685
Target: 1.3860
Stop Loss: Below 1.3680 (structure break)
The pair is fundamentally supported by CAD weakness and technically primed for a rebound — but confirmation from price action near support is critical.
TECHNICAL APPROACH - USDCAD SHORT FORECAST Q2 W23 D23 Y25🔥👀USDCAD SHORT FORECAST Q2 W23 D23 Y25
TECHNICAL HOTPICK ! 💥💥
Professional Risk Managers👋
Welcome back to another FRGNT chart update📈
Diving into some Forex setups using predominantly higher time frame order blocks alongside confirmation breaks of structure.
💡Here are some trade confluences📝
✅4H order block rejection
✅HTF 50 EMA
✅Intraday bearish breaks of structure to be identified
✅15’ order block identified
🔑 Remember, to participate in trading comes always with a degree of risk, therefore as professional risk managers it remains vital that we stick to our risk management plan as well as our trading strategies.
📈The rest, we leave to the balance of probabilities.
💡Fail to plan. Plan to fail.
🏆It has always been that simple.
❤️Good luck with your trading journey, I shall see you at the very top.
🎯Trade consistent, FRGNT X
USD/CAD Market ObservationThe USD/CAD exchange rate extended its decline, hitting an intraday low of 1.3673 and a new year-to-date low. The US Dollar Index weakened across the board under multiple bearish factors, while the Canadian Dollar remained strong supported by robust economic data. USD/CAD has fully broken below a key support zone, accelerating its downward trend after breaching the 1.3800 level. Current market sentiment is clearly bearish on the US Dollar. Uncertainties surrounding tariff policies and the strengthening expectation of Federal Reserve rate cuts have left the US Dollar lacking upward momentum. Meanwhile, strong Canadian economic data and expectations that the Bank of Canada will maintain a hawkish stance have provided solid support for the Canadian Dollar. Traders generally believe that with the obvious divergence in fundamentals, USD/CAD still has further downside potential.
Humans need to breathe, and perfect trading is like breathing—maintaining flexibility without needing to trade every market swing. The secret to profitable trading lies in implementing simple rules: repeating simple tasks consistently and enforcing them strictly over the long term.
Trading Strategy:
sell@1.3750-1.3800
TP:1.3550-1.3600
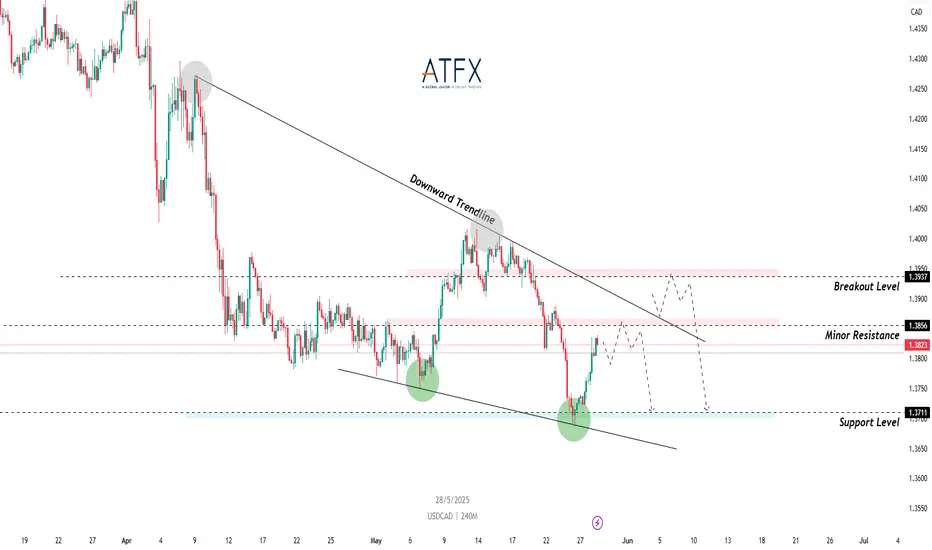
Cautious Bulls Meet Trendline Test: USD/CAD Eyes FOMC CatalystCMCMARKETS:USDCAD OANDA:USDCAD USD/CAD extended its recovery for the third day, trading near 1.3833 on modest USD strength following upbeat U.S. data. However, fiscal worries and expectations of Fed rate cuts in 2025 may limit upside momentum. Traders are cautious ahead of the FOMC Minutes and U.S. PCE/GDP data, while firmer Canadian inflation and oil prices could support the CAD.
Technically, the pair remains within a broad downward channel and is now approaching key resistance at 1.3856, aligned with the descending trendline. A clear rejection here could spark a bearish continuation toward 1.3711 support. A breakout above 1.3937 would invalidate the bearish channel and suggest trend reversal.
Resistance : 1.3856 , 1.3937
Support : 1.3711 , 1.3809
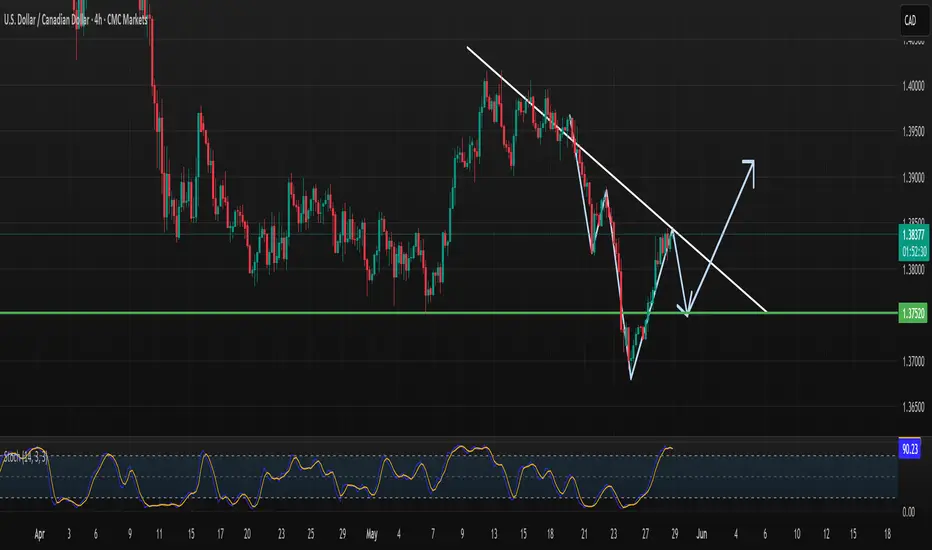
USDCAD - Short term bearish long term bullishI was analyzing USDCAD and I noticed two type of patterns. One pattern is a strong bearish pattern to a strong bullish pattern. Hope it helps.
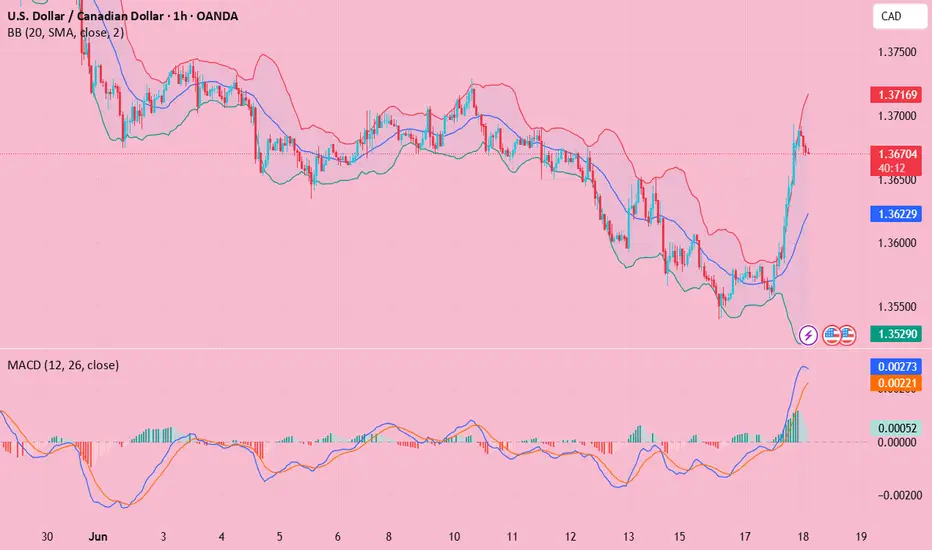
USDCAD Bearish Signal | Technical + Custom AlgoSmart Trend Signal | Technical Analysis + Custom Algorithm
This signal is the result of a combination of classic technical trend analysis and a proprietary software I personally developed.
AWAIT BOS FIRST!! USDCAD SHORT FORECAST Q2 W22 D29 Y25
🔥👀USDCAD SHORT FORECAST Q2 W22 D29 Y25
Professional Risk Managers👋
Welcome back to another FRGNT chart update📈
Diving into some Forex setups using predominantly higher time frame order blocks alongside confirmation breaks of structure.
💡Here are some trade confluences📝
✅Daily Order block
✅HTF 50 EMA
✅Intraday bearish breaks of structure to be identified
✅15’ order block identified
🔑 Remember, to participate in trading comes always with a degree of risk, therefore as professional risk managers it remains vital that we stick to our risk management plan as well as our trading strategies.
📈The rest, we leave to the balance of probabilities.
💡Fail to plan. Plan to fail.
🏆It has always been that simple.
❤️Good luck with your trading journey, I shall see you at the very top.
🎯Trade consistent, FRGNT X
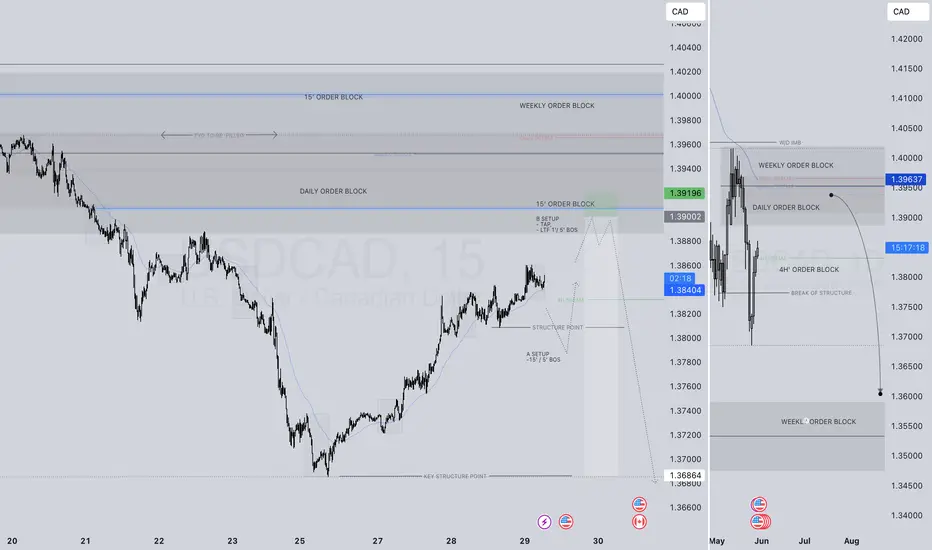
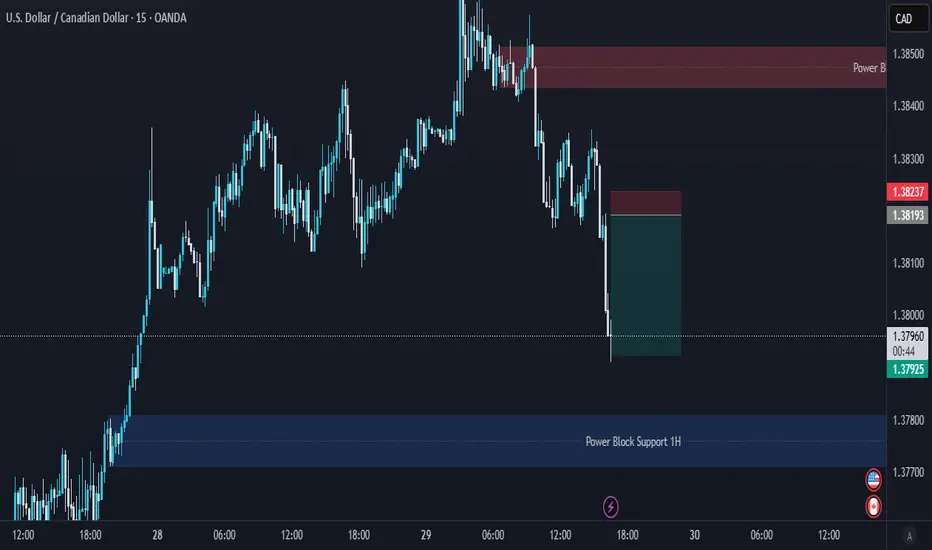
SNAP SHORT USDCAD SHORT FORECAST Q2 W22 D27 Y25🔥👀USDCAD SHORT FORECAST Q2 W22 D27 Y25
Professional Risk Managers👋
Welcome back to another FRGNT chart update📈
Diving into some Forex setups using predominantly higher time frame order blocks alongside confirmation breaks of structure.
💡Here are some trade confluences📝
✅4H Order block
✅4H 50 EMA
✅Intraday bearish breaks of structure
✅15’ order block identified
🔑 Remember, to participate in trading comes always with a degree of risk, therefore as professional risk managers it remains vital that we stick to our risk management plan as well as our trading strategies.
📈The rest, we leave to the balance of probabilities.
💡Fail to plan. Plan to fail.
🏆It has always been that simple.
❤️Good luck with your trading journey, I shall see you at the very top.
🎯Trade consistent, FRGNT X
IN DEPTH HIGHER TIME FRAME ALIGNMENT!USDCAD SHORT FORECAST Q2 W2🔥👀USDCAD SHORT FORECAST Q2 W22 D26 Y25
IN DEPTH HIGHER TIME FRAME ALIGNMENT! 🔥👀
Professional Risk Managers👋
Welcome back to another FRGNT chart update📈
Diving into some Forex setups using predominantly higher time frame order blocks alongside confirmation breaks of structure.
💡Here are some trade confluences📝
✅Weekly 50 EMA
✅Daily 50 EMA
✅4 Hour 50 EMA
✅15’ order block identified
🔑 Remember, to participate in trading comes always with a degree of risk, therefore as professional risk managers it remains vital that we stick to our risk management plan as well as our trading strategies.
📈The rest, we leave to the balance of probabilities.
💡Fail to plan. Plan to fail.
🏆It has always been that simple.
❤️Good luck with your trading journey, I shall see you at the very top.
🎯Trade consistent, FRGNT X
HTF ALIGNMENT USDCAD SHORT FORECAST Q2 W22 Y25USDCAD SHORT FORECAST Q2 W22 Y25
HIGHER TIME FRAME ALIGNMENT!
Professional Risk Managers👋
Welcome back to another FRGNT chart update📈
Diving into some Forex setups using predominantly higher time frame order blocks alongside confirmation breaks of structure.
💡In depth trade confluences provided during the week 📝
🔑 Remember, to participate in trading comes always with a degree of risk, therefore as professional risk managers it remains vital that we stick to our risk management plan as well as our trading strategies.
📈The rest, we leave to the balance of probabilities.
💡Fail to plan. Plan to fail.
🏆It has always been that simple.
❤️Good luck with your trading journey, I shall see you at the very top.
🎯Trade consistent, FRGNT X

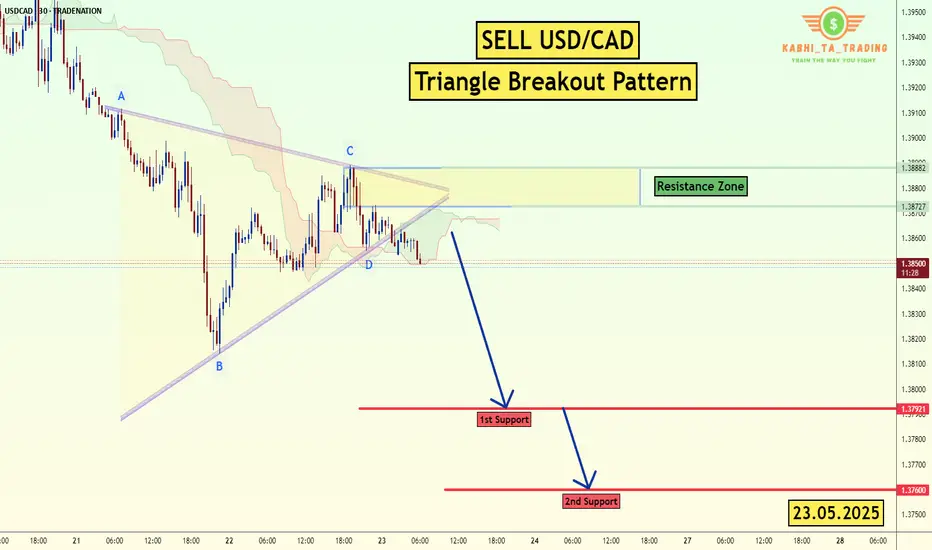
USD/CAD - Triangle Breakout (23.05.2025)The USD/CAD Pair on the M30 timeframe presents a Potential Selling Opportunity due to a recent Formation of a Triangle Breakout Pattern. This suggests a shift in momentum towards the downside in the coming hours.
Possible Short Trade:
Entry: Consider Entering A Short Position around Trendline Of The Pattern.
Target Levels:
1st Support – 1.3792
2nd Support – 1.3760
🎁 Please hit the like button and
🎁 Leave a comment to support for My Post !
Your likes and comments are incredibly motivating and will encourage me to share more analysis with you.
Best Regards, KABHI_TA_TRADING
Thank you.
Disclosure: I am part of Trade Nation's Influencer program and receive a monthly fee for using their TradingView charts in my analysis.