USDCAD → Fall to 1.35200 or 1.40000!? Here's What We Know.USDCAD closed a bear candle below its bull channel support last week, leaving the bulls to wonder if this is the beginning of the end! Will the US Dollar recover and bring us back into the bull channel?
How do we trade this?
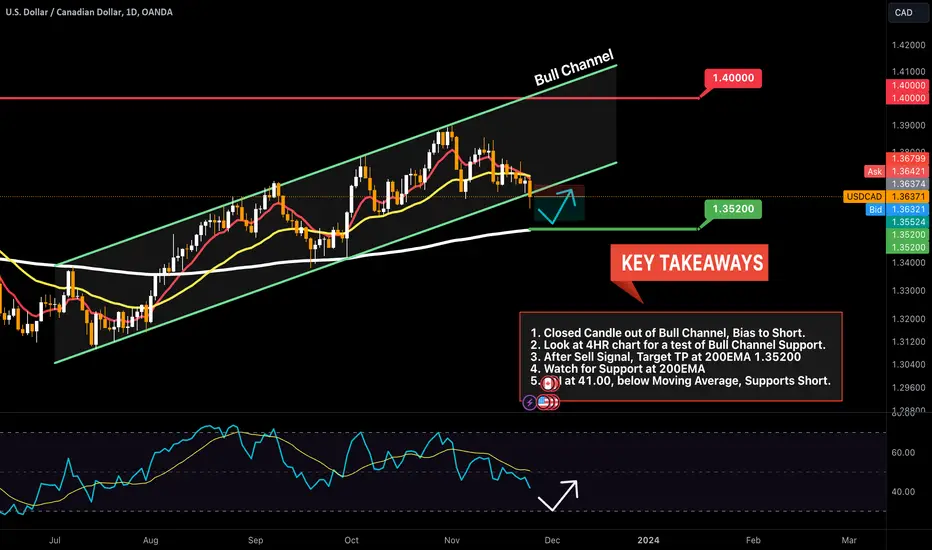
We closed a candle below the bull channel, it's reasonable to be biased to short in the short term. The price may want to make contact with the 200EMA at 1.35200 where it could show support and bounce to the upside. I think a short for 100 pips to 1.35200 is reasonable with a protective stop just above the bull channel support. It would be reasonable to take some or all profit just above the 200EMA, but you could hold some and see if the price falls further.
Key Takeaways
1. Closed Candle out of Bull Channel, Bias to Short.
2. Look at 4HR chart for a test of Bull Channel Support.
3. After Sell Signal, Target TP at 200EMA 1.35200
4. Watch for Support at 200EMA
5. RSI at 41.00, below Moving Average, Supports Short.
You are solely responsible for your trades, trade at your own risk!
If you found this analysis helpful, click the Boost button and let us know what you think in the comment section below!
Usdcadsignal
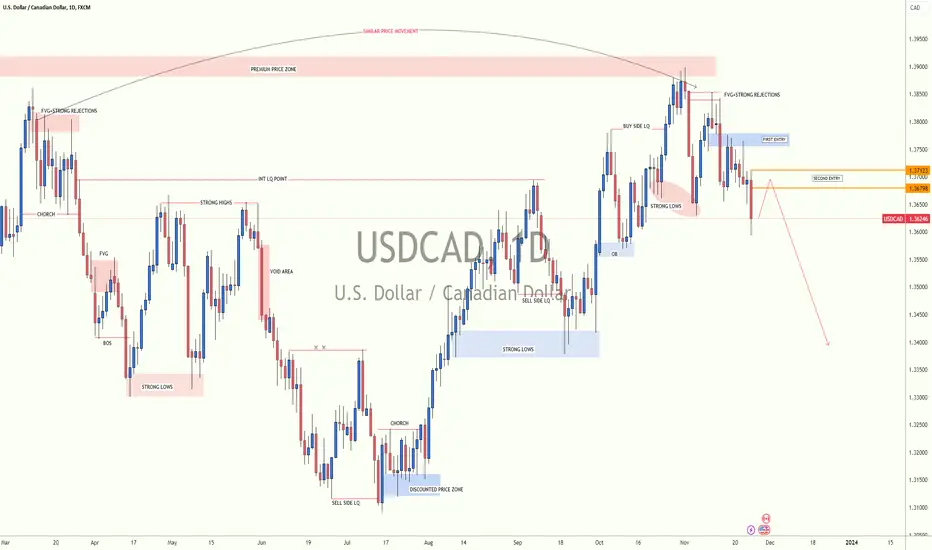
USDCAD: UPDATE 25/11/2023! Dear Traders,
Our last idea on USDCAD, was a successful one it rejected at our area and dropped 160 pip; with this setup we anticipating price to do a retracement before it drop further. With accurate stop loss and risk management we can successfully achieve our target on this idea.
what do you think of USDCAD?
USD/CAD Drop to 1.35000? This is An Optimal Short Setup!USD/CAD is forming a Head and Shoulders reversal pattern, potentially signaling the end of this bull channel. The price action has begun to stall and oscillate around the 1.37000 level and is now falling below the 200EMA. We are now faced with a reversal signal in a bull channel.
How do we trade this?
The probability of profit is greater longing in a bull channel because there are more bull bars than bear bars. We are faced with a potential reversal pattern, the head and shoulders, which negates our bias to long. Should we short?
If you're looking to swing trade, yes! Swing trading involves lower win rates because you're trading the reversal of a pattern. In other words, you bet against the trend, which means your probability of profit is low, but your reward is *much* higher as a result.
A decent short here would have been to enter around 1.38000. Since that price is behind us, I would short here and set a protective stop loss above the right shoulder at 1.38000, take profit with half your position just below the bull channel at 1.36000, and the rest just above the 200EMA at 1.35300. Once the first take profit is hit, move your stop up to the entry price or just above it to lock in profits.
Key Points
1. Bull Channel with a reversal pattern.
2. Potential Head and Shoulders Forming.
3. Gap down to 200EMA, reasonable profit target.
4. RSI has Room to Fall
You are solely responsible for your trades, trade at your own risk!
Let us know what you think in the comment section below!

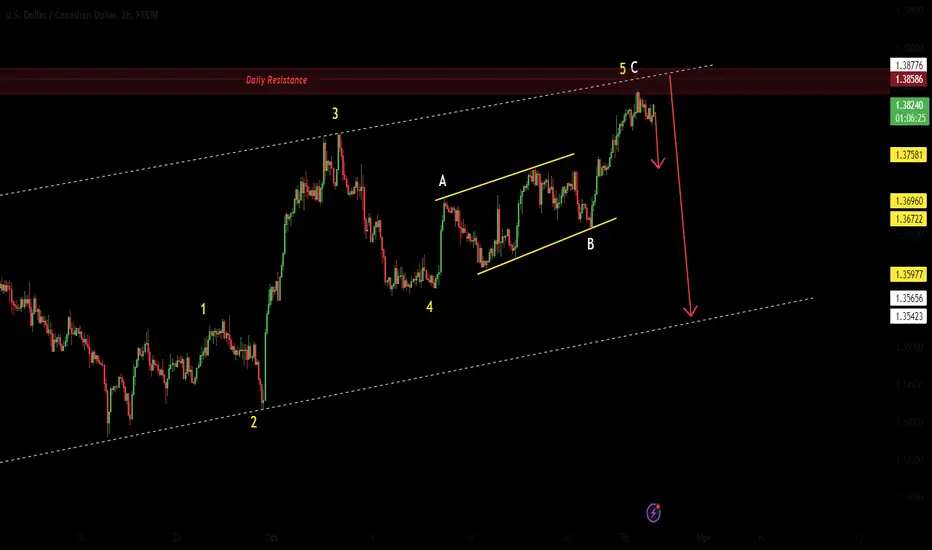
USDCADPair : USDCAD ( U.S Dollar / Canadian Dollar )
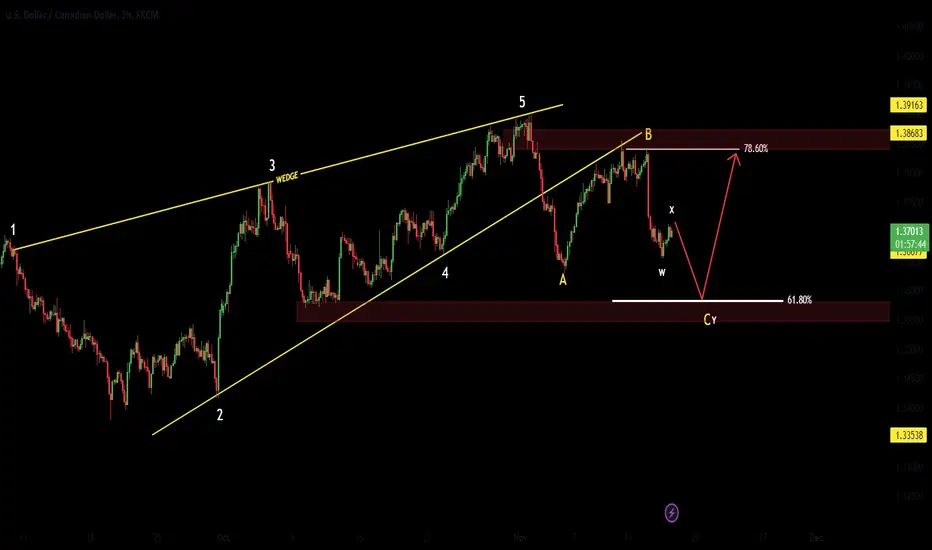
Description :
Rising Wedge as an Corrective Pattern in Short Time Frame with the Breakout of the Lower Trend Line and Completed the Retracement at Fibonacci Level - 78.60%. Completed Impulsive Waves " 12345 " and " AB " Corrective Wave
Entry Precautions :
Don't Enter Until it complete Correction
USDCAD → Moves below 1.3700 followed by 50-day EMAThe FX:USDCAD pair experiences downward pressure following the release of weaker US inflation data on Tuesday. Moreover, the uptick in crude oil prices is likely supporting the Canadian Dollar (CAD), adding to the pressure on the USD/CAD pair.
The technical indicators paint a bearish picture for the USD/CAD pair. The 14-day Relative Strength Index (RSI) below the 50 level indicates downward pressure, signaling a bearish momentum and reflecting a weaker market sentiment.
Additionally, the Moving Average Convergence Divergence (MACD) line, while above the centerline, has shown a divergence below the signal line. This suggests a potential shift in momentum towards a bearish sentiment in the USD/CAD pair.
The USD/CAD pair trades around 1.3690 during the early European session, after falling by almost 100 pips since the previous session. The 50-day Exponential Moving Average (EMA) at 1.3670 could act as the immediate support.
A firm break below the latter could influence the USD/CAD pair to navigate the region around the psychological level at 1.3600, followed by the 38.2% Fibonacci retracement at 1.3591 level.
On the upside, the major level at 1.3700 appears to be a key barrier. If there is a breakthrough above the latter, the bulls could revisit the weekly highs around the 1.3843 level.

USDCAD Sell/ShortPrevious USDCAD post was taken down for reasons. I did call a Sell/Short however is not visible to see no longer. My analysis was on point and we did short at the top. Please continue to follow the signal that is now posted for a great profitable session. Shows clear downtrend M formation and has a classic meltdown from here after a multi-pump day.
USDCAD
Sell/Short
Entry: 1.37887
Stop Loss: 1.38330
Targets:
TP: 1.36803
DAY TRADE/SWING TRADE
Risk: 2-5% of Capital

USDCAD : Short Trade , 1hHello traders, we want to check the USDCAD chart. The price has broken the ascending channel to the bottom and pulled back to the key level indicated. We expect this level to act as a resistance level and cause the price to fall. If the price cannot break this level and the price falls, we expect the price to fall to around 1.36500. Good luck.

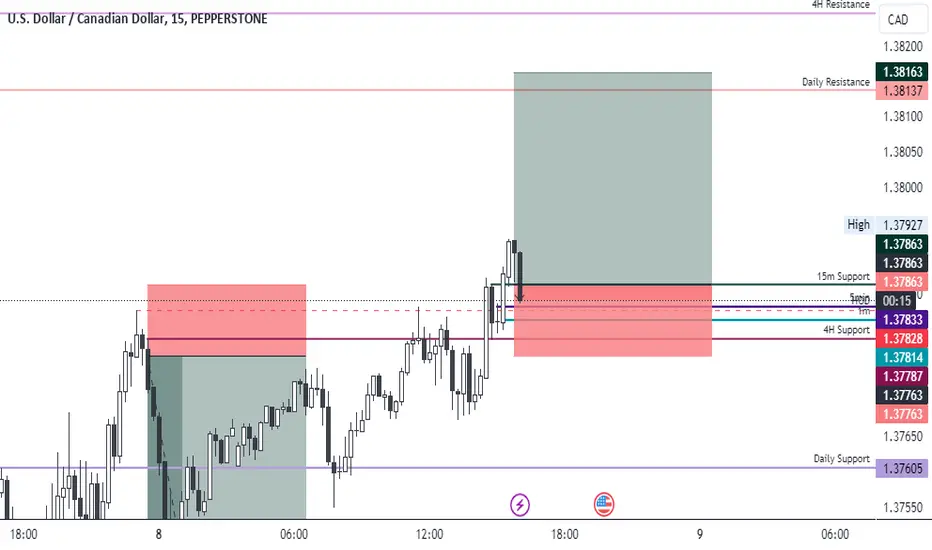
Long Opportunity for USD/CADUSD/CAD is currently in an uptrend, and the analysis suggests a promising opportunity for a long trade. The key area to watch is the zone between 1.37863 and 1.37787, where there's a potential for a retest.
If the price revisits this zone and demonstrates a clear bullish bias along with entry confirmation, it presents an attractive long trade opportunity. The target for this trade is set at 1.38137, which corresponds to a daily resistance level.
Keep a close eye on price action to identify the entry confirmation, and if conditions align, consider taking a long position to potentially reach the 1.38137 target.
It's important to exercise prudent risk management and remember that trading carries inherent risks. This idea is not financial advice, so conduct your own research, evaluate your risk tolerance, and consider seeking guidance from a professional financial advisor if necessary.
USDCAD SELL | Day Trading AnalysisHello Traders, here is the full analysis.
Watch strong action at the current levels for SELL. GOOD LUCK! Great SELL opportunity USDCAD
I still did my best and this is the most likely count for me at the moment.
Support the idea with like and follow my profile TO SEE MORE.
Traders, if you liked this idea or if you have your own opinion about it, write in the comments. I will be glad 🤝
Patience is the If You Have Any Question, Feel Free To Ask 🤗
Just follow chart with idea and analysis and when you are ready come in THE GROVE | VIP GROUP, earn more and safe, wait for the signal at the right moment and make money with us💰
USDCAD_SellAccording to my analysis,
Sell zone opportunity on H1.
Observe the money management (Use 1% of your balance )and the stop loss.
To notify the analysis, follow me and comments, and questions.

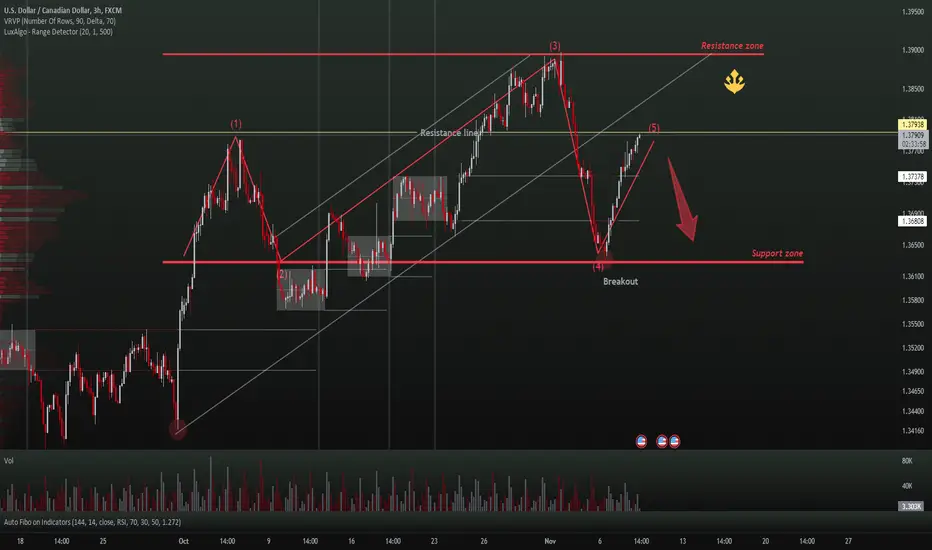
USDCAD 27/10 Pair : USDCAD ( U.S Dollar / Canadian Dollar )
Description :
Completed " 12345 " Impulsive Waves at Daily Resistance Level. Bullish Channel as an Corrective Pattern in Long Time Frame and Rejection from the Upper Trend Line. We have CHoCH and Divergence in RSI
Entry Precaution :
Wait for the Proper Rejection or Breakout
USDCAD SellI am sold it because on D1 time frame market made HH but the confirmation of sell I got on H4 time frame. Hope we will make handsome profit on it. This trade may be long term trade to hit TAKE PROFIT 3.

USDCAD Buyers Are Strong? {26/10/2022}Educational Analysis says USDCAD may go long according to my technical.
This is not an entry signal. I have no concerns with your profit and loss from this analysis.
Why long?
Broker FXCM.
After Ranging on the daily timeframe, A 4-hour time frame Made a Recent Upward Impulse Move that broke recent resistance and went for a new high,
Long setup after eating stop loss from Short Sellers,
Because USDCAD fair value gaps are unfilled in a 4-hour time frame.
The last Analysis is jointly connected in this updated one.
So, trade is already on with RR is 1: 22.01
I HAVE NO CONCERNS WITH YOUR PROFIT OR LOSS.
Happy Trading, Fxdollars.

USDCAD Top-down analysis Hello traders, this is a complete multiple timeframe analysis of this pair. We see could find significant trading opportunities as per analysis upon price action confirmation we may take this trade. Smash the like button if you find value in this analysis and drop a comment if you have any questions or let me know which pair to cover in my next analysis.

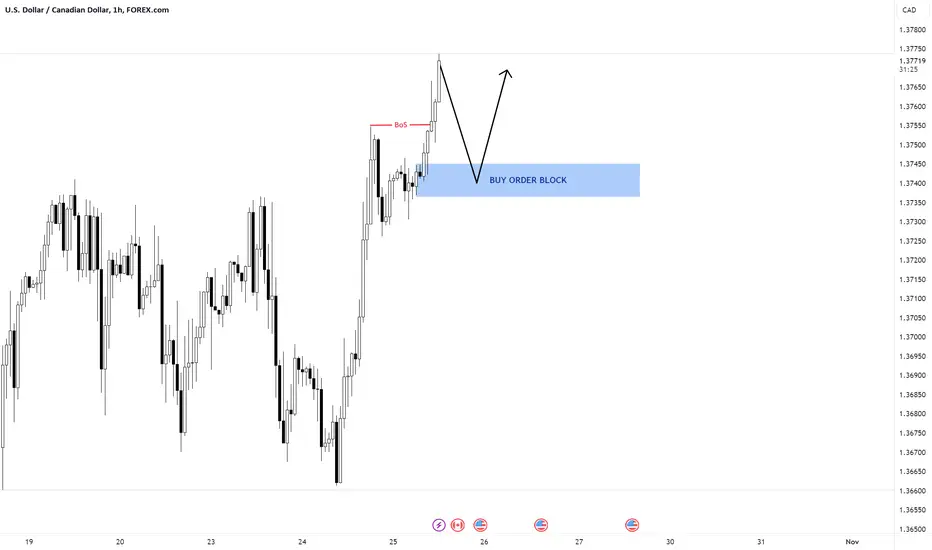
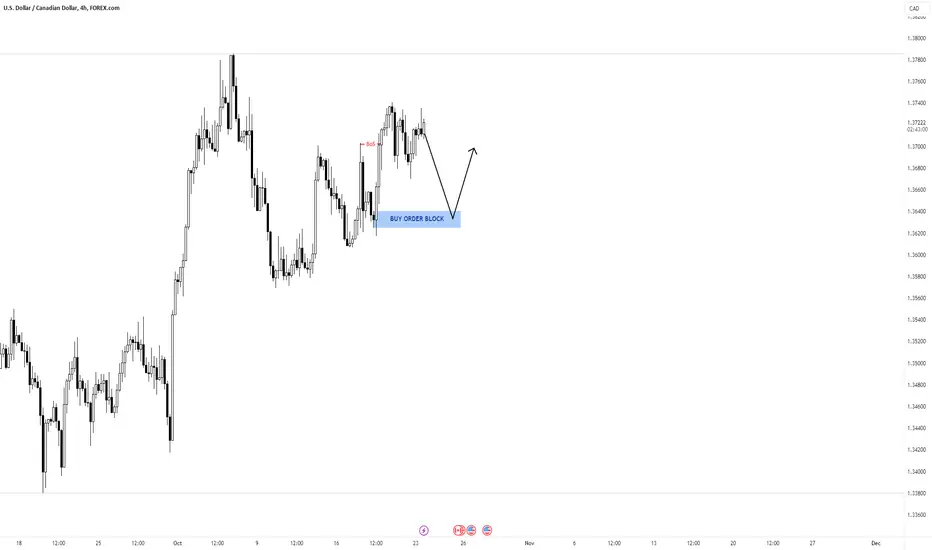
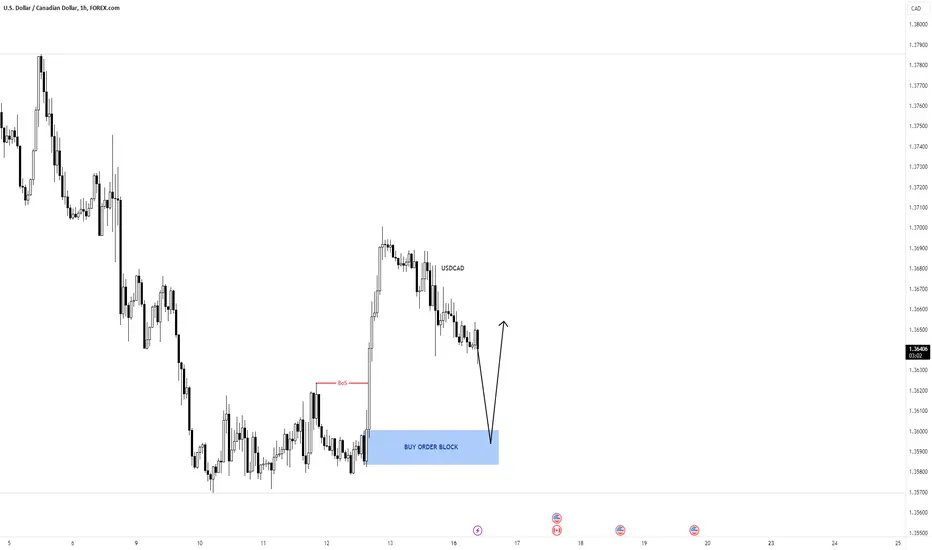
USDCAD Analysis H1Here is my analysis for USDCAD on H1 using Order Block. The price could go bullish, you can put a pending order on the Order block or find an entry on LTF within OB Zone. Trade Safe!
USDCAD Analysis H4Here is my analysis for USDCAD on H4 using Order Block. The price could go bullish, you can put a pending order on the Order block or find an entry on LTF within OB Zone. Trade Safe!
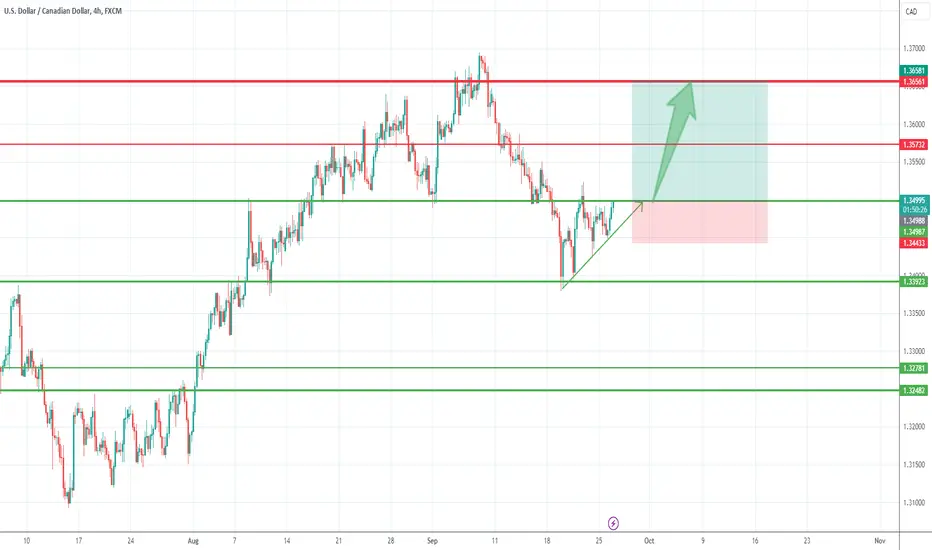
USDCAD LongThe price has recently attained support levels in both the 4-hour and 1-day timeframes. Based on this observation, it is expected that the price will appreciate towards specific areas in the coming period.

USDCAD Analysis H1Here is my analysis for USDCAD on H1 using Order Block. The price could go bullish, you can put a pending order on the Order block or find an entry on LTF within OB Zone. Trade Safe!
DeGRAM | USDCAD pullback tradeUSDCAD is currently trading in an ascending channel.
The market broke and closed above the consolidation zone.
Price pulled back to the kill zone: consolidation zone as support and fibo golden zone.
We anticipate a retest of the major resistance.
-------------------
Share your opinion in the comments and support the idea with a like. Thanks for your support!
USDCAD Detailed Analysis I 100 + Pip Move! Welcome back! Let me know your thoughts in the comments!
** USDCAD Analysis - Listen to video!
We recommend that you keep this pair on your watchlist and enter when the entry criteria of your strategy is met.
Please support this idea with a LIKE and COMMENT if you find it useful and Click "Follow" on our profile if you'd like these trade ideas delivered straight to your email in the future.
Thanks for your continued support!

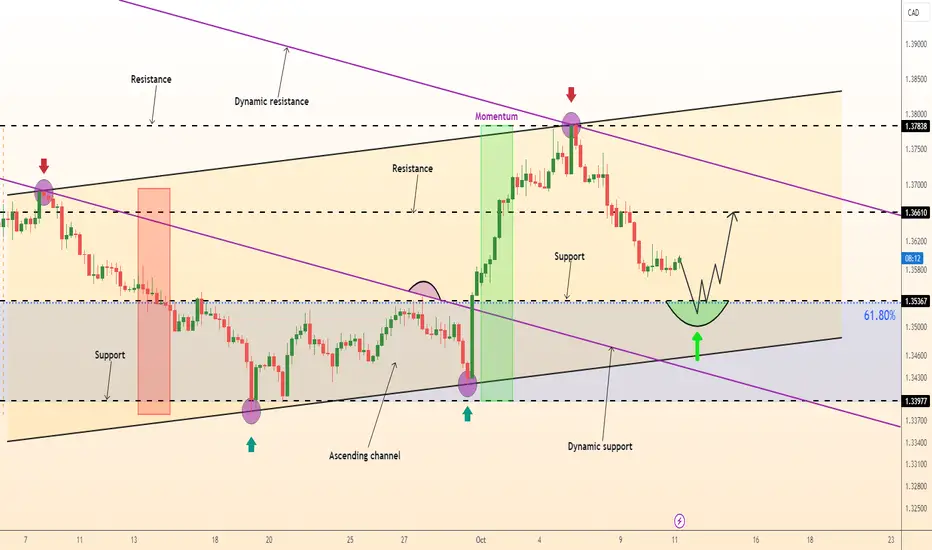
UsdCad- Constructive price action after 1.34 testRecently, UsdCad dropped under 1.35 support just to test the next important support from 1.34.
Since that low on 20 September, the pair started to rise again and now is trading back at the old support now resistance and important 1.35 figure.
The rise is painting an ascending triangle on our chart and this usually means up continuation.
A break above resistance would bring confirmation and the pair could rise back to test the 1.3650 zone.
A drop under 1.3450 would put the pair in a range trading mood.
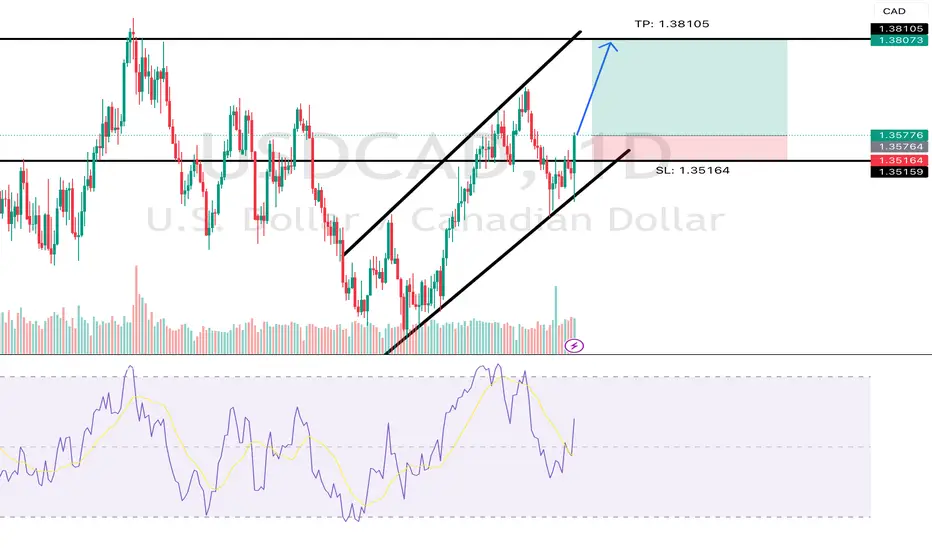
USDCAD Buy/LongUSDCAD
BUY/LONG
Entry: 1.35776
Stop Loss: 1.35164
Target:
TP: 1.38105
SWING TRADE
Risk: 2-5% of Capital
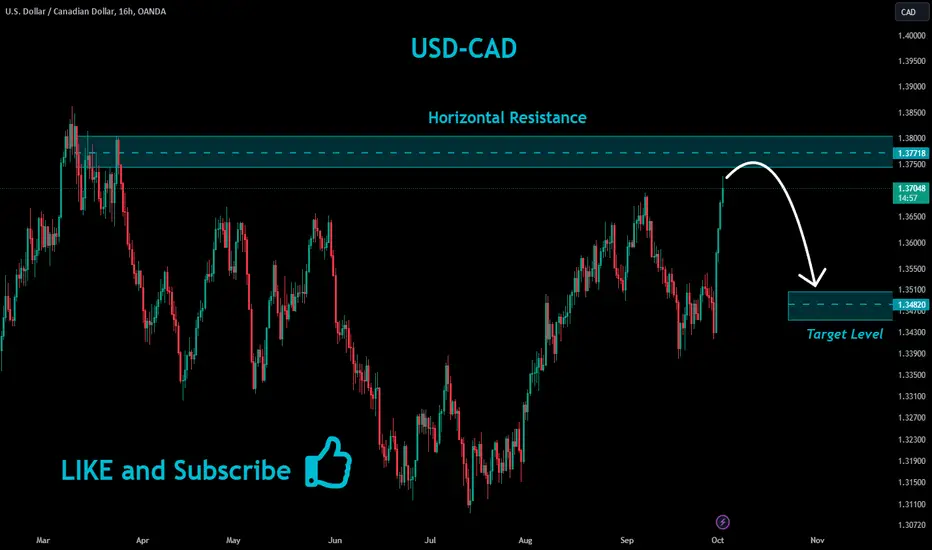
USDCAD Swing Short! USD-CAD was trading in
A strong uptrend but now
The pair has hit a horizontal
Resistance level of 1.37718
From where I will be expecting
A bearish correction !