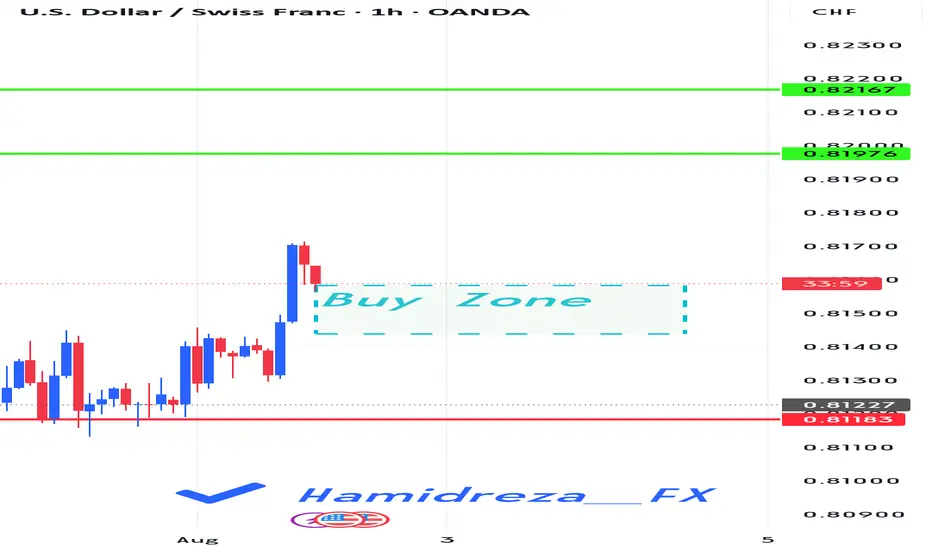
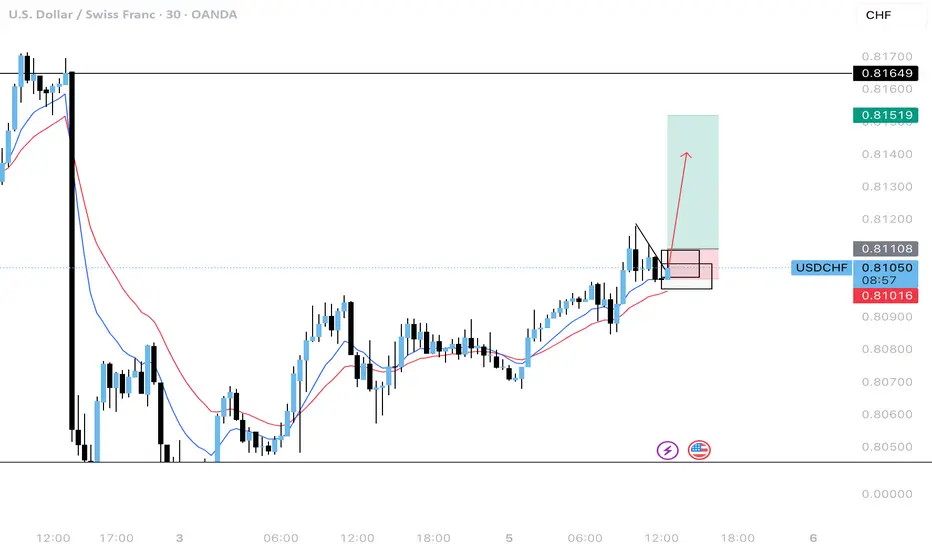
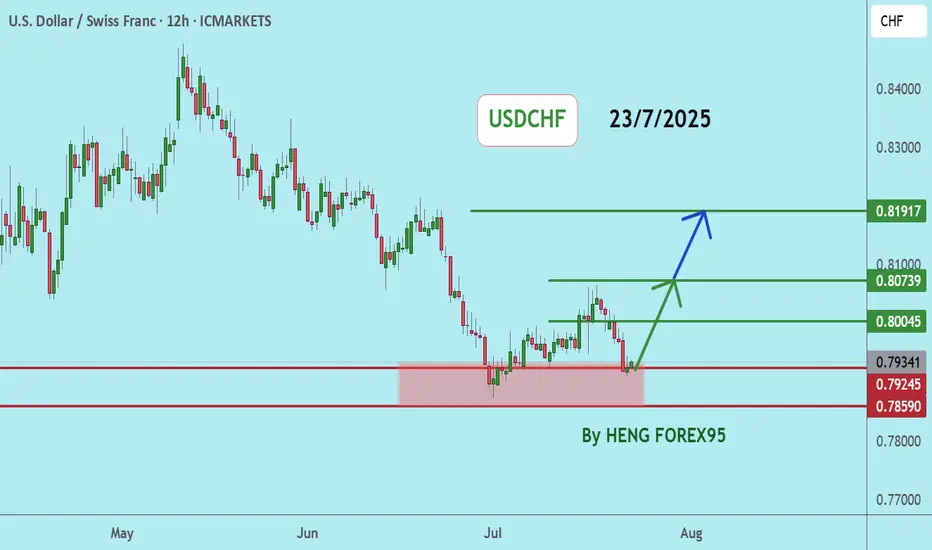
Is USDCHF correction over?✏️USDCHF in the medium term is still in an uptrend. After a retest wave of Fibonacci 0.5 some buying pressure was present in the European session today with the confirmation of the H4 candle Full bullish force. The reaction at Fibonacci is also the support zone for break out in the past. This is considered an important point in the structure of the bullish wave. The BUY point is triggered with the expectation that USDCHF will break the peak of last week and head towards higher levels.
📉 Key Levels
BUY now 0.80800 (confirmation of candle at the support zone)
BUY DCA trigger Break the peak 0.816
Target 0.830
Leave your comments on the idea. I am happy to read your views.
Usdchf!
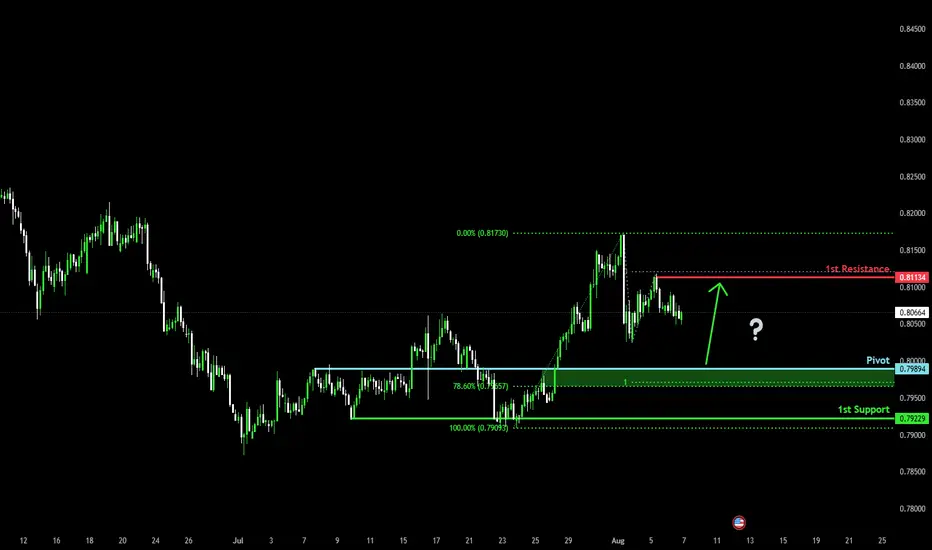
Bullish bounce off?The Swissie (USD/CHF) is falling towards the pivot and could bounce to the 1st resistance which acts as a pullback resistance.
Pivot: 0.7989
1st Support: 0.7922
1st Resistance: 0.8113
Risk Warning:
Trading Forex and CFDs carries a high level of risk to your capital and you should only trade with money you can afford to lose. Trading Forex and CFDs may not be suitable for all investors, so please ensure that you fully understand the risks involved and seek independent advice if necessary.
Disclaimer:
The above opinions given constitute general market commentary, and do not constitute the opinion or advice of IC Markets or any form of personal or investment advice.
Any opinions, news, research, analyses, prices, other information, or links to third-party sites contained on this website are provided on an "as-is" basis, are intended only to be informative, is not an advice nor a recommendation, nor research, or a record of our trading prices, or an offer of, or solicitation for a transaction in any financial instrument and thus should not be treated as such. The information provided does not involve any specific investment objectives, financial situation and needs of any specific person who may receive it. Please be aware, that past performance is not a reliable indicator of future performance and/or results. Past Performance or Forward-looking scenarios based upon the reasonable beliefs of the third-party provider are not a guarantee of future performance. Actual results may differ materially from those anticipated in forward-looking or past performance statements. IC Markets makes no representation or warranty and assumes no liability as to the accuracy or completeness of the information provided, nor any loss arising from any investment based on a recommendation, forecast or any information supplied by any third-party.
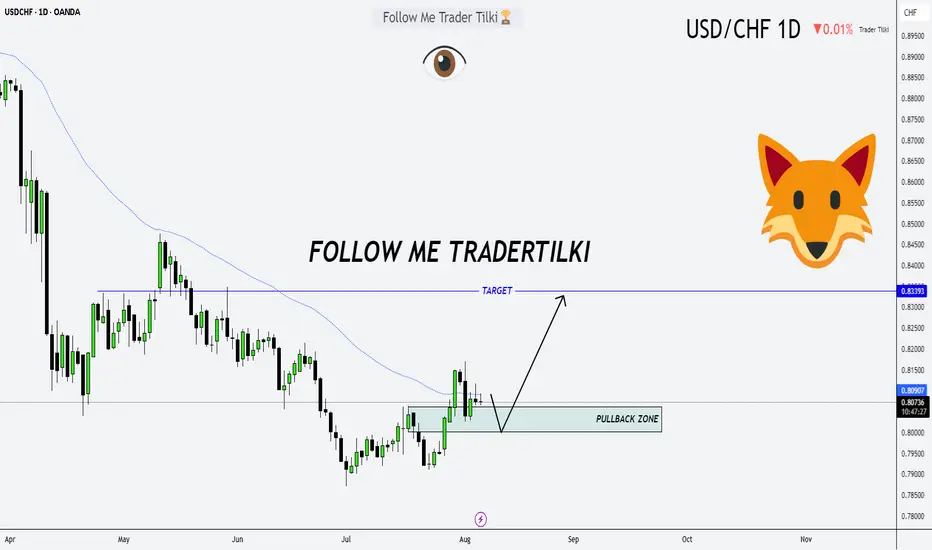
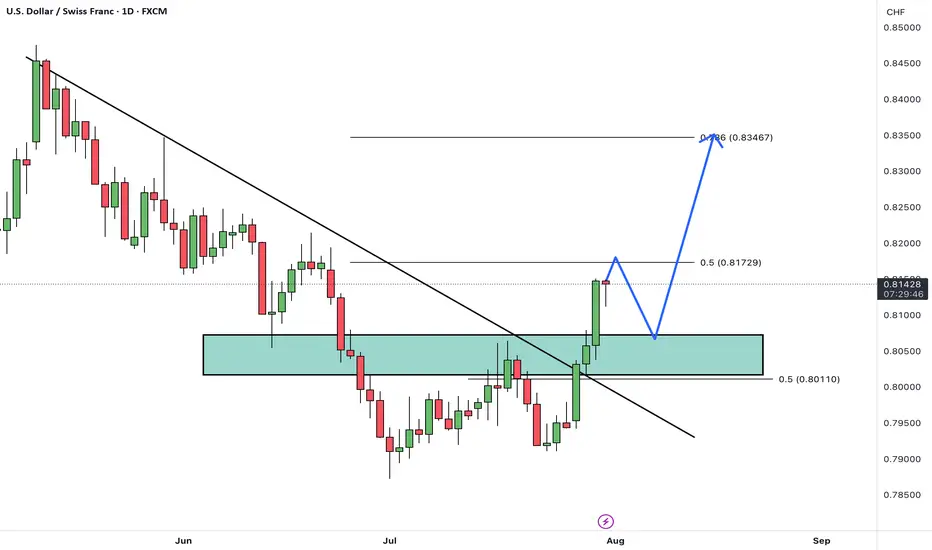
Target Locked: USDCHF Buy Trade with High ConvictionHey Guys,
I'm planning a buy trade on USDCHF from the pullback zone between 0.80028 and 0.80625. My target level is 0.83390.
I'm quite optimistic about this setup. But remember—forex markets do what they want; we simply make educated guesses.
That’s why risk management is key. Protect your capital.
And one more thing: every single like from you is my biggest motivation to keep sharing analysis. Huge thanks to everyone supporting me!
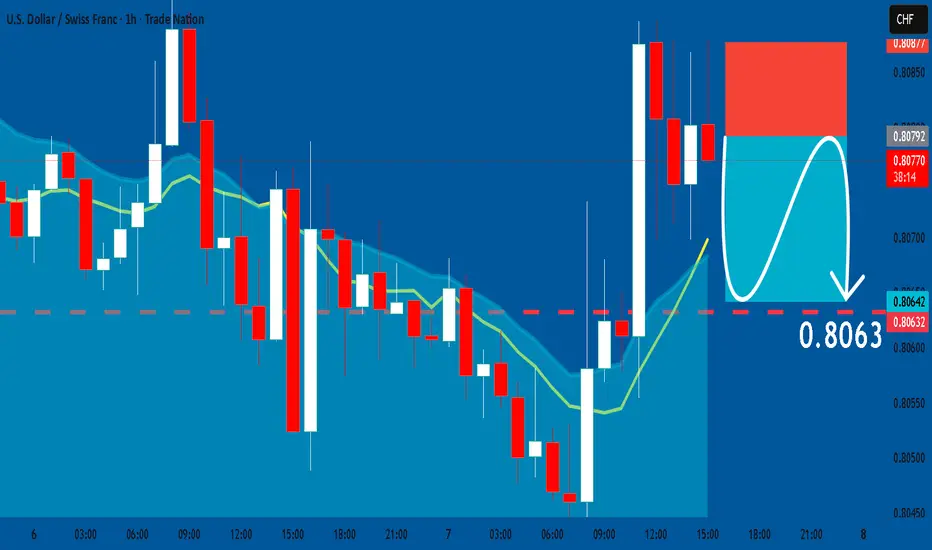
USDCHF: Short Trade Explained
USDCHF
- Classic bearish formation
- Our team expects fall
SUGGESTED TRADE:
Swing Trade
Sell USDCHF
Entry Level - 0.8079
Sl - 0.8087
Tp - 0.8063
Our Risk - 1%
Start protection of your profits from lower levels
Disclosure: I am part of Trade Nation's Influencer program and receive a monthly fee for using their TradingView charts in my analysis.
❤️ Please, support our work with like & comment! ❤️
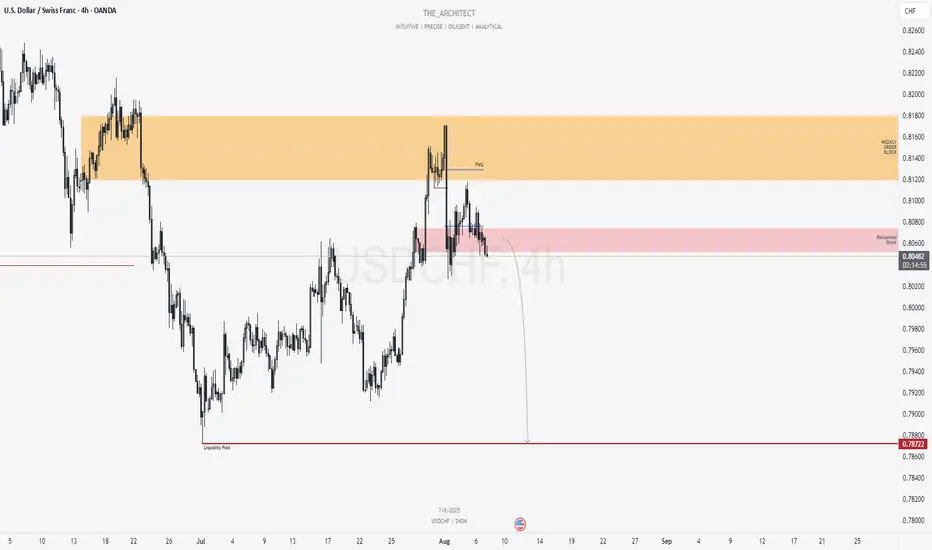
USDCHF: Bearish Continuation Setup From Reclaimed Supply ZoneGreetings Traders,
In today’s analysis of USDCHF, recent price action confirms the presence of bearish institutional order flow. This reinforces our directional bias to the downside, prompting us to focus on strategic selling opportunities.
Key Observations on H4:
Weekly Bearish Order Block: Price recently tapped into a weekly bearish order block, which triggered a decisive market structure shift to the downside. This confirms the order block's validity as a firm resistance zone.
Bearish Fair Value Gap (FVG): Following the market structure shift, price retraced into an H4 FVG. This zone acted as resistance, maintaining bearish momentum.
Reclaimed Mitigation Block: After breaking through a previous mitigation block, the area now functions as a reclaimed order block. We expect this to serve as a high-probability resistance zone moving forward.
Trading Plan:
Entry Strategy: Monitor lower timeframes (M15 and below) for confirmation entries within the reclaimed order block.
Target Objective: The current draw on liquidity is the discount-side liquidity pools, which aligns with our bearish bias.
As always, remain patient, wait for solid confirmations, and manage your risk with precision.
Kind regards,
The Architect 🏛️📉
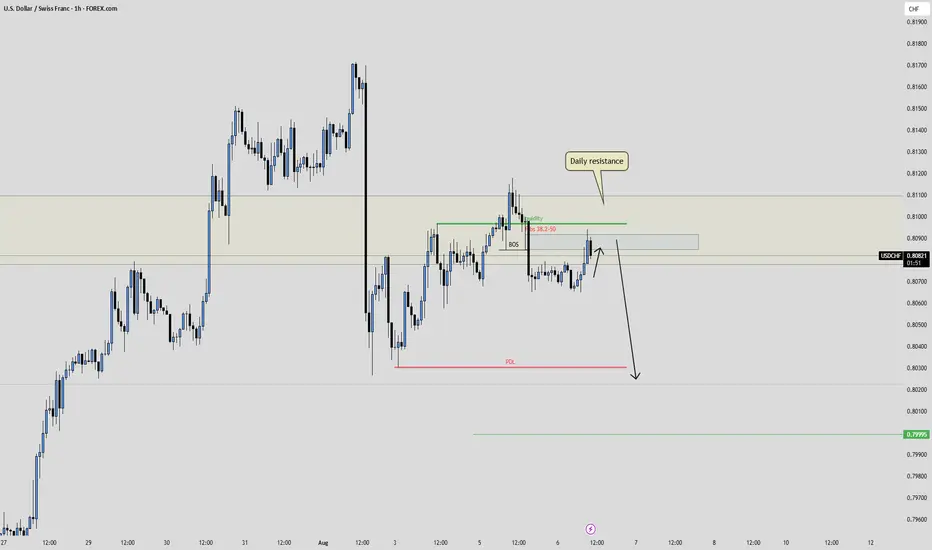
USDCHF: Liquidity Trap Inside Daily ResistanceStep 1: Liquidity Sweep
Price aggressively swept the previous day's high, clearing buy-side liquidity.
Step 2: Break of Structure
Right after the sweep, we got a strong break of structure, confirming a bearish shift.
Step 3: Retracement into Imbalance
Price is now retracing into an unfilled imbalance left behind by the bearish impulse. This area becomes even more significant given the next point.
Step 4: Daily Resistance Confluence
This retracement is unfolding right at a key Daily resistance zone, adding strong higher-timeframe confluence. The likelihood of a reversal from this level increases sharply.
Step 5: Candle Confirmation
I’ll wait for clear signs of seller strength such as wick rejections, engulfing candles, or momentum shift before entering short. No confirmation, no trade.
🔔 Trade Plan
Bias: Short
Entry: Upon confirmation inside the imbalance
Invalidation: Break above the liquidity sweep high
TP: Lower liquidity pool
USD Set To bounce? EUR/USD, USD/JPY, USD/CHFIt has been a week since the US dollar plunged following a weak NFP report. Given it has consolidated within a tight range near last week's low, alongside price action clues on EUR/USD, USD/JPY and USD/CHF, I suspect the dollar could bounce before its losses resume.
Matt Simpson, Market Analyst at City Index and Forex.com

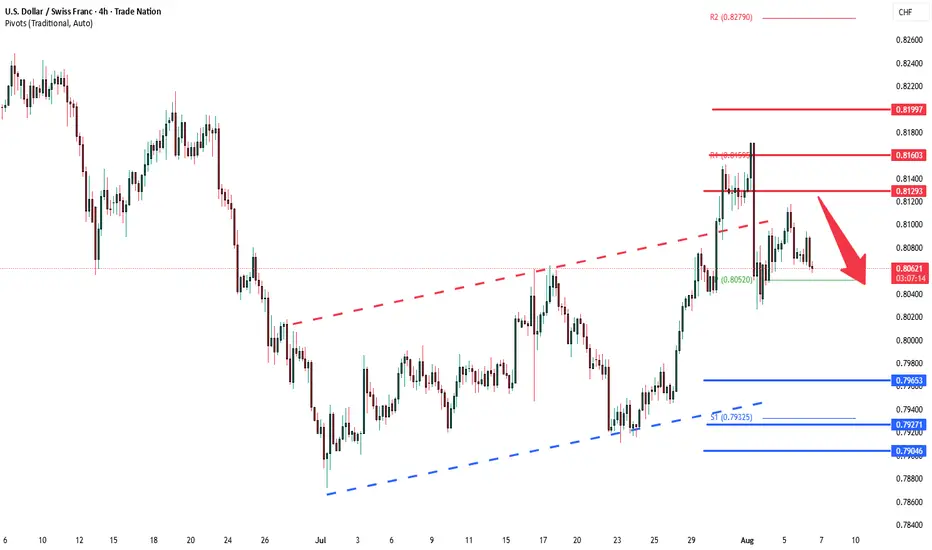
USDCHF resistance at 0.8130The USD/CHF pair is currently trading with a bearish bias, aligned with the broader downward trend. Recent price action shows a retest of the falling resistance, suggesting a temporary relief rally within the downtrend.
Key resistance is located at 0.8130, a prior consolidation zone. This level will be critical in determining the next directional move.
A bearish rejection from 0.8130 could confirm the resumption of the downtrend, targeting the next support levels at 0.7970, followed by 0.7930 and 0.7900 over a longer timeframe.
Conversely, a decisive breakout and daily close above 0.8130 would invalidate the current bearish setup, shifting sentiment to bullish and potentially triggering a move towards 0.8160, then 0.8200.
Conclusion:
The short-term outlook remains bearish unless the pair breaks and holds above 0.8045. Traders should watch for price action signals around this key level to confirm direction. A rejection favours fresh downside continuation, while a breakout signals a potential trend reversal or deeper correction.
This communication is for informational purposes only and should not be viewed as any form of recommendation as to a particular course of action or as investment advice. It is not intended as an offer or solicitation for the purchase or sale of any financial instrument or as an official confirmation of any transaction. Opinions, estimates and assumptions expressed herein are made as of the date of this communication and are subject to change without notice. This communication has been prepared based upon information, including market prices, data and other information, believed to be reliable; however, Trade Nation does not warrant its completeness or accuracy. All market prices and market data contained in or attached to this communication are indicative and subject to change without notice.
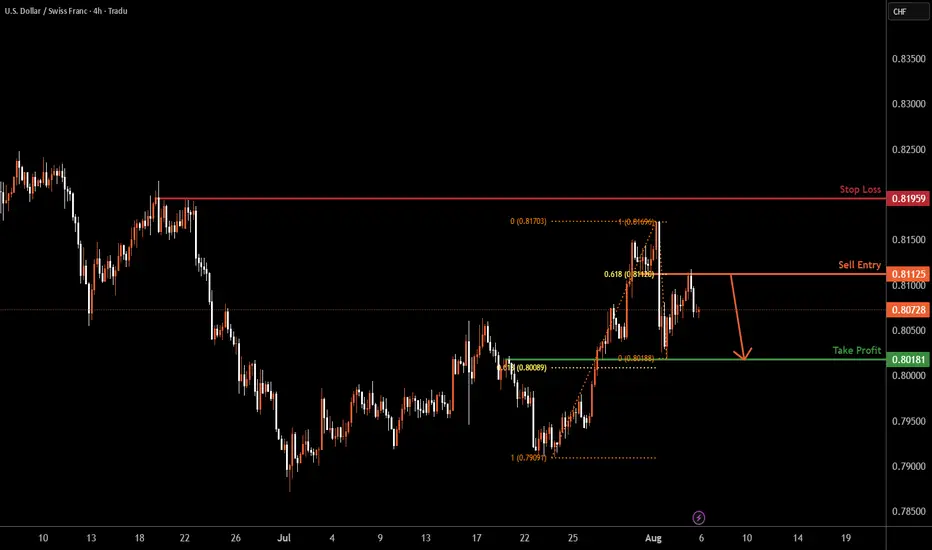
USDCHF H4 | Bearish dropUSD/CHF has rejected off the sell entry which is a pullback resistance that lines up with the 61.8% Fibonacci retracement and could potentially drop from this level to the take profit.
Sell entry is at 0.8112, which is a pullback resistance that lines up with the 61.8% Fibonacci retracement.
Stop loss is at 0.8195, which is a swing high resistance.
Take profit is at 0.8018, which is a pullback support that is slightly above the 61.8% Fibonacci retracement.
High Risk Investment Warning
Trading Forex/CFDs on margin carries a high level of risk and may not be suitable for all investors. Leverage can work against you.
Stratos Markets Limited (tradu.com ):
CFDs are complex instruments and come with a high risk of losing money rapidly due to leverage. 65% of retail investor accounts lose money when trading CFDs with this provider. You should consider whether you understand how CFDs work and whether you can afford to take the high risk of losing your money.
Stratos Europe Ltd (tradu.com ):
CFDs are complex instruments and come with a high risk of losing money rapidly due to leverage. 66% of retail investor accounts lose money when trading CFDs with this provider. You should consider whether you understand how CFDs work and whether you can afford to take the high risk of losing your money.
Stratos Global LLC (tradu.com ):
Losses can exceed deposits.
Please be advised that the information presented on TradingView is provided to Tradu (‘Company’, ‘we’) by a third-party provider (‘TFA Global Pte Ltd’). Please be reminded that you are solely responsible for the trading decisions on your account. There is a very high degree of risk involved in trading. Any information and/or content is intended entirely for research, educational and informational purposes only and does not constitute investment or consultation advice or investment strategy. The information is not tailored to the investment needs of any specific person and therefore does not involve a consideration of any of the investment objectives, financial situation or needs of any viewer that may receive it. Kindly also note that past performance is not a reliable indicator of future results. Actual results may differ materially from those anticipated in forward-looking or past performance statements. We assume no liability as to the accuracy or completeness of any of the information and/or content provided herein and the Company cannot be held responsible for any omission, mistake nor for any loss or damage including without limitation to any loss of profit which may arise from reliance on any information supplied by TFA Global Pte Ltd.
The speaker(s) is neither an employee, agent nor representative of Tradu and is therefore acting independently. The opinions given are their own, constitute general market commentary, and do not constitute the opinion or advice of Tradu or any form of personal or investment advice. Tradu neither endorses nor guarantees offerings of third-party speakers, nor is Tradu responsible for the content, veracity or opinions of third-party speakers, presenters or participants.
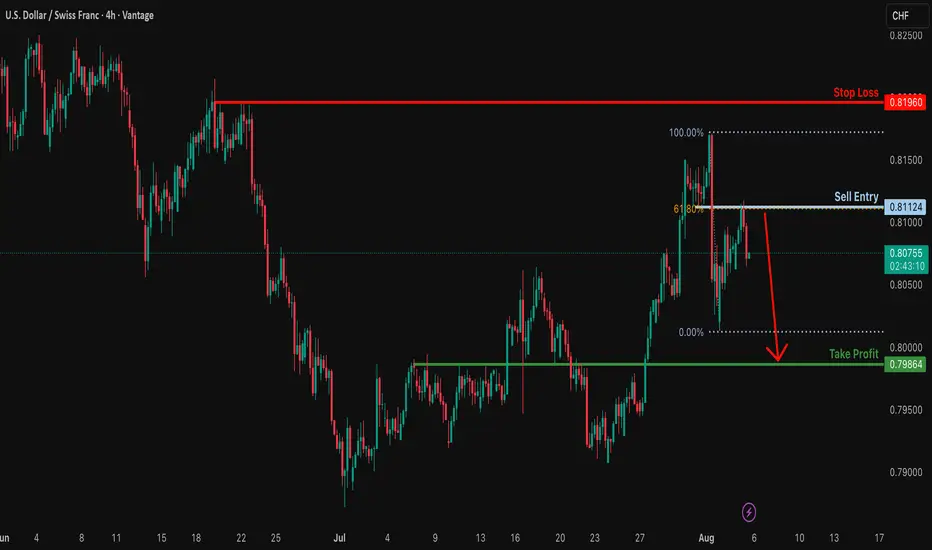
Potential bearish drop?USD/CHF has rejected off the resistance level which is a pullback resistance that lines up with the 61.8% Fibonacci retracement and could drop from this level to our take profit.
Entry: 0.8112
Why we like it:
There is a pullback resistance that lines up with the 61.8% Fibonacci retracement.
Stop loss: 0.8196
Why we like it:
There is a swing high resistance.
Take profit: 0.7986
Why we like it:
There is a pullback support.
Enjoying your TradingView experience? Review us!
Please be advised that the information presented on TradingView is provided to Vantage (‘Vantage Global Limited’, ‘we’) by a third-party provider (‘Everest Fortune Group’). Please be reminded that you are solely responsible for the trading decisions on your account. There is a very high degree of risk involved in trading. Any information and/or content is intended entirely for research, educational and informational purposes only and does not constitute investment or consultation advice or investment strategy. The information is not tailored to the investment needs of any specific person and therefore does not involve a consideration of any of the investment objectives, financial situation or needs of any viewer that may receive it. Kindly also note that past performance is not a reliable indicator of future results. Actual results may differ materially from those anticipated in forward-looking or past performance statements. We assume no liability as to the accuracy or completeness of any of the information and/or content provided herein and the Company cannot be held responsible for any omission, mistake nor for any loss or damage including without limitation to any loss of profit which may arise from reliance on any information supplied by Everest Fortune Group.
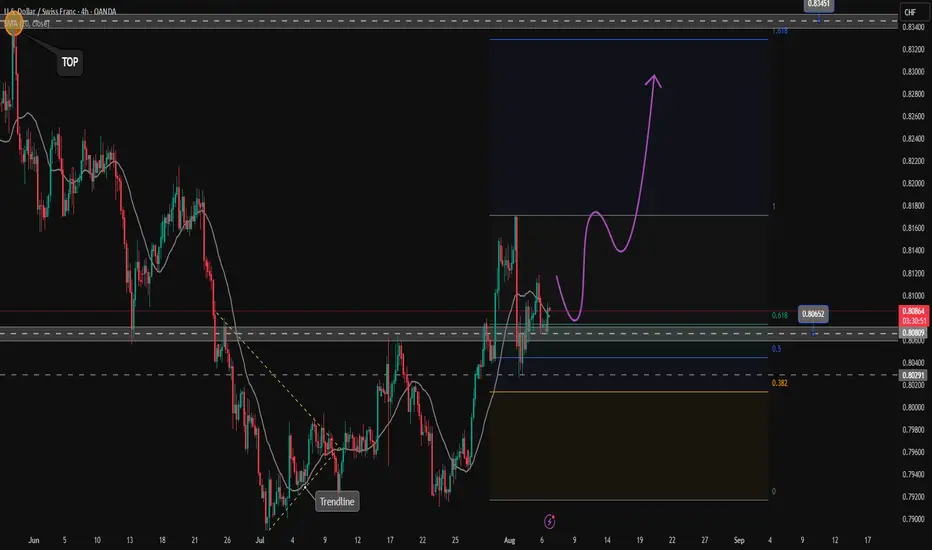
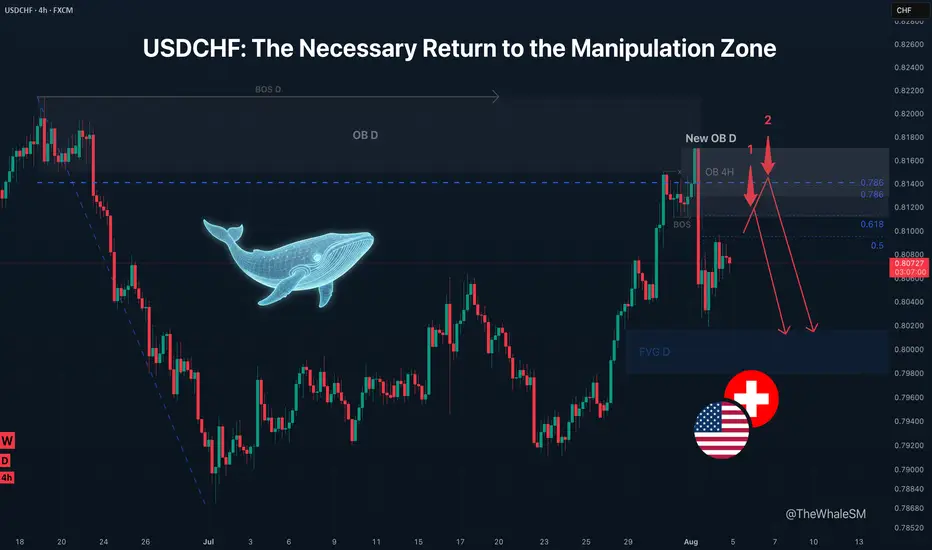
USDCHF: The Necessary Return to the Manipulation ZoneIn the market, some zones act like magnets, pulling the price back to them. After a powerful move down, USDCHF has left behind a critical manipulation zone—a place where large capital needs to return to close their books before the real trend continues. This analysis is about waiting patiently at that exact spot.
The USDCHF pair continues to be in a global downtrend . After another powerful impulse down on the higher timeframe, the instrument corrected to the 78.6% Fibonacci level of the daily structure. This level, in conjunction with a daily order block, acted as strong resistance and pushed the price down, breaking the 4H corrective structure (BOS).
The interaction with the 78.6% level was accompanied by a manipulation in the form of a new daily order block , with a 4H order block residing inside it. If large capital intends to continue the downtrend, they will first need to close the losing long positions used to conduct the Buy-to-Sell (BTS) manipulation . This makes it a strong Point of Interest (POI) and a magnet for the price.
An additional argument for a short setup forming in this POI is that an untouched daily FVG remains slightly below. The mitigation of this FVG will be the minimum target if a setup is confirmed according to one of the two scenarios, provided the price reaches the POI before this rebalancing occurs.
Two Potential Short Scenarios
SCENARIO 1: Entry from the 61.8% Local Fib
This scenario involves the mitigation of the lower boundary of the daily order block in conjunction with reaching the 61.8% level of the local correction , and a reversal reaction from this confluence.
SCENARIO 2: Entry from the 78.6% Local Fib
If the 61.8% local level is broken, the second scenario comes into play, with the mitigation of the 4H order block in conjunction with the 78.6% level of the local correction , and a reversal reaction from there.
► Invalidation: A break of this level with the price finding acceptance above it would invalidate the short idea from this POI. In that case, the correction on the higher timeframe would continue higher, aiming to capture additional liquidity, at least from the June 19th high, which is also the daily structure's break level.
~~~~~~~~~~~~~~~~~~~~~~~~~~~~~~~~~~~~~~~~~~~~~~~~~~~~~~~~~~~~~~~~~
The principles and conditions for forming the manipulation zones I show in this trade idea are detailed in my educational publication, which was chosen by TradingView for the "Editor's Picks" category and received a huge amount of positive feedback from this insightful trading community. To better understand the logic I've used here and the general principles of price movement in most markets from the perspective of institutional capital, I highly recommend checking out this guide if you haven't already. 👇
P.S. This is not a prediction of the exact price direction. It is a description of high-probability setups that become valid only if specific conditions are met when the price reaches the marked POI. If the conditions are not met, the setups are invalid. No setup has a 100% success rate, so if you decide to use this trade idea, always apply a stop-loss and proper risk management. Trade smart.
~~~~~~~~~~~~~~~~~~~~~~~~~~~~~~~~~~~~~~~~~~~~~~~~~~~~~~~~~~~~~~~~~
If you found this analysis helpful, support it with a Boost! 🚀
Have a question or your own view on this idea? Share it in the comments. 💬
► Follow me on TradingView to get real-time updates on THIS idea (entry, targets & live trade management) and not to miss my next detailed breakdown.
~~~~~~~~~~~~~~~~~~~~~~~~~~~~~~~~~~~~~~~~~~~~~~~~~~~~~~~~~~~~~~~~~
USDCHF 5 MIN TIMEFRAME BUY POTENTIALImpulse correction impulse trading. 4hr 10 and 20 EMA on uptrend, 30 min timeframe hitting off the emas. Currently on correction on 5 minute timeframe waiting for price to fill imbalance before breaking up. 1:4RR trade!
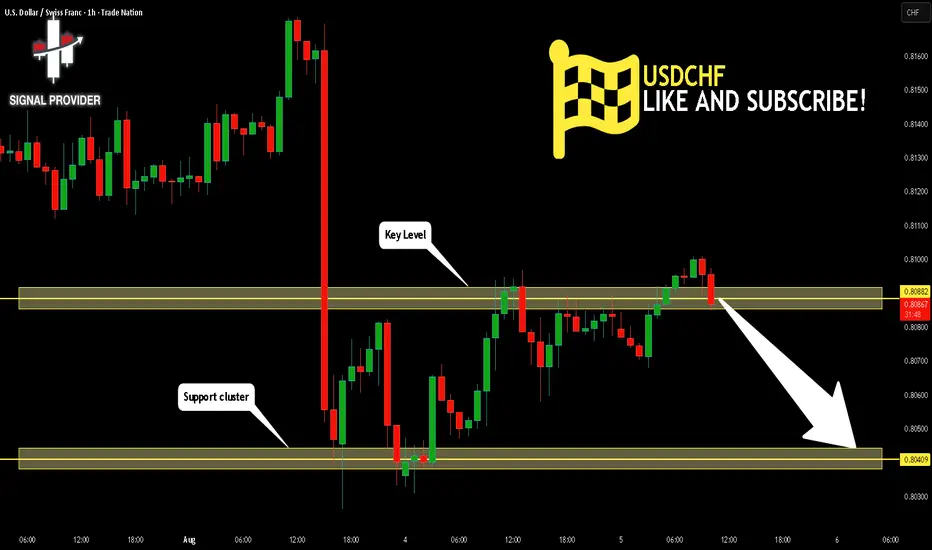
USDCHF Is Very Bearish! Short!
Take a look at our analysis for USDCHF.
Time Frame: 1h
Current Trend: Bearish
Sentiment: Overbought (based on 7-period RSI)
Forecast: Bearish
The price is testing a key resistance 0.808.
Taking into consideration the current market trend & overbought RSI, chances will be high to see a bearish movement to the downside at least to 0.804 level.
P.S
Overbought describes a period of time where there has been a significant and consistent upward move in price over a period of time without much pullback.
Disclosure: I am part of Trade Nation's Influencer program and receive a monthly fee for using their TradingView charts in my analysis.
Like and subscribe and comment my ideas if you enjoy them!
USDCHF – Bullish comeback in progress?Hey everyone! What’s your take on the current trend of USDCHF?
While the pair experienced a recent dip, take a step back and look at the bigger picture — doesn’t it still seem to be moving within an ascending channel?
Right now, USDCHF is hovering around 0.8092 and starting to bounce back. The recovery appears to be supported by a newly formed support zone and the confluence of the EMA 34 and 89. The pair seems to be eyeing the recent high, with potential to climb further toward the upper boundary of the channel.
My current bias? Bullish.
What about you — do you see the same opportunity?
Drop a comment and hit like if you’re on the same page!

USDCHF false breakout, price range capped by 0.8130The USD/CHF pair is currently trading with a bearish bias, aligned with the broader downward trend. Recent price action shows a retest of the falling resistance, suggesting a temporary relief rally within the downtrend.
Key resistance is located at 0.8130, a prior consolidation zone. This level will be critical in determining the next directional move.
A bearish rejection from 0.8130 could confirm the resumption of the downtrend, targeting the next support levels at 0.7970, followed by 0.7930 and 0.7900 over a longer timeframe.
Conversely, a decisive breakout and daily close above 0.8130 would invalidate the current bearish setup, shifting sentiment to bullish and potentially triggering a move towards 0.8160, then 0.8200.
Conclusion:
The short-term outlook remains bearish unless the pair breaks and holds above 0.8045. Traders should watch for price action signals around this key level to confirm direction. A rejection favours fresh downside continuation, while a breakout signals a potential trend reversal or deeper correction.
This communication is for informational purposes only and should not be viewed as any form of recommendation as to a particular course of action or as investment advice. It is not intended as an offer or solicitation for the purchase or sale of any financial instrument or as an official confirmation of any transaction. Opinions, estimates and assumptions expressed herein are made as of the date of this communication and are subject to change without notice. This communication has been prepared based upon information, including market prices, data and other information, believed to be reliable; however, Trade Nation does not warrant its completeness or accuracy. All market prices and market data contained in or attached to this communication are indicative and subject to change without notice.

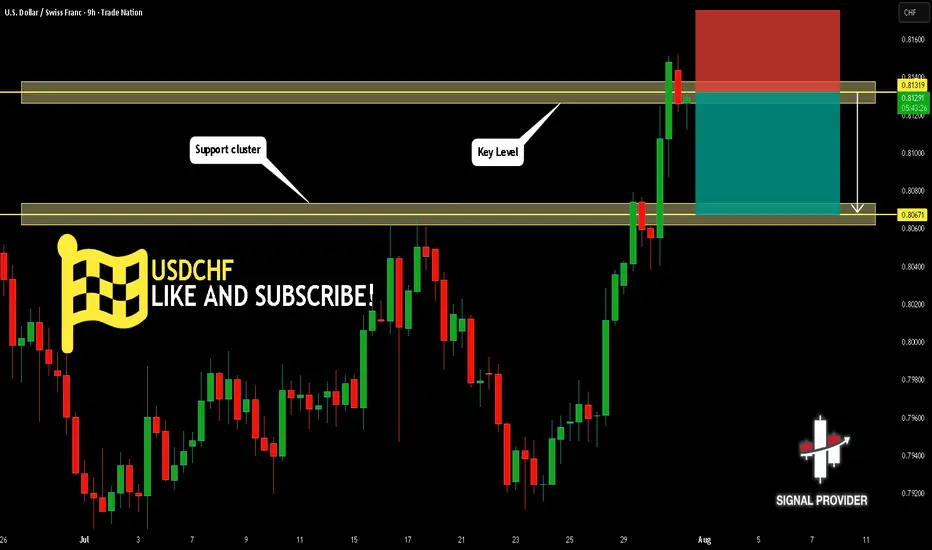
USDCHF Will Go Down From Resistance! Short!
Take a look at our analysis for USDCHF.
Time Frame: 9h
Current Trend: Bearish
Sentiment: Overbought (based on 7-period RSI)
Forecast: Bearish
The market is approaching a key horizontal level 0.813.
Considering the today's price action, probabilities will be high to see a movement to 0.806.
P.S
We determine oversold/overbought condition with RSI indicator.
When it drops below 30 - the market is considered to be oversold.
When it bounces above 70 - the market is considered to be overbought.
Disclosure: I am part of Trade Nation's Influencer program and receive a monthly fee for using their TradingView charts in my analysis.
Like and subscribe and comment my ideas if you enjoy them!
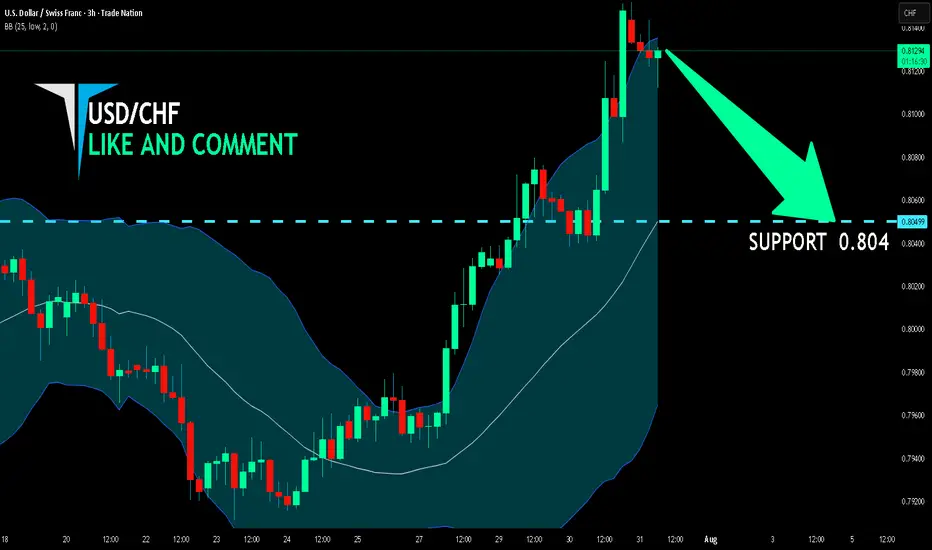
USD/CHF BEARS WILL DOMINATE THE MARKET|SHORT
Hello, Friends!
Bearish trend on USD/CHF, defined by the red colour of the last week candle combined with the fact the pair is overbought based on the BB upper band proximity, makes me expect a bearish rebound from the resistance line above and a retest of the local target below at 0.804.
Disclosure: I am part of Trade Nation's Influencer program and receive a monthly fee for using their TradingView charts in my analysis.
✅LIKE AND COMMENT MY IDEAS✅
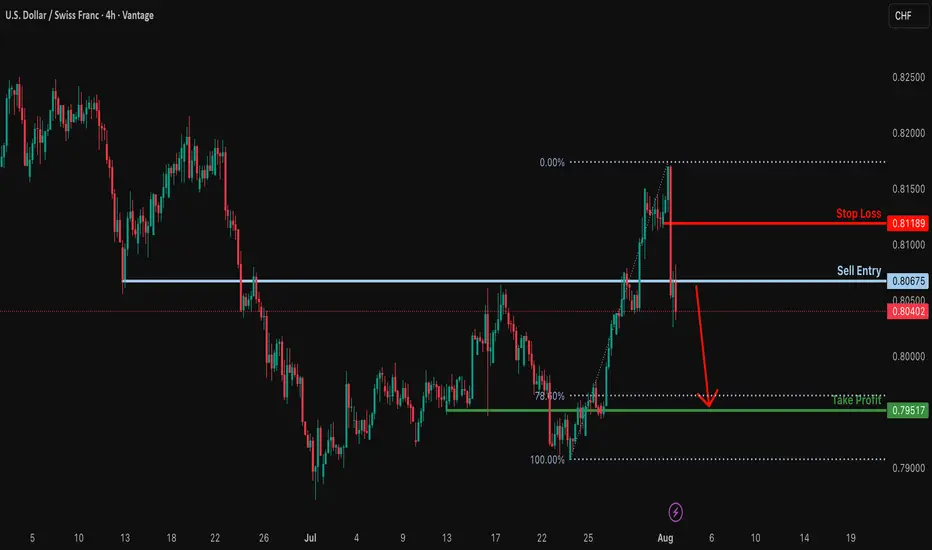
Potential bearish drop?USD/CHF has reacted off the sell entry, which is a pullback resistance, and could drop from this level to our take profit.
Entry: 0.8067
Why we like it:
There is a pullback resistance.
Stop loss: 0.8118
Why we like it:
There is a pullback resistance.
Take profit: 0.7951
Why we like it:
There is a pullback support level that is slightly below the 78.6% Fibonacci retracement.
Enjoying your TradingView experience? Review us!
Please be advised that the information presented on TradingView is provided to Vantage (‘Vantage Global Limited’, ‘we’) by a third-party provider (‘Everest Fortune Group’). Please be reminded that you are solely responsible for the trading decisions on your account. There is a very high degree of risk involved in trading. Any information and/or content is intended entirely for research, educational and informational purposes only and does not constitute investment or consultation advice or investment strategy. The information is not tailored to the investment needs of any specific person and therefore does not involve a consideration of any of the investment objectives, financial situation or needs of any viewer that may receive it. Kindly also note that past performance is not a reliable indicator of future results. Actual results may differ materially from those anticipated in forward-looking or past performance statements. We assume no liability as to the accuracy or completeness of any of the information and/or content provided herein and the Company cannot be held responsible for any omission, mistake nor for any loss or damage including without limitation to any loss of profit which may arise from reliance on any information supplied by Everest Fortune Group.
USDCHFUSDCHF price is near the main support zone 0.79245-0.78590. If the price cannot break through the 0.78590 level, it is expected that the price will rebound. Consider buying the red zone.
🔥Trading futures, forex, CFDs and stocks carries a risk of loss.
Please consider carefully whether such trading is suitable for you.
>>GooD Luck 😊
❤️ Like and subscribe to never miss a new idea!
USDCHF Short term bullish?As dxy looks like it wants to run higher, USDCHF will likely also go higher for a short-term buying for a retracement to then continue its down trend. this pair looks good.
USDCHFHello Traders! 👋
What are your thoughts on USDCHF?
USD/CHF has broken above its descending trendline and cleared a resistance zone, signaling a potential trend reversal and growing bullish momentum.
After some minor consolidation and a pullback to the breakout zone, we expect the pair to continue its rally toward the next identified targets.
The broken resistance now acts as new support, and as long as price remains above this area, the bullish outlook remains valid.
Is USD/CHF ready to extend higher toward its next targets? Share your view below! 🤔👇
Don’t forget to like and share your thoughts in the comments! ❤️
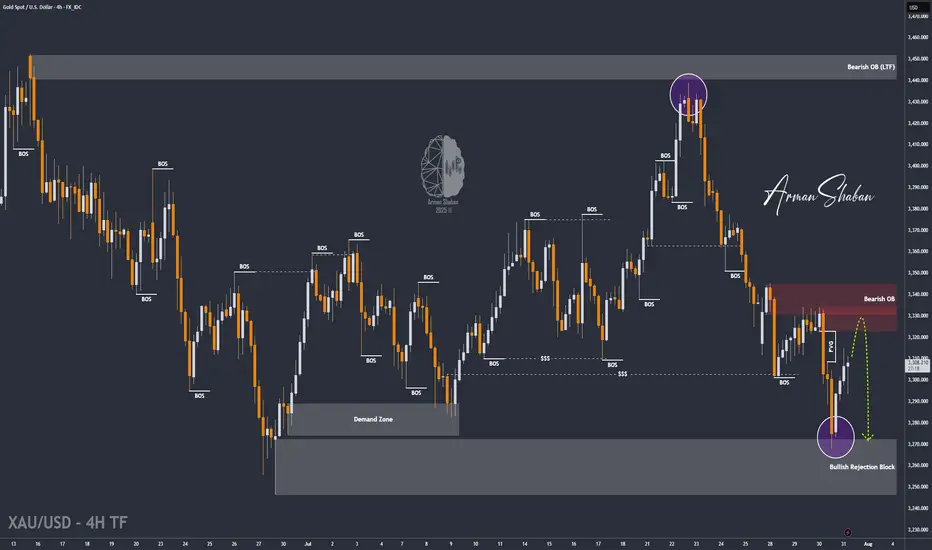
XAU/USD | Next Key Zone: Watch for Rejection at $3334! (READ)By analyzing the gold chart on the 4-hour timeframe, we can see that, just as expected, the price dropped from $3310 to $3288 in the first leg, where it hit a demand zone and bounced up to $3305, delivering a 170-pip rally. The main bearish move from $3333 to $3288 yielded 450 pips, bringing the total return on this analysis to over 620 pips!
In the second phase, gold dropped sharply again to $3268, and once more found demand, currently trading around $3307. If the price holds above $3294, we could expect further upside toward the $3322–$3334 zone. Once gold reaches this area, a strong bearish rejection is likely, with a potential return of 250 to 400 pips.
All key supply and demand levels are marked on the chart — make sure to monitor them closely and study the chart in detail. Hope you’ve made the most of this powerful analysis!
Please support me with your likes and comments to motivate me to share more analysis with you and share your opinion about the possible trend of this chart with me !
Best Regards , Arman Shaban
Will USDCHF remain bullish?
Hi dears
We are at your service with the analysis of the Swiss Franc against the US Dollar. It seems that we should continue to see the strengthening of the US Dollar. It is possible that we will see the growth of the African Dollar against the opposite currency pairs.
What do you think?