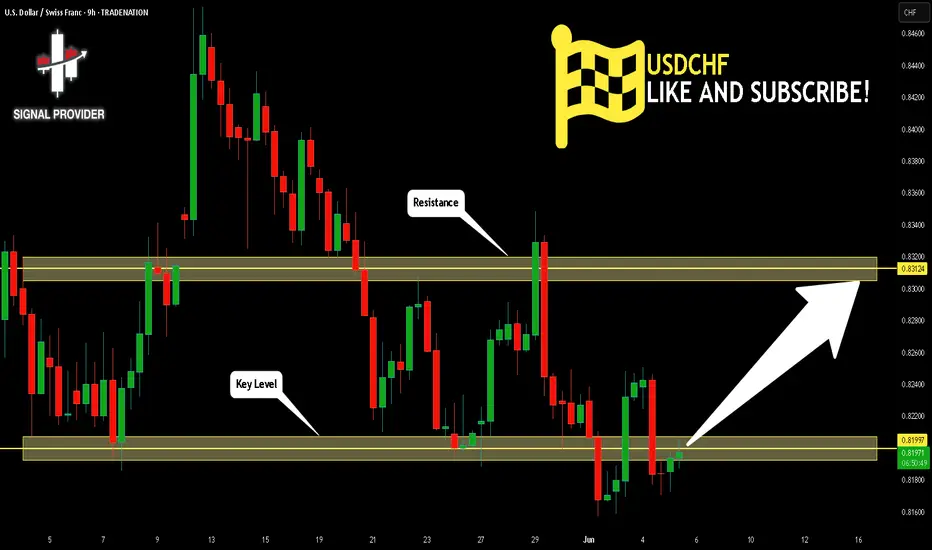
USDCHF Will Go Higher! Long!
Here is our detailed technical review for USDCHF.
Time Frame: 9h
Current Trend: Bullish
Sentiment: Oversold (based on 7-period RSI)
Forecast: Bullish
The market is approaching a significant support area 0.819.
The underlined horizontal cluster clearly indicates a highly probable bullish movement with target 0.831 level.
P.S
Overbought describes a period of time where there has been a significant and consistent upward move in price over a period of time without much pullback.
Disclosure: I am part of Trade Nation's Influencer program and receive a monthly fee for using their TradingView charts in my analysis.
Like and subscribe and comment my ideas if you enjoy them!
USDCHF
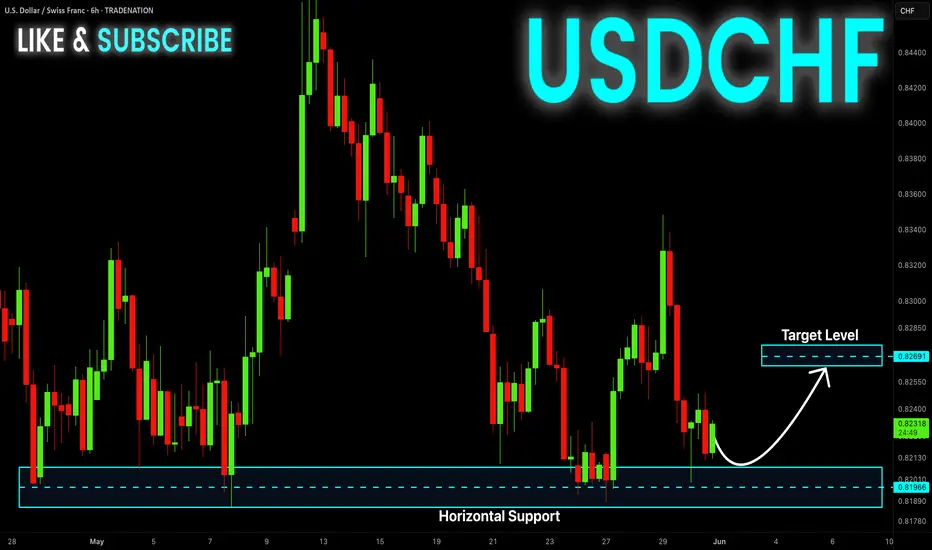
USDCHF H4 I Bullish Bounce OffBased on the H4 chart analysis, the price is falling toward our buy entry level at 0.8114, a pullback support.
Our take profit is set at 0.8192, a pullback resistance.
The stop loss is placed at 0.8038, a swing low support.
High Risk Investment Warning
Trading Forex/CFDs on margin carries a high level of risk and may not be suitable for all investors. Leverage can work against you.
Stratos Markets Limited (tradu.com ):
CFDs are complex instruments and come with a high risk of losing money rapidly due to leverage. 63% of retail investor accounts lose money when trading CFDs with this provider. You should consider whether you understand how CFDs work and whether you can afford to take the high risk of losing your money.
Stratos Europe Ltd (tradu.com ):
CFDs are complex instruments and come with a high risk of losing money rapidly due to leverage. 63% of retail investor accounts lose money when trading CFDs with this provider. You should consider whether you understand how CFDs work and whether you can afford to take the high risk of losing your money.
Stratos Global LLC (tradu.com ):
Losses can exceed deposits.
Please be advised that the information presented on TradingView is provided to Tradu (‘Company’, ‘we’) by a third-party provider (‘TFA Global Pte Ltd’). Please be reminded that you are solely responsible for the trading decisions on your account. There is a very high degree of risk involved in trading. Any information and/or content is intended entirely for research, educational and informational purposes only and does not constitute investment or consultation advice or investment strategy. The information is not tailored to the investment needs of any specific person and therefore does not involve a consideration of any of the investment objectives, financial situation or needs of any viewer that may receive it. Kindly also note that past performance is not a reliable indicator of future results. Actual results may differ materially from those anticipated in forward-looking or past performance statements. We assume no liability as to the accuracy or completeness of any of the information and/or content provided herein and the Company cannot be held responsible for any omission, mistake nor for any loss or damage including without limitation to any loss of profit which may arise from reliance on any information supplied by TFA Global Pte Ltd.
The speaker(s) is neither an employee, agent nor representative of Tradu and is therefore acting independently. The opinions given are their own, constitute general market commentary, and do not constitute the opinion or advice of Tradu or any form of personal or investment advice. Tradu neither endorses nor guarantees offerings of third-party speakers, nor is Tradu responsible for the content, veracity or opinions of third-party speakers, presenters or participants.

AUDCHF BULLISH OR BEARISH DETAILED ANALYSISAUDCHF is currently breaking out of a textbook falling wedge pattern on the 4H chart, signaling a potential shift in momentum from bearish to bullish. Price action has been consolidating within this structure for several weeks, creating lower highs and lower lows, but with clear bullish divergence beginning to show up in recent sessions. The breakout around the 0.53300 zone marks a significant technical confirmation that bulls are taking control, with eyes now on the 0.54400 target.
From a fundamental standpoint, the Australian dollar is gaining strength backed by hawkish sentiment from the RBA. Despite global uncertainties, the RBA’s firm stance on managing inflation is keeping the Aussie resilient. On the flip side, the Swiss franc has been showing signs of relative weakness due to softer inflation readings and safe-haven outflows as global risk sentiment improves. This macro backdrop is creating favorable conditions for AUDCHF to rally.
Technically, this breakout aligns with strong market structure and volume support, making this a high-conviction bullish setup. The breakout candle is closing above resistance with momentum, and as long as price holds above the 0.53250–0.53000 zone, bulls are likely to maintain control. With the falling wedge breakout and favorable risk-reward setup, the upside move toward 0.54400 looks increasingly probable.
This is a clean price action play with fundamental alignment. The breakout not only confirms the end of the previous downtrend, but also opens up space for a bullish wave to unfold. Momentum traders and swing traders will want to watch this closely as AUDCHF transitions from accumulation to a potential bullish expansion phase.

USDCHF is attempting to break out from a key resistanceIf price escapes this level, we could see a move toward the next supply zone near 0.82855. Watch closely for confirmation – this could be a clean transition from one range to the next.
run to another zone

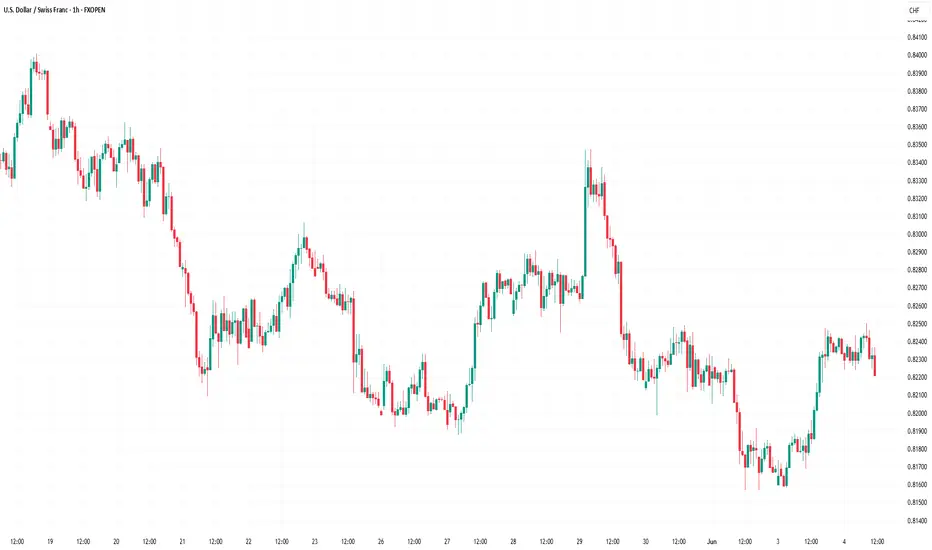
Market Analysis: USD/CHF Targets Upside BreakMarket Analysis: USD/CHF Targets Upside Break
USD/CHF is rising and might aim for a move towards the 0.8250 resistance.
Important Takeaways for USD/CHF Analysis Today
- USD/CHF is showing positive signs above the 0.8200 resistance zone.
- There was a break above a connecting bearish trend line with resistance at 0.8180 on the hourly chart at FXOpen.
USD/CHF Technical Analysis
On the hourly chart of USD/CHF at FXOpen, the pair declined heavily below the 0.8250 level before the bulls appeared. The US Dollar tested 0.8160 and recently started a fresh increase against the Swiss Franc.
The pair climbed above the 0.8200 resistance zone. There was a break above the 23.6% Fib retracement level of the downward move from the 0.8337 swing high to the 0.8157 low. Besides, there was a break above a connecting bearish trend line with resistance at 0.8180.
The bulls are now facing resistance near the 50% Fib retracement level of the downward move from the 0.8337 swing high to the 0.8157 low at 0.8250. The next major resistance is 0.8295.
The main resistance is near 0.8335. If there is a clear break above 0.8335 and the RSI remains above 50, the pair could start another increase. In the stated case, it could test 0.8420.
If there is another decline, the pair might test the 0.8200 support. The first major support on the USD/CHF chart is near the 0.8160 zone. A downside break below 0.8160 might spark bearish moves. The next major support is near the 0.8120 pivot level. Any more losses may possibly open the doors for a move towards the 0.8050 level in the near term.
This article represents the opinion of the Companies operating under the FXOpen brand only. It is not to be construed as an offer, solicitation, or recommendation with respect to products and services provided by the Companies operating under the FXOpen brand, nor is it to be considered financial advice.
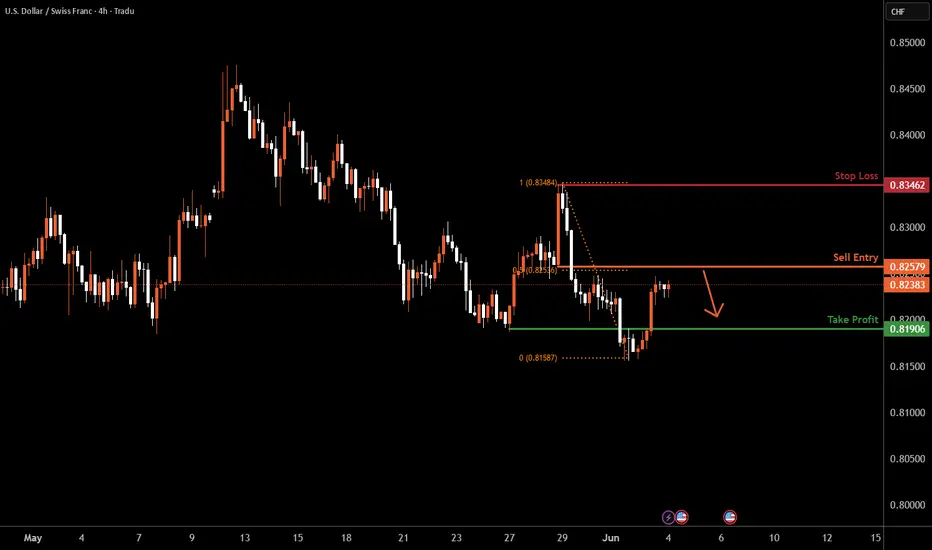
USDCHF SELLBy utilizing levels, historical patterns, , we can formulate a hypothesis that the market might follow a similar trajectory if bearish sentiment prevails.
USDCHF H4 | Bearish Reversal Based on the H1 chart, the price is approaching our sell entry level at 0.8257, a pullback resistance that aligns with the 50% Fib retracement.
Our take profit is set at 0.8190, a pullback support.
The stop loss is set at 0.8346, a swing high resistance.
High Risk Investment Warning
Trading Forex/CFDs on margin carries a high level of risk and may not be suitable for all investors. Leverage can work against you.
Stratos Markets Limited (tradu.com ):
CFDs are complex instruments and come with a high risk of losing money rapidly due to leverage. 63% of retail investor accounts lose money when trading CFDs with this provider. You should consider whether you understand how CFDs work and whether you can afford to take the high risk of losing your money.
Stratos Europe Ltd (tradu.com ):
CFDs are complex instruments and come with a high risk of losing money rapidly due to leverage. 63% of retail investor accounts lose money when trading CFDs with this provider. You should consider whether you understand how CFDs work and whether you can afford to take the high risk of losing your money.
Stratos Global LLC (tradu.com ):
Losses can exceed deposits.
Please be advised that the information presented on TradingView is provided to Tradu (‘Company’, ‘we’) by a third-party provider (‘TFA Global Pte Ltd’). Please be reminded that you are solely responsible for the trading decisions on your account. There is a very high degree of risk involved in trading. Any information and/or content is intended entirely for research, educational and informational purposes only and does not constitute investment or consultation advice or investment strategy. The information is not tailored to the investment needs of any specific person and therefore does not involve a consideration of any of the investment objectives, financial situation or needs of any viewer that may receive it. Kindly also note that past performance is not a reliable indicator of future results. Actual results may differ materially from those anticipated in forward-looking or past performance statements. We assume no liability as to the accuracy or completeness of any of the information and/or content provided herein and the Company cannot be held responsible for any omission, mistake nor for any loss or damage including without limitation to any loss of profit which may arise from reliance on any information supplied by TFA Global Pte Ltd.
The speaker(s) is neither an employee, agent nor representative of Tradu and is therefore acting independently. The opinions given are their own, constitute general market commentary, and do not constitute the opinion or advice of Tradu or any form of personal or investment advice. Tradu neither endorses nor guarantees offerings of third-party speakers, nor is Tradu responsible for the content, veracity or opinions of third-party speakers, presenters or participants.
Potential bearish drop off pullback resistance?The Swissie (USD/CHF) is rising towards the pivot, which acts as a pullback resistance and could drop to the 1st support that aligns with the 78.6% Fibonacci projection.
Pivot: 0.8199
1st Support: 0.8113
1st Resistance: 0.8267
Risk Warning:
Trading Forex and CFDs carries a high level of risk to your capital and you should only trade with money you can afford to lose. Trading Forex and CFDs may not be suitable for all investors, so please ensure that you fully understand the risks involved and seek independent advice if necessary.
Disclaimer:
The above opinions given constitute general market commentary, and do not constitute the opinion or advice of IC Markets or any form of personal or investment advice.
Any opinions, news, research, analyses, prices, other information, or links to third-party sites contained on this website are provided on an "as-is" basis, are intended only to be informative, is not an advice nor a recommendation, nor research, or a record of our trading prices, or an offer of, or solicitation for a transaction in any financial instrument and thus should not be treated as such. The information provided does not involve any specific investment objectives, financial situation and needs of any specific person who may receive it. Please be aware, that past performance is not a reliable indicator of future performance and/or results. Past Performance or Forward-looking scenarios based upon the reasonable beliefs of the third-party provider are not a guarantee of future performance. Actual results may differ materially from those anticipated in forward-looking or past performance statements. IC Markets makes no representation or warranty and assumes no liability as to the accuracy or completeness of the information provided, nor any loss arising from any investment based on a recommendation, forecast or any information supplied by any third-party.

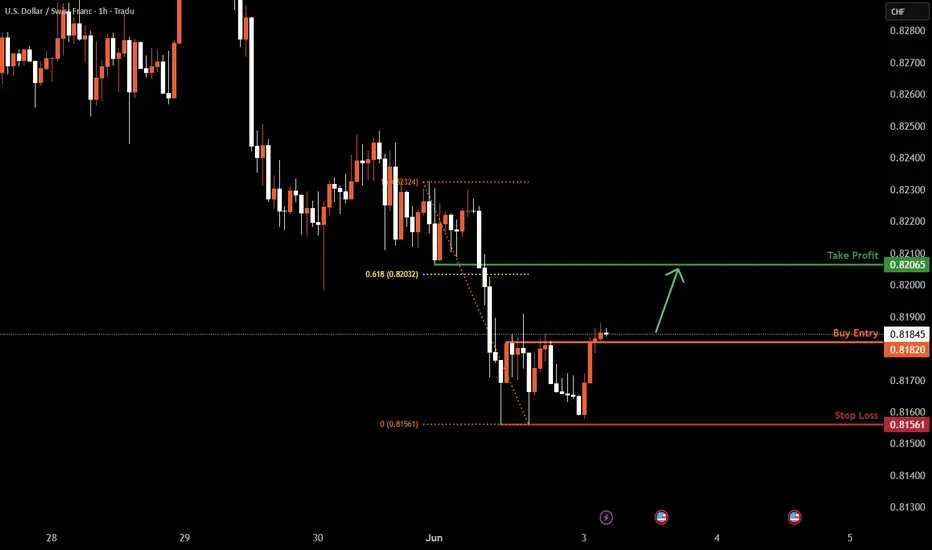
USDCHF H1 I Bullish Bounce Based on the H1 chart analysis, the price is approaching our buy entry level at 0.8185, a pullback support.
Our take profit is set at 0.8206, a pullback resistance that aligns closely with the 61.8% Fibonacci retracement.
The stop loss is placed at 0.8156, a swing lows support.
High Risk Investment Warning
Trading Forex/CFDs on margin carries a high level of risk and may not be suitable for all investors. Leverage can work against you.
Stratos Markets Limited (tradu.com ):
CFDs are complex instruments and come with a high risk of losing money rapidly due to leverage. 63% of retail investor accounts lose money when trading CFDs with this provider. You should consider whether you understand how CFDs work and whether you can afford to take the high risk of losing your money.
Stratos Europe Ltd (tradu.com ):
CFDs are complex instruments and come with a high risk of losing money rapidly due to leverage. 63% of retail investor accounts lose money when trading CFDs with this provider. You should consider whether you understand how CFDs work and whether you can afford to take the high risk of losing your money.
Stratos Global LLC (tradu.com ):
Losses can exceed deposits.
Please be advised that the information presented on TradingView is provided to Tradu (‘Company’, ‘we’) by a third-party provider (‘TFA Global Pte Ltd’). Please be reminded that you are solely responsible for the trading decisions on your account. There is a very high degree of risk involved in trading. Any information and/or content is intended entirely for research, educational and informational purposes only and does not constitute investment or consultation advice or investment strategy. The information is not tailored to the investment needs of any specific person and therefore does not involve a consideration of any of the investment objectives, financial situation or needs of any viewer that may receive it. Kindly also note that past performance is not a reliable indicator of future results. Actual results may differ materially from those anticipated in forward-looking or past performance statements. We assume no liability as to the accuracy or completeness of any of the information and/or content provided herein and the Company cannot be held responsible for any omission, mistake nor for any loss or damage including without limitation to any loss of profit which may arise from reliance on any information supplied by TFA Global Pte Ltd.
The speaker(s) is neither an employee, agent nor representative of Tradu and is therefore acting independently. The opinions given are their own, constitute general market commentary, and do not constitute the opinion or advice of Tradu or any form of personal or investment advice. Tradu neither endorses nor guarantees offerings of third-party speakers, nor is Tradu responsible for the content, veracity or opinions of third-party speakers, presenters or participants.
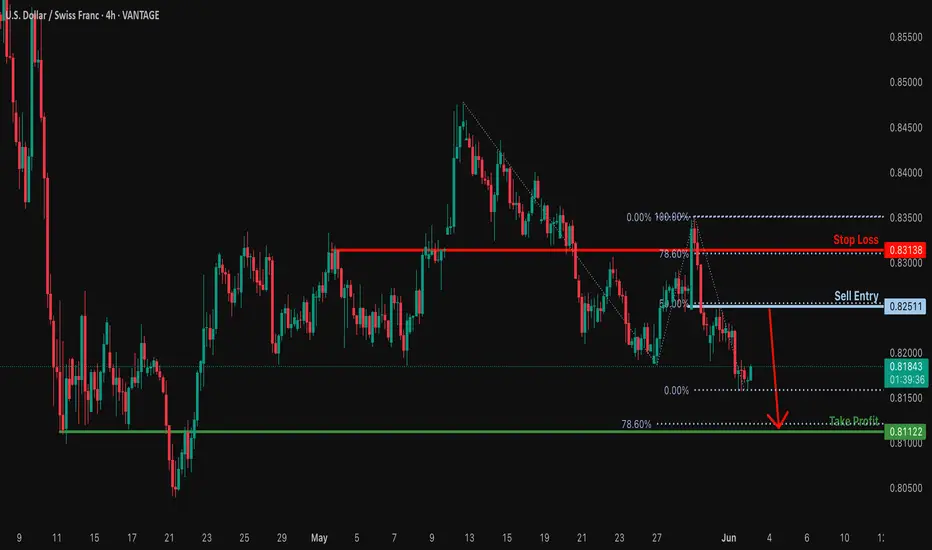
Bearish reversal off 50% Fibonacci resistance?USD/CHF is rising towards the resistance level which is an overlap resistance that lines up with the 50% Fibonacci retracement and could reverse from this level to our take profit.
Entry: 0.8251
Why we like it:
There is an overlap resistance level that lines up with the 50% Fibonacci retracement.
Stop loss: 0.8313
Why we like it:
There is a pullback resistance level that lines up with the 78.6% Fibonacci retracement.
Take profit: 0.8112
Why we like it:
There is a pullback support level that aligns with the 78.6% Fibonacci projection.
Enjoying your TradingView experience? Review us!
Please be advised that the information presented on TradingView is provided to Vantage (‘Vantage Global Limited’, ‘we’) by a third-party provider (‘Everest Fortune Group’). Please be reminded that you are solely responsible for the trading decisions on your account. There is a very high degree of risk involved in trading. Any information and/or content is intended entirely for research, educational and informational purposes only and does not constitute investment or consultation advice or investment strategy. The information is not tailored to the investment needs of any specific person and therefore does not involve a consideration of any of the investment objectives, financial situation or needs of any viewer that may receive it. Kindly also note that past performance is not a reliable indicator of future results. Actual results may differ materially from those anticipated in forward-looking or past performance statements. We assume no liability as to the accuracy or completeness of any of the information and/or content provided herein and the Company cannot be held responsible for any omission, mistake nor for any loss or damage including without limitation to any loss of profit which may arise from reliance on any information supplied by Everest Fortune Group.
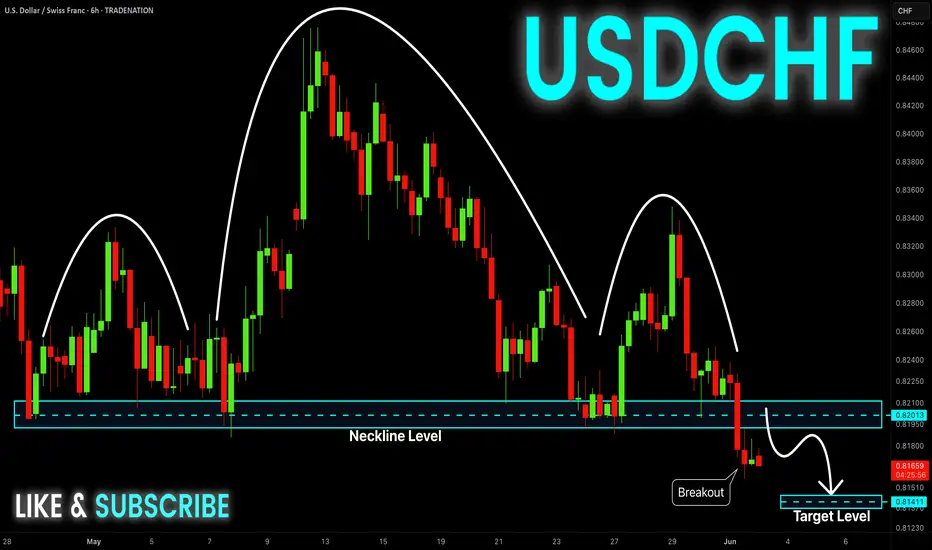
USD/CHF Head and Shoulders Breakdown in FocusUSD/CHF has carved out a head and shoulders top on the daily chart, setting up a potential move lower. If this bearish pattern plays out, the downside target sits around 0.7895. But keep an eye on the April low (0.8040) and the 0.80 handle — both could act as support if price keeps falling.
Matt Simpson, Market Analyst at City Index and Forex.com

USD-CHF Head And Shoulders Breakout! Sell!
Hello,Traders!
USD-CHF formed a H&S
Pattern and then made a
Bearish breakout which is
Confirmed so we are bearish
Biased and we will be expecting
A further bearish move down
Sell!
Comment and subscribe to help us grow!
Check out other forecasts below too!
Disclosure: I am part of Trade Nation's Influencer program and receive a monthly fee for using their TradingView charts in my analysis.
USD/CHF Short Trade IdeaUSD/CHF Short Trade Idea
Renewed USD weakness triggered by fresh US tariff threats, a deepening US-China trade rift, and US fiscal instability underpin CHF demand. Technically, strong bearish momentum remains below 0.8300. Current trading around 0.8180 confirms downside bias.
USD/CHF (Short):
With the USD under persistent pressure from tariff-related uncertainties and deteriorating US-China relations, safe-haven demand for CHF remains elevated. Technical analysis confirms a bearish bias below key resistance at 0.8300. Selling rallies towards 0.8210–0.8240 provides an attractive risk-reward profile targeting recent lows at 0.8100, and potentially extending to the year-to-date trough around 0.8035.

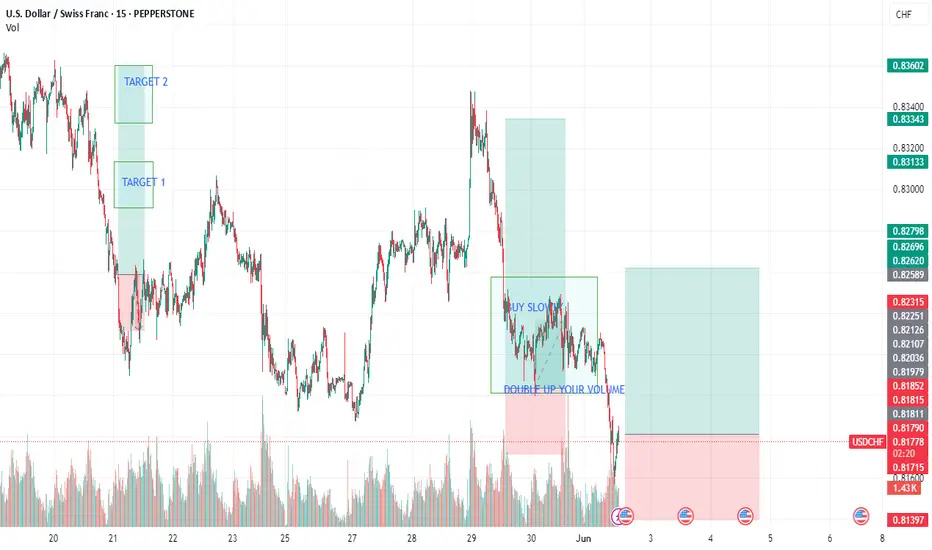
USDCHF - another day another millionTeam, last week, we kill the USDCHF, we went long and great return
Today, it given us another opportunity to kill,
NOTE: once it reach 50-70 pips, TAKE HALF PROFIT AND BRING STOP LOSS TO BE,
The rest let it fly to sky as per chart
Let's go.
USD/CHF BEARS ARE GAINING STRENGTH|SHORT
Hello, Friends!
We are now examining the USD/CHF pair and we can see that the pair is going up locally while also being in a uptrend on the 1W TF. But there is also a powerful signal from the BB upper band being nearby, indicating that the pair is overbought so we can go short from the resistance line above and a target at 0.817 level.
Disclosure: I am part of Trade Nation's Influencer program and receive a monthly fee for using their TradingView charts in my analysis.
✅LIKE AND COMMENT MY IDEAS✅

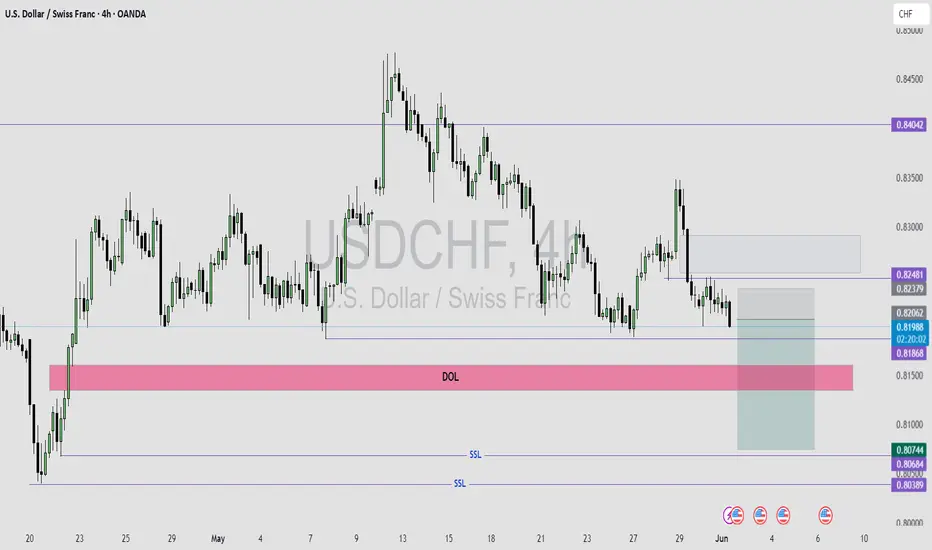
USDCHF SELL IDEAUSDCHF is Ready to continue It's SELL Move to the higher time frame recent swing low of 0.803.
SELL IDEA BREAKDOWN;
Weekly is bearish and price is moving closer to the 0.803 swing low.
Daily is also bearish, price is moving towards the weekly swing low.
4HR had a bearish break in market structure, followed by a retest of the recent swing low that was broken by price to give MSS.
My entry was taken after the formation of a swing low and price is done retesting the old low.
This is a continuation trade.
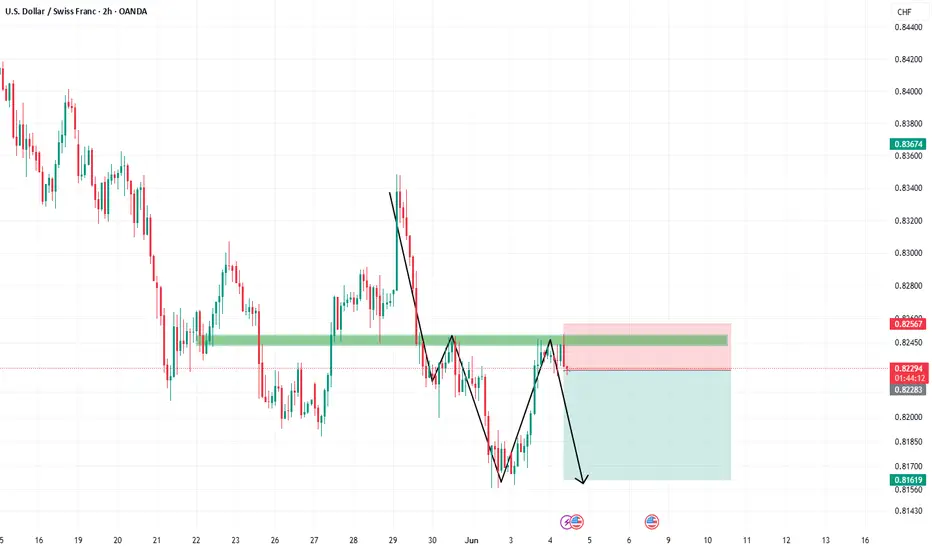
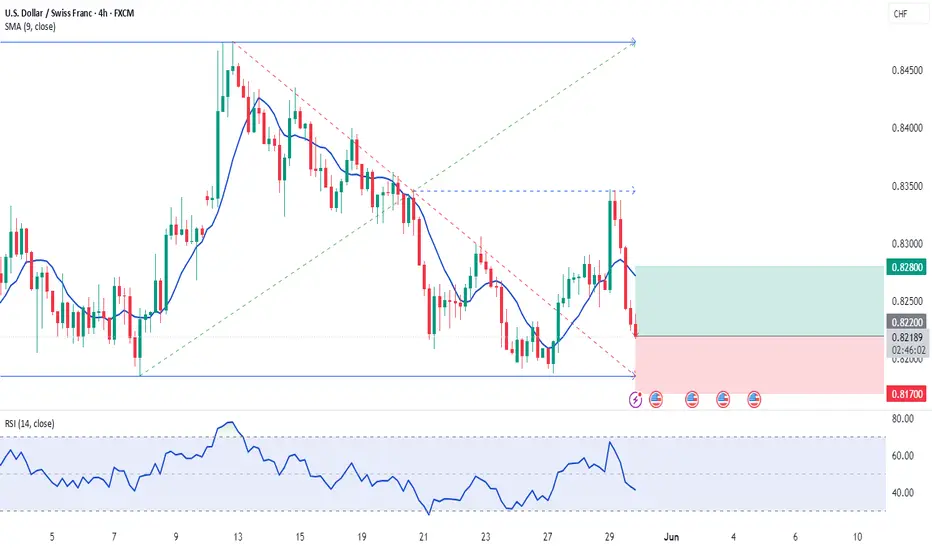
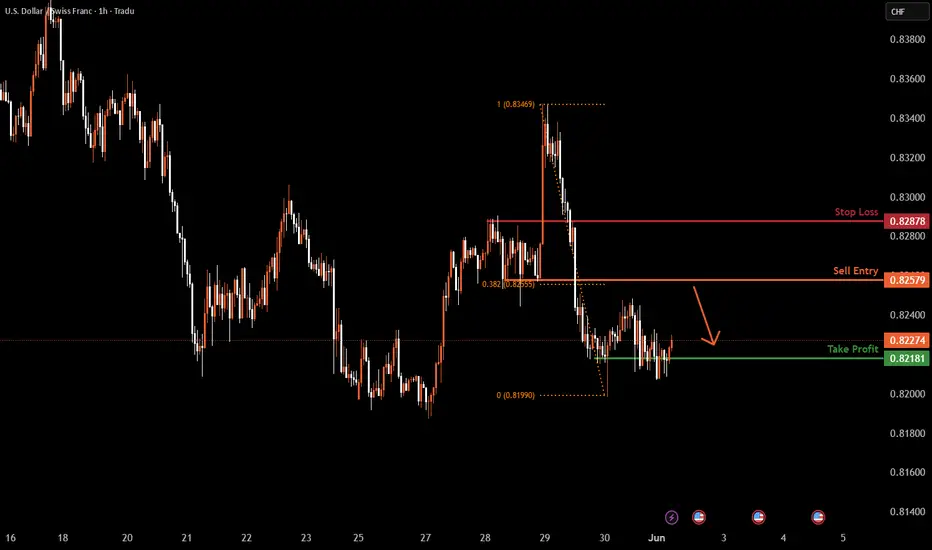
USDCHF H1 | Bearish Reversal Based on the H1 chart, the price is rising toward our sell entry level at 0.8257, a pullback resistance that aligns with the 38.2% Fibo retracement.
Our take profit is set at 0.8218, a pullback support.
The stop loss is set at 0.8287, a pullback resistance.
High Risk Investment Warning
Trading Forex/CFDs on margin carries a high level of risk and may not be suitable for all investors. Leverage can work against you.
Stratos Markets Limited (tradu.com ):
CFDs are complex instruments and come with a high risk of losing money rapidly due to leverage. 63% of retail investor accounts lose money when trading CFDs with this provider. You should consider whether you understand how CFDs work and whether you can afford to take the high risk of losing your money.
Stratos Europe Ltd (tradu.com ):
CFDs are complex instruments and come with a high risk of losing money rapidly due to leverage. 63% of retail investor accounts lose money when trading CFDs with this provider. You should consider whether you understand how CFDs work and whether you can afford to take the high risk of losing your money.
Stratos Global LLC (tradu.com ):
Losses can exceed deposits.
Please be advised that the information presented on TradingView is provided to Tradu (‘Company’, ‘we’) by a third-party provider (‘TFA Global Pte Ltd’). Please be reminded that you are solely responsible for the trading decisions on your account. There is a very high degree of risk involved in trading. Any information and/or content is intended entirely for research, educational and informational purposes only and does not constitute investment or consultation advice or investment strategy. The information is not tailored to the investment needs of any specific person and therefore does not involve a consideration of any of the investment objectives, financial situation or needs of any viewer that may receive it. Kindly also note that past performance is not a reliable indicator of future results. Actual results may differ materially from those anticipated in forward-looking or past performance statements. We assume no liability as to the accuracy or completeness of any of the information and/or content provided herein and the Company cannot be held responsible for any omission, mistake nor for any loss or damage including without limitation to any loss of profit which may arise from reliance on any information supplied by TFA Global Pte Ltd.
The speaker(s) is neither an employee, agent nor representative of Tradu and is therefore acting independently. The opinions given are their own, constitute general market commentary, and do not constitute the opinion or advice of Tradu or any form of personal or investment advice. Tradu neither endorses nor guarantees offerings of third-party speakers, nor is Tradu responsible for the content, veracity or opinions of third-party speakers, presenters or participants.
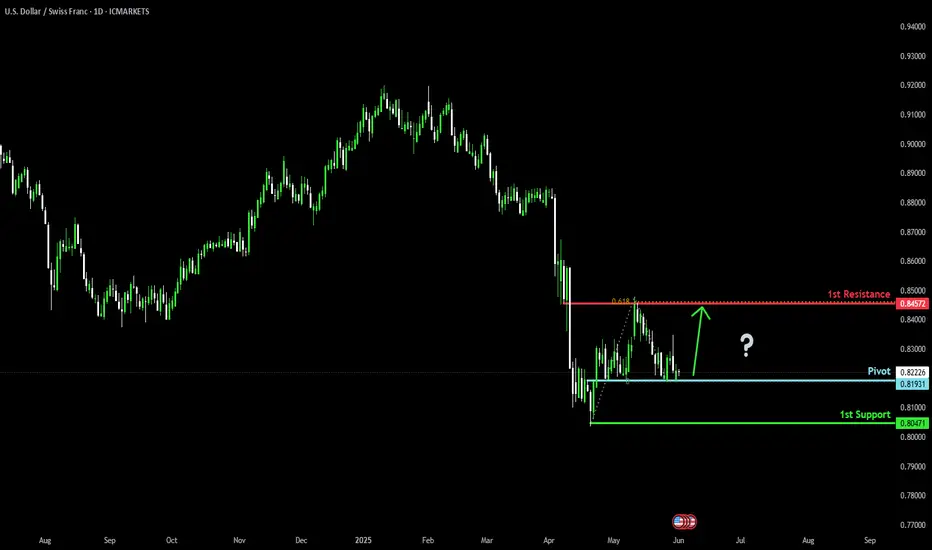
Could the Swissie bounce from here?The price is reacting off the pivot and could bounce to the 1st resistance, which is a pullback resistance that lines up with the 61.8% Fibonacci projection.
Pivot: 0.8193
1st Support: 0.8047
1st Resistance: 0.8457
Risk Warning:
Trading Forex and CFDs carries a high level of risk to your capital and you should only trade with money you can afford to lose. Trading Forex and CFDs may not be suitable for all investors, so please ensure that you fully understand the risks involved and seek independent advice if necessary.
Disclaimer:
The above opinions given constitute general market commentary, and do not constitute the opinion or advice of IC Markets or any form of personal or investment advice.
Any opinions, news, research, analyses, prices, other information, or links to third-party sites contained on this website are provided on an "as-is" basis, are intended only to be informative, is not an advice nor a recommendation, nor research, or a record of our trading prices, or an offer of, or solicitation for a transaction in any financial instrument and thus should not be treated as such. The information provided does not involve any specific investment objectives, financial situation and needs of any specific person who may receive it. Please be aware, that past performance is not a reliable indicator of future performance and/or results. Past Performance or Forward-looking scenarios based upon the reasonable beliefs of the third-party provider are not a guarantee of future performance. Actual results may differ materially from those anticipated in forward-looking or past performance statements. IC Markets makes no representation or warranty and assumes no liability as to the accuracy or completeness of the information provided, nor any loss arising from any investment based on a recommendation, forecast or any information supplied by any third-party.
Weekly FOREX Forecast Jun 2 - 6th: CHF & JPY FuturesThis is the FOREX futures outlook for the week of Jun 2 - 6th.
In this video, we will analyze the following FX markets:
CHF JPY
It's been a consolidative week, but the USD is still weak. Look for valid breakdowns of consolidations before buying against the USD.
NFP week ahead! Mon-Wed will be the best days to trade.
Enjoy!
May profits be upon you.
Leave any questions or comments in the comment section.
I appreciate any feedback from my viewers!
Like and/or subscribe if you want more accurate analysis.
Thank you so much!
Disclaimer:
I do not provide personal investment advice and I am not a qualified licensed investment advisor.
All information found here, including any ideas, opinions, views, predictions, forecasts, commentaries, suggestions, expressed or implied herein, are for informational, entertainment or educational purposes only and should not be construed as personal investment advice. While the information provided is believed to be accurate, it may include errors or inaccuracies.
I will not and cannot be held liable for any actions you take as a result of anything you read here.
Conduct your own due diligence, or consult a licensed financial advisor or broker before making any and all investment decisions. Any investments, trades, speculations, or decisions made on the basis of any information found on this channel, expressed or implied herein, are committed at your own risk, financial or otherwise.

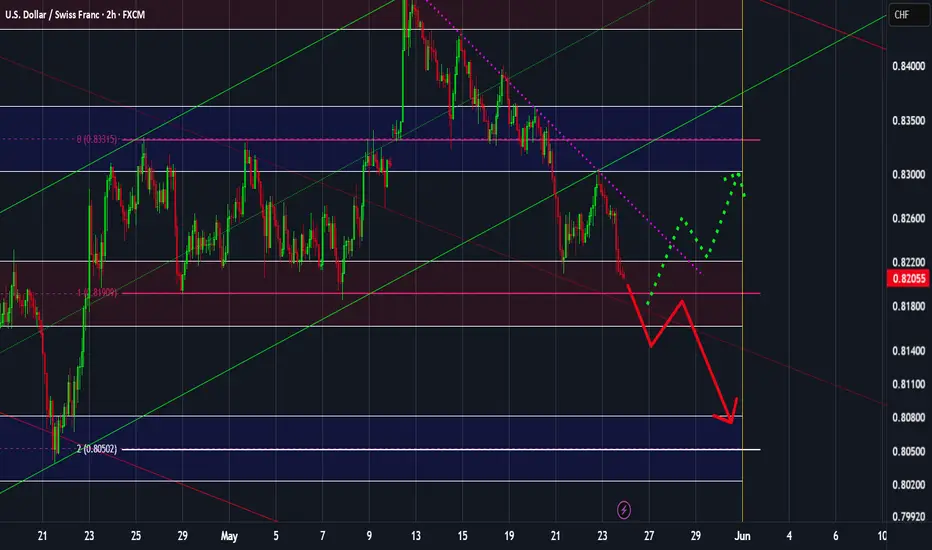
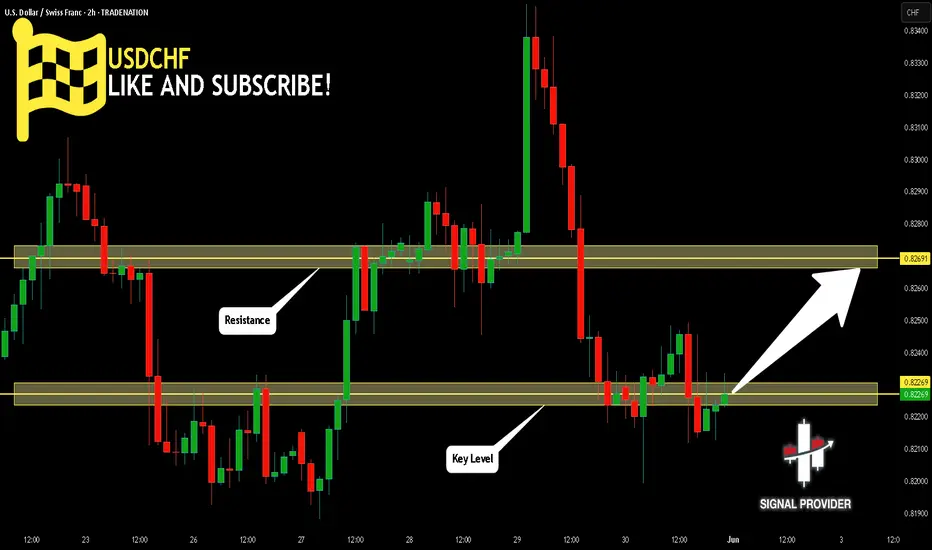
USDCHF Will Go Up From Support! Long!
Please, check our technical outlook for USDCHF.
Time Frame: 2h
Current Trend: Bullish
Sentiment: Oversold (based on 7-period RSI)
Forecast: Bullish
The market is approaching a key horizontal level 0.822.
Considering the today's price action, probabilities will be high to see a movement to 0.826.
P.S
Please, note that an oversold/overbought condition can last for a long time, and therefore being oversold/overbought doesn't mean a price rally will come soon, or at all.
Disclosure: I am part of Trade Nation's Influencer program and receive a monthly fee for using their TradingView charts in my analysis.
Like and subscribe and comment my ideas if you enjoy them!
USD-CHF Growth Ahead! Buy!
Hello,Traders!
USD-CHF is approaching a
Key horizontal support area
Around 0.8189 which is a
Strong level so after the retest
A local bullish correction
And a move up are to be expected
Buy!
Comment and subscribe to help us grow!
Check out other forecasts below too!
Disclosure: I am part of Trade Nation's Influencer program and receive a monthly fee for using their TradingView charts in my analysis.
USDCHF: Weekly analysisThe 0.8191 zone a little tricky! Any breaks over it could active the long trade only if it perfectly breaks over the trend line.
The indicated levels are determined based on the most reaction points and the assumption of approximately equal distance between the zones.
Some of these points can also be confirmed by the mathematical intervals of Murray.
You can enter with/without confirmation. IF you want to take confirmation you can use LTF analysis, Spike move confirmation, Trend Strength confrimation and ETC.
SL could be placed below the zone or regarding the LTF swings.
TP is the next zone or the nearest moving S&R, which are median and borders of the drawn channels.
*******************************************************************
Role of different zones:
GREEN: Just long trades allowed on them.
RED: Just Short trades allowed on them.
BLUE: both long and short trades allowed on them.
WHITE: No trades allowed on them! just use them as TP points