USDCHF - it has been a while. Team, as mentioned, I do not trade forex much, but when I do, we must kill them. In other words, we must focus on a high chance of winning ratio before we trade.
We are back in business again.it has been a while; please ensure we are within target ranges and take profit 40%-70% at the first target and bring stop loss to BE; the rest are the second target if you wish
USDCHF

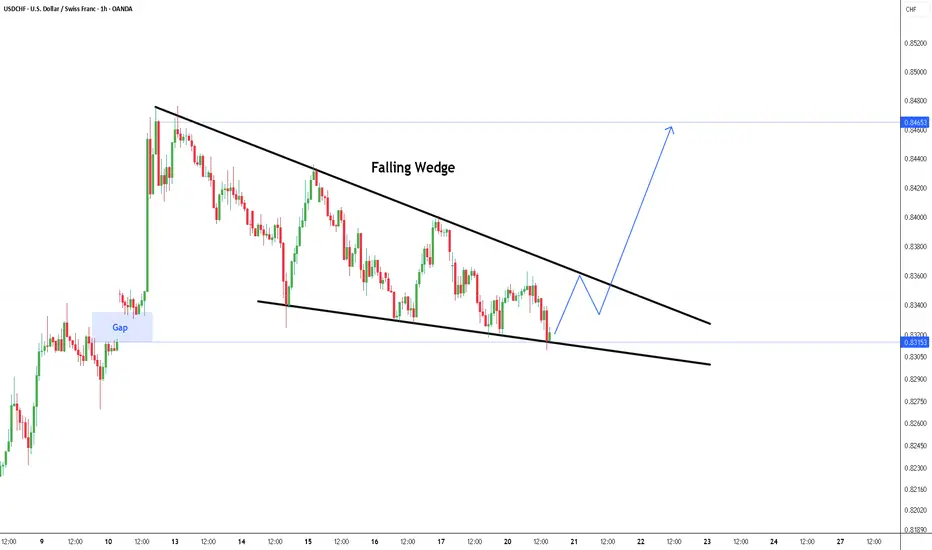
USDCHF Forms Falling Wedge Pattern Near Support GapOn the 1-hour chart, USDCHF is currently forming a falling wedge pattern, a classic technical formation that often precedes a bullish breakout. Price action is compressing within a narrowing range, marked by two downward-sloping trendlines.
Key observations:
A price gap from May 10 still remains unfilled, serving as a potential area of interest for buyers. The market may look to revisit and react to this level.
The lower boundary of the wedge has acted as strong support, with multiple rejections suggesting demand interest.
A break above the upper trendline of the wedge would confirm a potential reversal, with bullish momentum likely accelerating toward the 0.8465 resistance level.
Bullish Scenario:
Breakout Entry: Wait for a decisive breakout and candle close above the upper wedge boundary (around 0.8340–0.8350).
Target 1: 0.8465 (recent swing high and gap origin)
Stop Loss: Below the recent swing low near 0.8280 or just under wedge support (0.8260)
Alternative Scenario:
If the wedge support breaks down with strong bearish momentum, the price may slide lower to retest deeper support near 0.8200.
This setup favors bulls only if the wedge breakout is confirmed. Conservative traders may wait for retest confirmation before entering long positions.
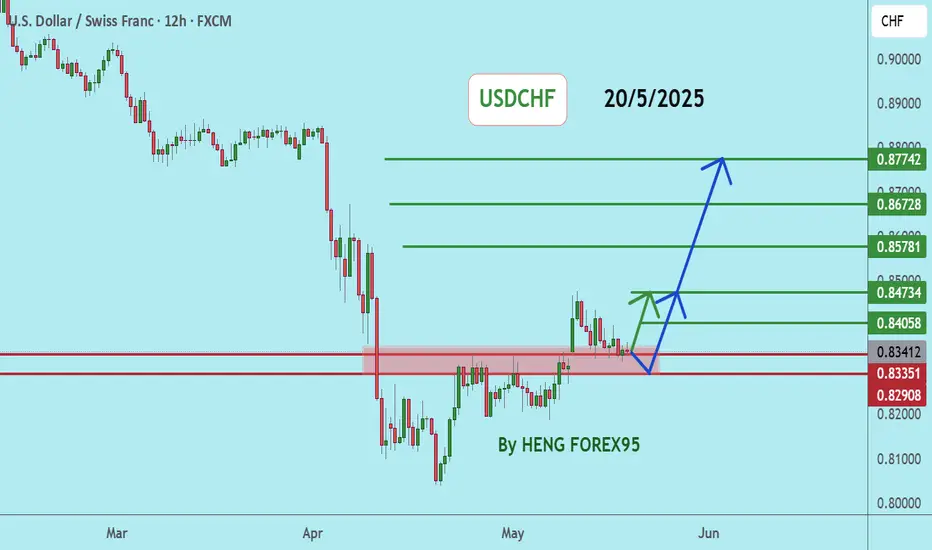
USDCHFUSDCHF price is near the support zone 0.83397-0.82745. If the price cannot break through the 0.82745 level, it is expected that the price will rebound. Consider buying the red zone.
🔥Trading futures, forex, CFDs and stocks carries a risk of loss.
Please consider carefully whether such trading is suitable for you.
>>GooD Luck 😊
❤️ Like and subscribe to never miss a new idea!
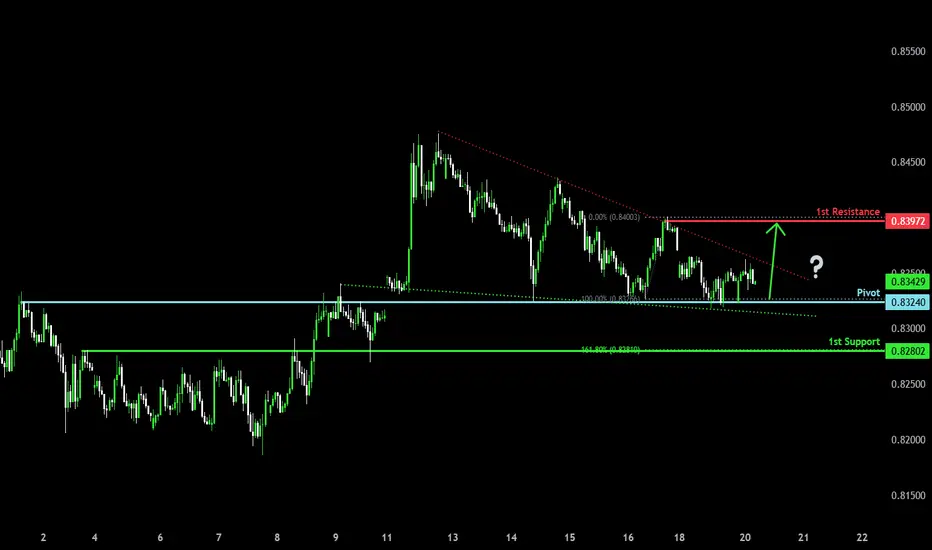
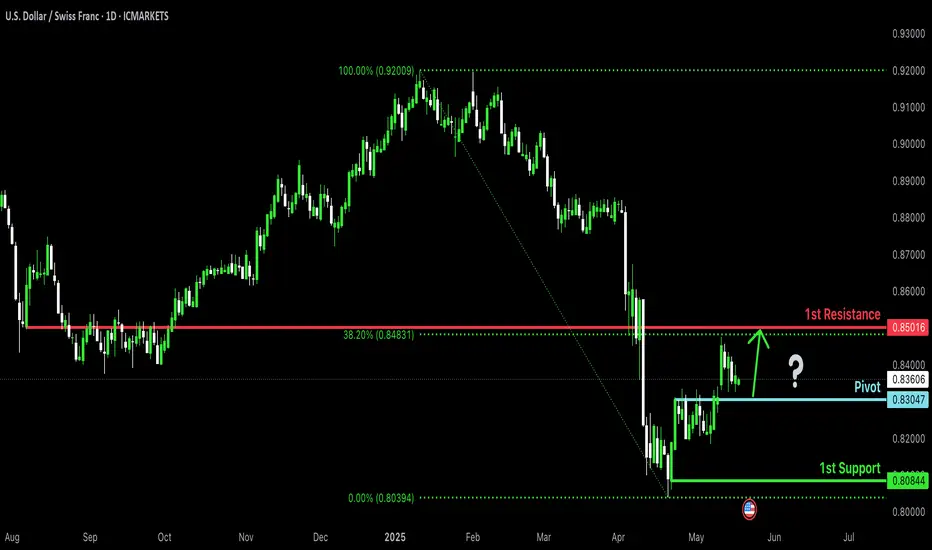
Could the price bounce from here?The Swissie (USD/CHF) has bounced off the pivot and could rise to the 1st, pullback resistance.
Pivot: 0.8324
1st Support: 0.8280
1st Resistance: 0.8397
Risk Warning:
Trading Forex and CFDs carries a high level of risk to your capital and you should only trade with money you can afford to lose. Trading Forex and CFDs may not be suitable for all investors, so please ensure that you fully understand the risks involved and seek independent advice if necessary.
Disclaimer:
The above opinions given constitute general market commentary, and do not constitute the opinion or advice of IC Markets or any form of personal or investment advice.
Any opinions, news, research, analyses, prices, other information, or links to third-party sites contained on this website are provided on an "as-is" basis, are intended only to be informative, is not an advice nor a recommendation, nor research, or a record of our trading prices, or an offer of, or solicitation for a transaction in any financial instrument and thus should not be treated as such. The information provided does not involve any specific investment objectives, financial situation and needs of any specific person who may receive it. Please be aware, that past performance is not a reliable indicator of future performance and/or results. Past Performance or Forward-looking scenarios based upon the reasonable beliefs of the third-party provider are not a guarantee of future performance. Actual results may differ materially from those anticipated in forward-looking or past performance statements. IC Markets makes no representation or warranty and assumes no liability as to the accuracy or completeness of the information provided, nor any loss arising from any investment based on a recommendation, forecast or any information supplied by any third-party.
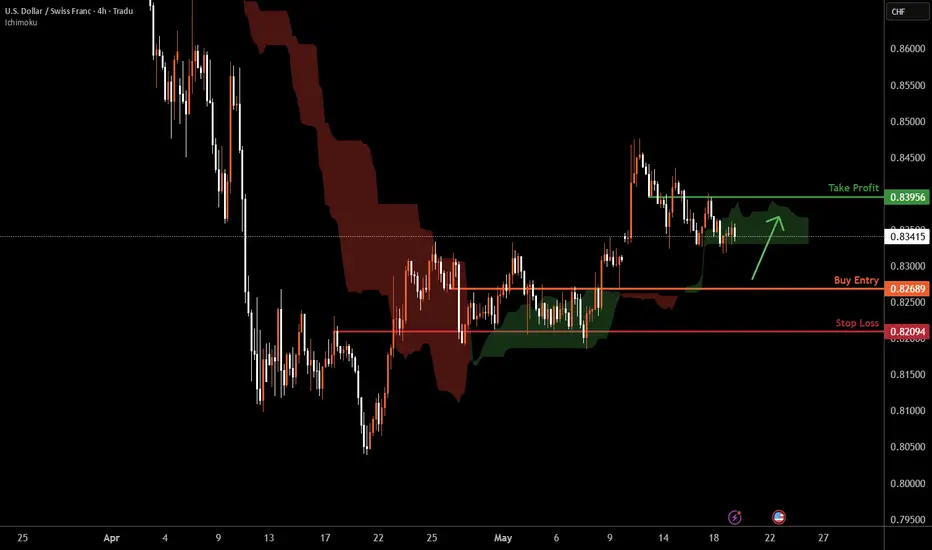
USDCHF H4 I Bullish Bounce Off Based on the H4 chart analysis, the price is falling toward our buy entry level at 0.8268, an overlap support ,
Our take profit is set at 0.8395 an overlap resistance.
The stop loss is placed at 0.8209, an overlap support.
High Risk Investment Warning
Trading Forex/CFDs on margin carries a high level of risk and may not be suitable for all investors. Leverage can work against you.
Stratos Markets Limited (tradu.com):
CFDs are complex instruments and come with a high risk of losing money rapidly due to leverage. 63% of retail investor accounts lose money when trading CFDs with this provider. You should consider whether you understand how CFDs work and whether you can afford to take the high risk of losing your money.
Stratos Europe Ltd (tradu.com):
CFDs are complex instruments and come with a high risk of losing money rapidly due to leverage. 63% of retail investor accounts lose money when trading CFDs with this provider. You should consider whether you understand how CFDs work and whether you can afford to take the high risk of losing your money.
Stratos Global LLC (tradu.com):
Losses can exceed deposits.
Please be advised that the information presented on TradingView is provided to Tradu (‘Company’, ‘we’) by a third-party provider (‘TFA Global Pte Ltd’). Please be reminded that you are solely responsible for the trading decisions on your account. There is a very high degree of risk involved in trading. Any information and/or content is intended entirely for research, educational and informational purposes only and does not constitute investment or consultation advice or investment strategy. The information is not tailored to the investment needs of any specific person and therefore does not involve a consideration of any of the investment objectives, financial situation or needs of any viewer that may receive it. Kindly also note that past performance is not a reliable indicator of future results. Actual results may differ materially from those anticipated in forward-looking or past performance statements. We assume no liability as to the accuracy or completeness of any of the information and/or content provided herein and the Company cannot be held responsible for any omission, mistake nor for any loss or damage including without limitation to any loss of profit which may arise from reliance on any information supplied by TFA Global Pte Ltd.
The speaker(s) is neither an employee, agent nor representative of Tradu and is therefore acting independently. The opinions given are their own, constitute general market commentary, and do not constitute the opinion or advice of Tradu or any form of personal or investment advice. Tradu neither endorses nor guarantees offerings of third-party speakers, nor is Tradu responsible for the content, veracity or opinions of third-party speakers, presenters or participants.
USD-CHF Will Grow! Buy!
Hello,Traders!
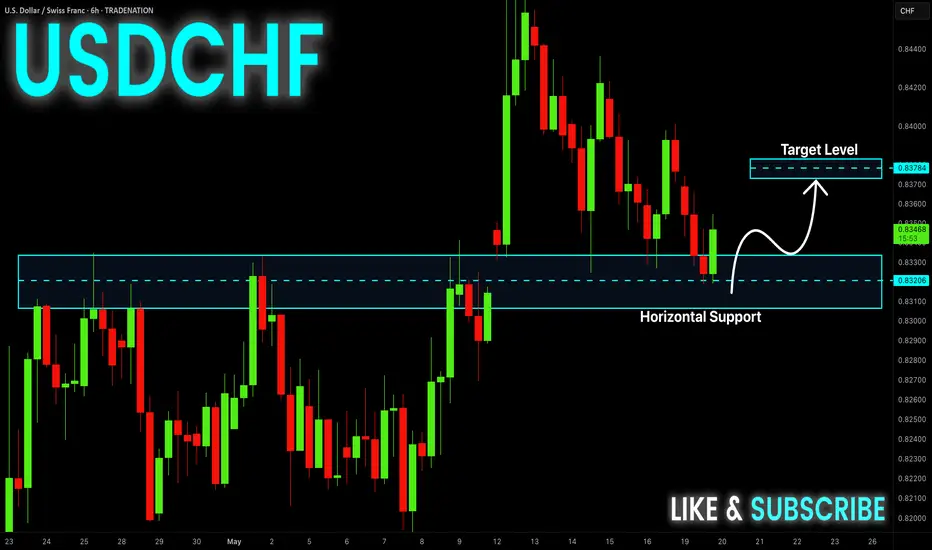
USD-CHF made a retest of
The horizontal support level
Of 0.8318 from where we
Are already seeing a bullish
Rebound so we are locally
Bullish biased and we will
Be expecting a further
Bullish move up
Buy!
Comment and subscribe to help us grow!
Check out other forecasts below too!
Disclosure: I am part of Trade Nation's Influencer program and receive a monthly fee for using their TradingView charts in my analysis.
“Can You Snatch Profits from USD/CHF’s Wild Swings?”🔥 Swissy Snatch Strategy: USD/CHF Stealth Trade Plan 🔥
👋 Greetings, Profit Pirates & Chart Ninjas! 🕵️♂️💸
Welcome to the Swissy Snatch Strategy—a cunning, calculated raid on the USD/CHF market. This plan fuses razor-sharp technicals with real-time fundamentals to snatch profits from Swissy’s wild swings.
Let’s move like shadows, strike fast, and vanish with the gains! 🌑📈
📜 The Swissy Snatch Blueprint
Entry Triggers 🔑:
🔼 Bullish Ambush: Enter long on a breakout above ~0.86500 (key resistance/EMA level), signaling a potential rally.
🔼 Pullback Ambush: Buy at ~0.85800 (Institutional Trap zone for a dip-buy).
💡 Pro Tip: Set price alerts at these levels to trade without staring at charts! 🔔
Stop Loss (SL) 🛡️:
🟢 Bullish Trade: Place SL below the recent 4H swing low (~0.85300 for breakout trades) to cushion against wicks.
📉 Stay Flexible: Adjust SL based on risk tolerance, lot size, and volatility (ATR ~60 pips daily). This is your safety net!
Take Profit (TP) 💰:
🚀 Bullish Raiders: Target ~0.86900 (Fibonacci 61.8% retracement from 0.9000–0.8200) or exit on fading volume.
🚪 Escape Tactic: Watch RSI for overbought (>70) signals to dodge reversals. Consider partial profits at ~0.86000 (1:1 risk-reward).
🌐 Why Trade USD/CHF Now?
USD/CHF is a volatility goldmine, driven by:
💵 USD Strength: Hawkish Fed signals (e.g., Powell’s May 2025 comments on sustained 4% rates) and robust Q1 2025 GDP (2.8% annualized) fuel USD bullishness, pushing USD/CHF higher.
🇨🇭 CHF Weakness: Swiss National Bank (SNB) holds rates steady at 1.25% (Q4 2024 decision), with low safe-haven demand for CHF due to easing geopolitical tensions (e.g., US-China trade talk progress).
📈 Yield Differentials: US 10-year Treasury yields at 4.2% (May 19, 2025) attract capital to USD, supporting USD/CHF uptrends.
📊 Technical Edge: RSI (14-day) at 52 signals neutral momentum with room for a bullish push. Fibonacci retracement levels highlight resistance at 0.86900 and support at 0.85500.
🎢 Volatility: USD/CHF’s daily ranges of 0.8–1.2% (80–120 pips) offer quick profit potential for agile traders.
Current price (May 19, 2025): ~0.8620, testing resistance at 0.86500.
📊 Real-Time Sentiment Snapshot (May 19, 2025)
Retail Traders:
📈 Bullish: 40% 🌟 (Betting on USD strength).
📉 Bearish: 45% ⚡ (Cautious on CHF safe-haven spikes).
⚖️ Neutral: 15% 🧭 (Awaiting US data clarity).
Institutional Traders:
🏦 Bullish: 60% 🏦 (Favoring USD on yield spreads).
📉 Bearish: 30% 📉 (Hedging for CHF strength).
⚖️ Neutral: 10% ⚖️ (Monitoring Fed/SNB cues).
⚠️ Key Risks:
US CPI: A hotter-than-expected print could spike USD/CHF to 0.8700. A miss may test 0.85500.
SNB: Dovish SNB comments could weaken CHF further, boosting your bullish setup.
Geopolitics: Sudden US-China trade escalations may strengthen CHF, invalidating longs.
Technical Validation (May 19, 2025)
Price Action: USD/CHF at ~0.8620, eyeing resistance at 0.86500–0.8700, with support at 0.85500–0.85800 (4H chart).
EMA: 50-EMA (~0.8600) acts as dynamic support. A breakout above 0.86500 confirms bullish momentum.
Fibonacci: From March 2025 high (0.9000) to April low (0.8200), 61.8% retracement (~0.8680) matches your TP of 0.86900.
RSI (14-day): At 52, room for upside if US data supports USD.
Volume: Rising on recent upticks, supporting breakout potential.
ATR (14-day): 60 pips, guiding SL (50–60 pips) and TP (~100–120 pips).
Strategy Enhancements
To make the Swissy Snatch even deadlier:
Refined Entries: Confirm 0.86500 breakout with volume spike or 0.85800 pullback with RSI >40.
Timeframe Clarity: Use 1H or 4H for entries, 4H for swing lows (SL).
Bearish Contingency: Short below 0.85500 (support break) if CPI disappoints, targeting 0.85000.
ATR Scaling: Adjust SL/TP to ATR (e.g., SL at 1x ATR, TP at 2x ATR) for volatility-adapted trades.
Chart Visuals: For TradingView, annotate EMA, Fib levels, and RSI to boost engagement.
Join the Swissy Snatch Squad!
👉 Smash that Boost button to make this strategy a TradingView legend! 🚀
Every like and share fuels more high-octane trade plans.
Let’s conquer USD/CHF together! 🤜🤛
Keep charts locked, alerts primed, and trading spirit electric.
See you in the profit zone, ninjas! 🏴☠️📈

Bullish bounce off pullback support?The Swissie (USD/CHF) is falling towards the pivot which has been identified as a pullback support and could bounce to the 1st resistance which is also a pullback resistance.
Pivot: 0.8304
1st Support: 0.8084
1st Resistance: 0.8501
Risk Warning:
Trading Forex and CFDs carries a high level of risk to your capital and you should only trade with money you can afford to lose. Trading Forex and CFDs may not be suitable for all investors, so please ensure that you fully understand the risks involved and seek independent advice if necessary.
Disclaimer:
The above opinions given constitute general market commentary, and do not constitute the opinion or advice of IC Markets or any form of personal or investment advice.
Any opinions, news, research, analyses, prices, other information, or links to third-party sites contained on this website are provided on an "as-is" basis, are intended only to be informative, is not an advice nor a recommendation, nor research, or a record of our trading prices, or an offer of, or solicitation for a transaction in any financial instrument and thus should not be treated as such. The information provided does not involve any specific investment objectives, financial situation and needs of any specific person who may receive it. Please be aware, that past performance is not a reliable indicator of future performance and/or results. Past Performance or Forward-looking scenarios based upon the reasonable beliefs of the third-party provider are not a guarantee of future performance. Actual results may differ materially from those anticipated in forward-looking or past performance statements. IC Markets makes no representation or warranty and assumes no liability as to the accuracy or completeness of the information provided, nor any loss arising from any investment based on a recommendation, forecast or any information supplied by any third-party.
USDCHF Update | ~200pipsSince the last post USDCHF sold off towards the demand zone and broke below support. Price is now pulling back towards the mid channel of the range where bulls will be tested again.
For now price looks bullish but could see another selloff later down the road.

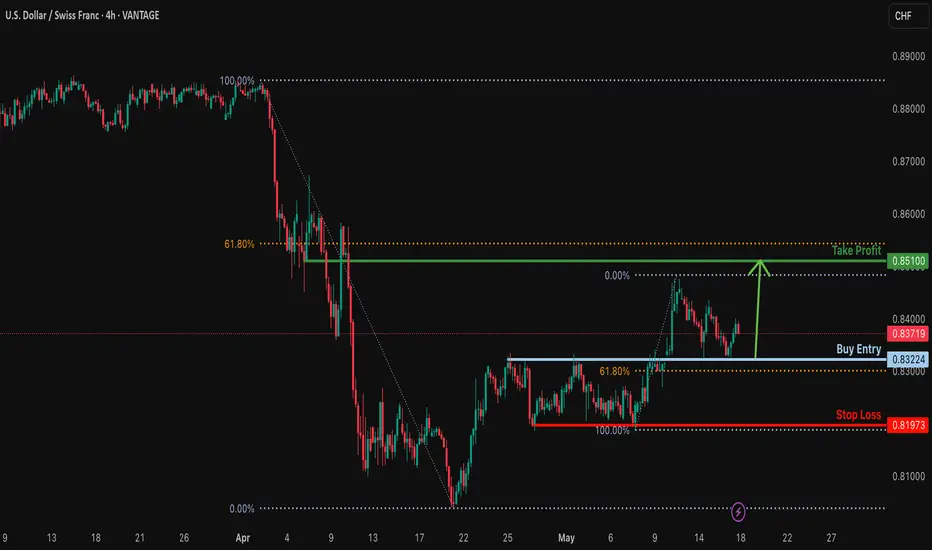
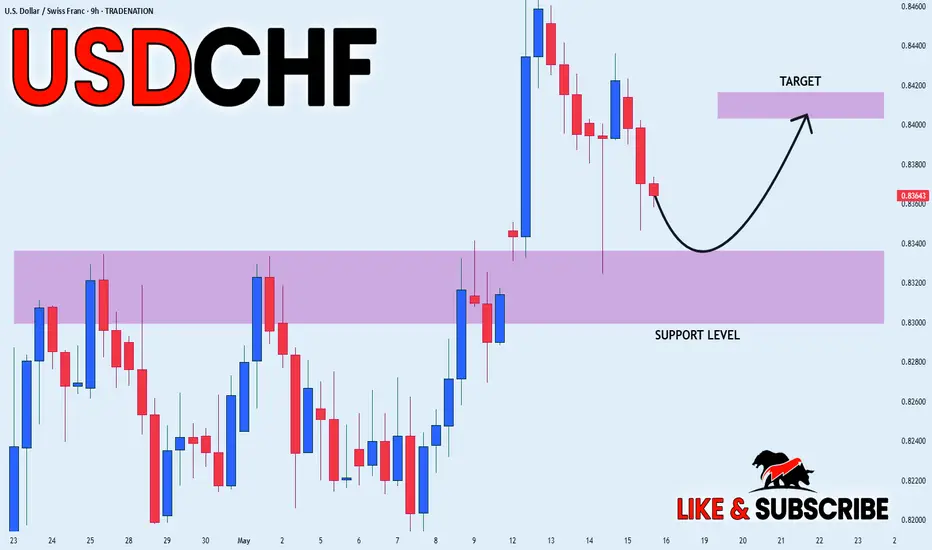
Bullish bounce for the Swissie?The price has bounced off the support level which is a pullback support that lines up with the 61.8% Fibonacci retracement and could potentially rise from this level to our take profit.
Entry: 0.8322
Why we like it:
There is a pullback support level that lines up with the 61.8% Fibonacci retracement.
Stop loss: 0.8197
Why we like it:
There is a pullback support level.
Take profit: 0.8510
Why we like it:
There is a pullback resistance level that is slightly below the 61.8% Fibonacci retracement.
Enjoying your TradingView experience? Review us!
Please be advised that the information presented on TradingView is provided to Vantage (‘Vantage Global Limited’, ‘we’) by a third-party provider (‘Everest Fortune Group’). Please be reminded that you are solely responsible for the trading decisions on your account. There is a very high degree of risk involved in trading. Any information and/or content is intended entirely for research, educational and informational purposes only and does not constitute investment or consultation advice or investment strategy. The information is not tailored to the investment needs of any specific person and therefore does not involve a consideration of any of the investment objectives, financial situation or needs of any viewer that may receive it. Kindly also note that past performance is not a reliable indicator of future results. Actual results may differ materially from those anticipated in forward-looking or past performance statements. We assume no liability as to the accuracy or completeness of any of the information and/or content provided herein and the Company cannot be held responsible for any omission, mistake nor for any loss or damage including without limitation to any loss of profit which may arise from reliance on any information supplied by Everest Fortune Group.
DON'T DISS USDCHF, WE ARE GOING LONG!USDCHF FORECAST Q2 W21 Y25 DON'T DISS USDCHF, WE ARE GOING LONG!USDCHF FORECAST Q2 W21 Y25
Professional Risk Managers👋
Welcome back to another FRGNT chart update📈
Diving into some Forex setups using predominantly higher time frame order blocks alongside confirmation breaks of structure.
Let’s see what price action is telling us today!
💡Here are some trade confluences📝
✅Weekly order block rejection
✅Daily order block rejection
✅15’ order block
✅Intraday bullish breaks of structure
🔑 Remember, to participate in trading comes always with a degree of risk, therefore as professional risk managers it remains vital that we stick to our risk management plan as well as our trading strategies.
📈The rest, we leave to the balance of probabilities.
💡Fail to plan. Plan to fail.
🏆It has always been that simple.
❤️Good luck with your trading journey, I shall see you at the very top.
🎯Trade consistent, FRGNT X
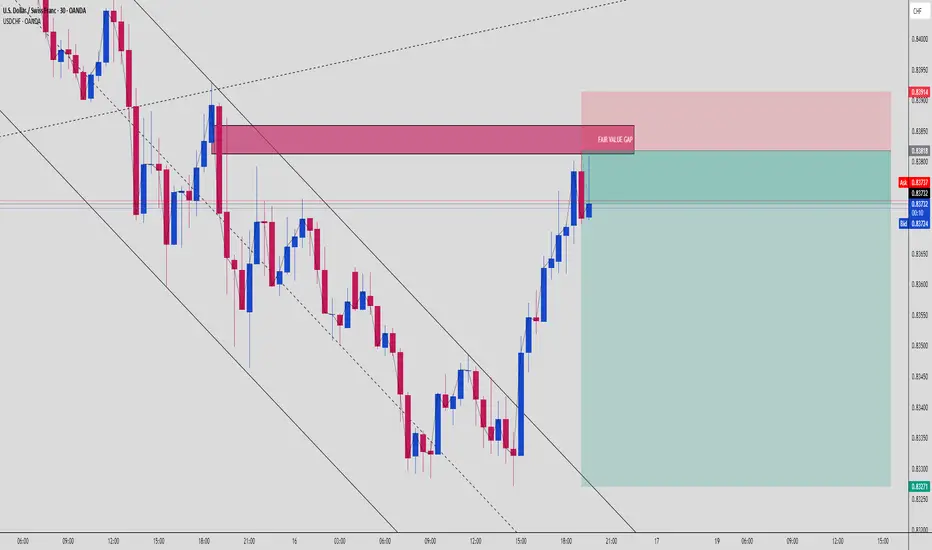
USDCHF 30M | Fair Value Gap Sell Setup Inside Bearish Channel📊 USD/CHF Smart Money Breakdown — May 16, 2025
Here’s a clean SMC-driven setup where price respects the bearish order flow, taps a Fair Value Gap (FVG) and rejects right at liquidity inducement levels.
Let’s break it down 👇
🔍 1. Context
Price is respecting a descending channel structure
Clean internal liquidity run up into:
✅ FVG zone from prior imbalance
✅ Top of bearish channel trendline
This is a classic liquidity sweep before expansion lower
🎯 2. Entry Plan
Entry zone: 0.8375–0.8391 (FVG zone shaded in red)
Stop loss: Just above 0.8391 (invalidates FVG zone)
Target zone:
🟢 TP1 → 0.8340 (minor inefficiency fill)
🟢 TP2 → 0.8327 (liquidity resting at the low)
➡️ RR ratio is about 1:3 on full target — clean sniper range!
📉 3. Smart Money Logic
Retail likely triggered buy orders into that FVG zone
Institutions tap FVG for premium entry
Price already printing rejection wicks — early signs of displacement
Watch for confirmation via:
Bearish engulfing candle close
Break of minor bullish structure on 5m
⚠️ Risk Notes:
Watch out for USD fundamental news that might cause a fakeout spike
Let price confirm breakdown before stacking entries
💬 Do you trust the FVG? Or think price will smash through?
🧠 Drop your confluence in the comments below and follow @ChartNinjas88 for precision setups like this every day.
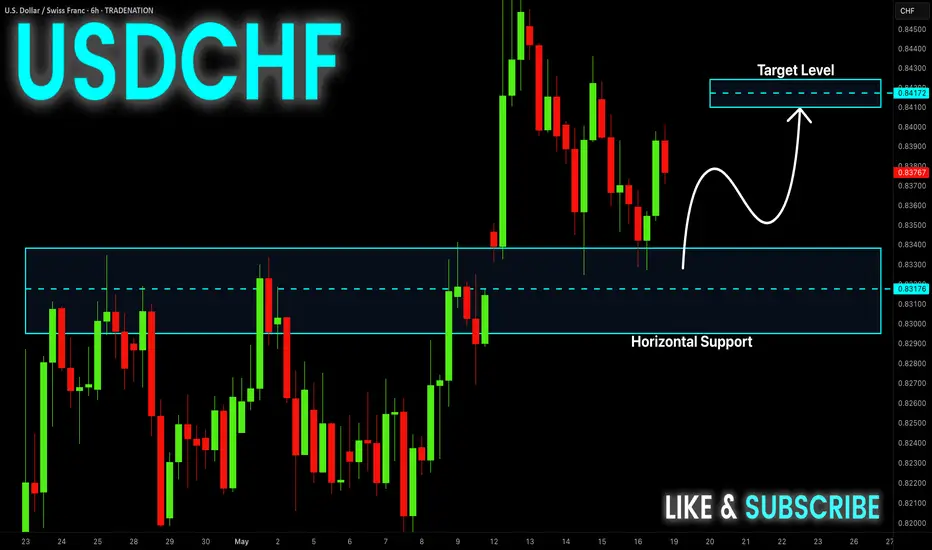
USD-CHF Growth Ahead! Buy!
Hello,Traders!
USD-CHF made a bullish
Rebound from the horizontal
Support level around 0.8318
So we are locally bullish
Biased and we will be
Expecting further growth
On Monday
Buy!
Comment and subscribe to help us grow!
Check out other forecasts below too!
Disclosure: I am part of Trade Nation's Influencer program and receive a monthly fee for using their TradingView charts in my analysis.
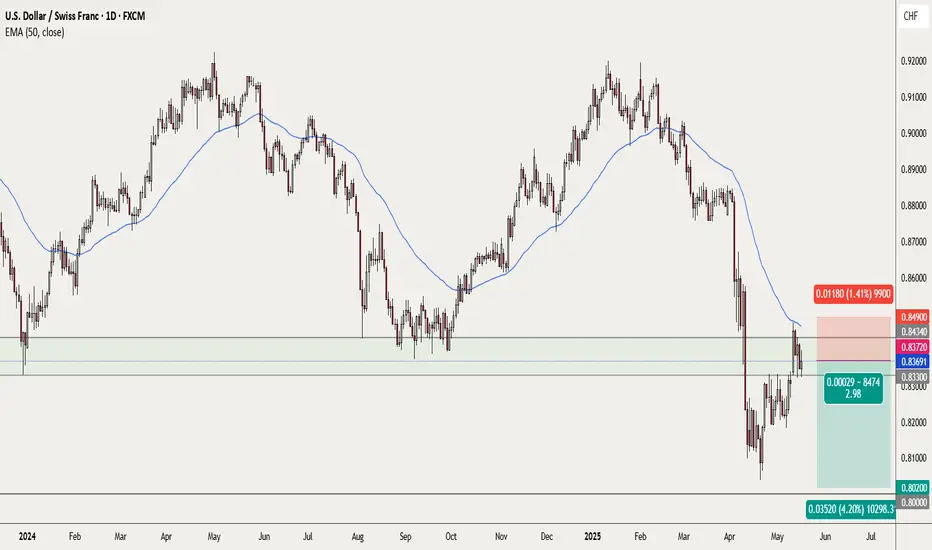
USDCHF looks ready to resume the downtrend .the week of 19 May The area between 0.8434 and 0.8330 has been a strong support all year but got broken to the downside on 10 April. Since then, this pair gave several day trades as it pulled back to the zone (see my previous posts). As my daily chart shows, the recent retracement helped price to catch up to the 50ema and is now nicely below it.
I will be monitoring price action also on H4 to confirm if my analysis is correct and act if appropriate. We could be looking at a trade with +350 pips potential in uncertain times (due to unconventional Trumpeconomics) so I would be prepared for large swings and the need to hold the trade for extended time periods.
This is not a trade recommendation; it’s merely my own analysis. Trading carries a high level of risk so carefully managing your capital and risk is important. If you like my idea, please give a “boost” and follow me to get even more.
It’s not whether you are right or wrong, but how much money you make when you are right and how much you lose when you are wrong – George Soros
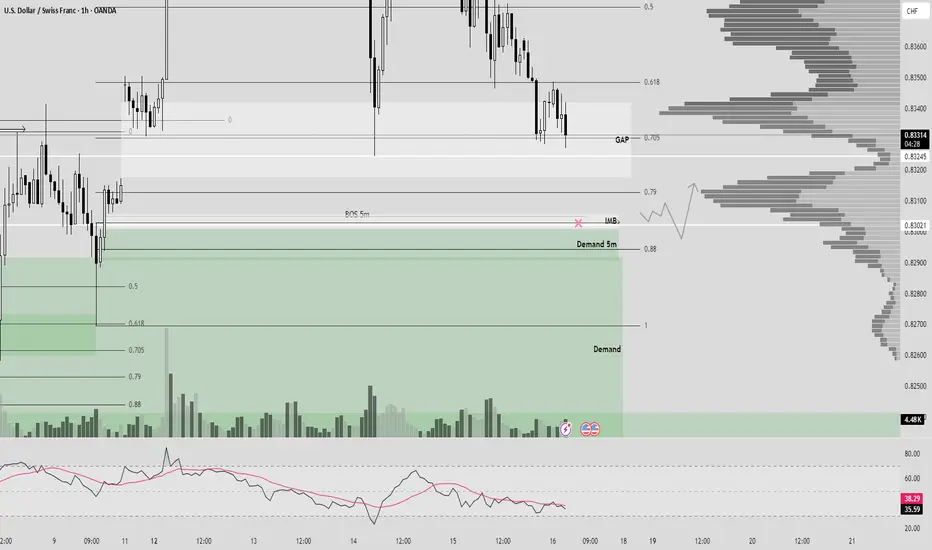
USDCHF 1H (BOS 5m + Demand 5m + IMB + OTE)Hello traders!
As you see price wants to close fully GAP. Near our POI(BOS 5m + Demand) - I expecting reversal from demand zone.
TP - MINIMUM to global GAP 1W.
Have a profitable day and don't forget to subscribe for updates!
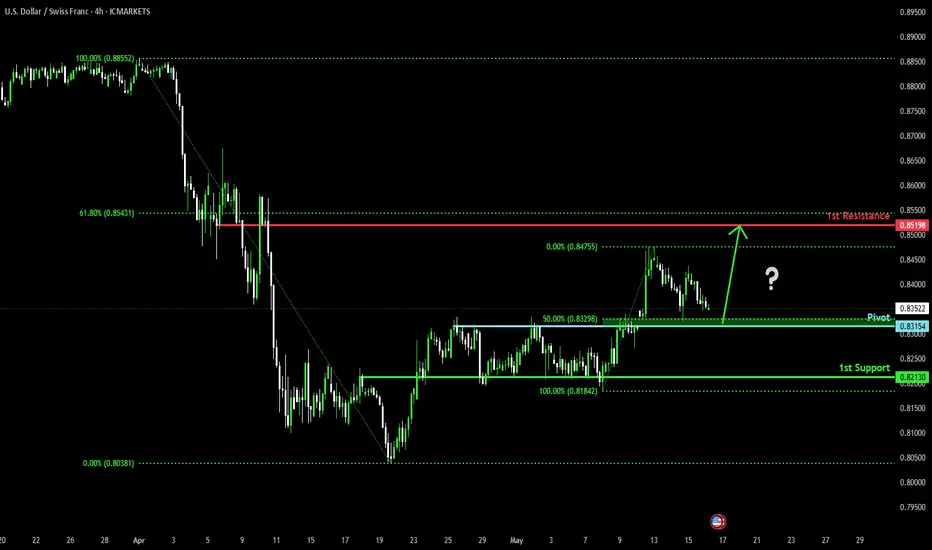
Bullish bounce off pullback support?The Swissie (USD/CHF) is falling towards the pivot which aligns with the 50% Fibonacci retracement and could bounce to the 1st resistance, which is also a pullback resistance.
Pivot: 0.8315
1st Support: 0.8213
1st Resistance: 0.8519
Risk Warning:
Trading Forex and CFDs carries a high level of risk to your capital and you should only trade with money you can afford to lose. Trading Forex and CFDs may not be suitable for all investors, so please ensure that you fully understand the risks involved and seek independent advice if necessary.
Disclaimer:
The above opinions given constitute general market commentary, and do not constitute the opinion or advice of IC Markets or any form of personal or investment advice.
Any opinions, news, research, analyses, prices, other information, or links to third-party sites contained on this website are provided on an "as-is" basis, are intended only to be informative, is not an advice nor a recommendation, nor research, or a record of our trading prices, or an offer of, or solicitation for a transaction in any financial instrument and thus should not be treated as such. The information provided does not involve any specific investment objectives, financial situation and needs of any specific person who may receive it. Please be aware, that past performance is not a reliable indicator of future performance and/or results. Past Performance or Forward-looking scenarios based upon the reasonable beliefs of the third-party provider are not a guarantee of future performance. Actual results may differ materially from those anticipated in forward-looking or past performance statements. IC Markets makes no representation or warranty and assumes no liability as to the accuracy or completeness of the information provided, nor any loss arising from any investment based on a recommendation, forecast or any information supplied by any third-party.
USD_CHF LOCAL BULLISH BIAS|LONG|
✅USD_CHF is making a local
Bearish correction and will
Soon retest a horizontal
Support of 0.8320 from where
We will be expecting a
Local bullish rebound
And a move up
LONG🚀
✅Like and subscribe to never miss a new idea!✅
Disclosure: I am part of Trade Nation's Influencer program and receive a monthly fee for using their TradingView charts in my analysis.
USDCHF LONG FORECAST Q2 W20 D15 Y25USDCHF LONG FORECAST Q2 W20 D15 Y25
Professional Risk Managers👋
Welcome back to another FRGNT chart update📈
Diving into some Forex setups using predominantly higher time frame order blocks alongside confirmation breaks of structure.
Let’s see what price action is telling us today!
💡Here are some trade confluences📝
✅Weekly order block rejection
✅Daily order block rejection
✅15’ order block
✅Intraday bullish breaks of structure
🔑 Remember, to participate in trading comes always with a degree of risk, therefore as professional risk managers it remains vital that we stick to our risk management plan as well as our trading strategies.
📈The rest, we leave to the balance of probabilities.
💡Fail to plan. Plan to fail.
🏆It has always been that simple.
❤️Good luck with your trading journey, I shall see you at the very top.
🎯Trade consistent, FRGNT X

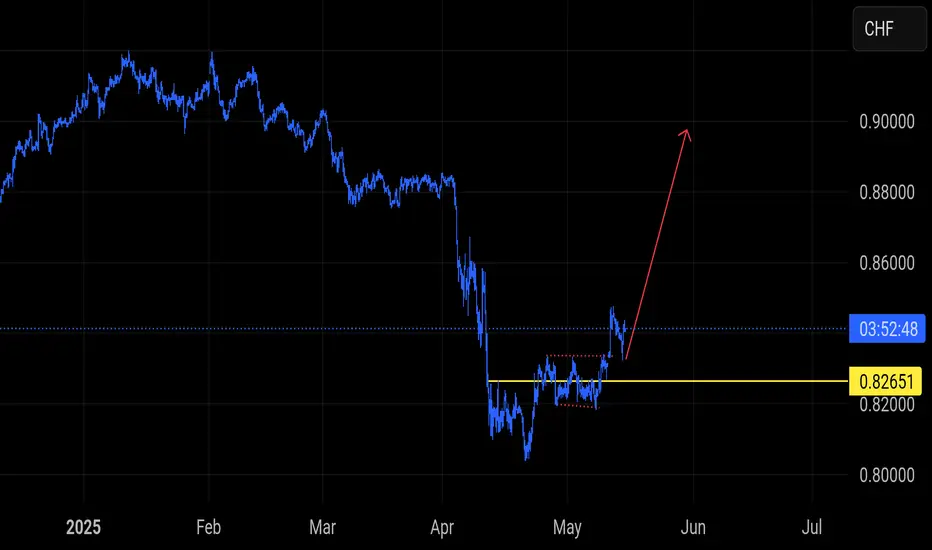
USDCHF Breakout in Progress – Reversal from Key Support?#USDCHF
**Pair:** USDCHF
**Current Price:** ~0.8265
**Bias:** Bullish
---
**Analysis:**
USDCHF appears to be forming a **base structure near the 0.8265 level**, where buyers are gradually stepping in. The price has broken above a short-term consolidation zone (highlighted in red) and is now attempting to push higher.
This move suggests a potential **reversal from the recent downtrend**, especially if the price holds above the **0.8265 key support**. A successful breakout and retest scenario could propel USDCHF toward the **0.8600** and even **0.9000** levels.
---
**Technical Highlights:**
- **Support Level:** 0.8265 (established demand zone)
- **Breakout Pattern:** Consolidation breakout
- **Upside Target Zones:** 0.8600 and 0.9000
- **Invalidation:** Close below 0.8265
---
**Trade Idea (Not Financial Advice):**
Watch for a bullish retest above 0.8265 for continuation plays. Confirmation with bullish momentum may open the path to medium-term upside targets.
---
> **Disclaimer:**
> This content is for educational purposes only and does not constitute financial advice. Always perform your own analysis and manage your risk carefully. Trading involves substantial risk and is not suitable for every investor.
USDCHF Short Term Buy Trade Update!!!Hi Traders, on April 24th I shared this idea "USDCHF - Expecting Bullish Continuation In The Short Term"
I expected further continuation higher from the marked Fibonacci support zones. You can read the full post using the link above.
Price reached the first Fibonacci support zone, respected it and bounced higher as expected!!!
If you enjoy this idea, don’t forget to LIKE 👍, FOLLOW ✅, SHARE 🙌, and COMMENT ✍! Drop your thoughts and charts below to keep the discussion going. Your support helps keep this content free and reach more people! 🚀
-------------------------------------------------------------------------------------------------------------------
Disclosure: I am part of Trade Nation's Influencer program and receive a monthly fee for using their TradingView charts in my analysis.

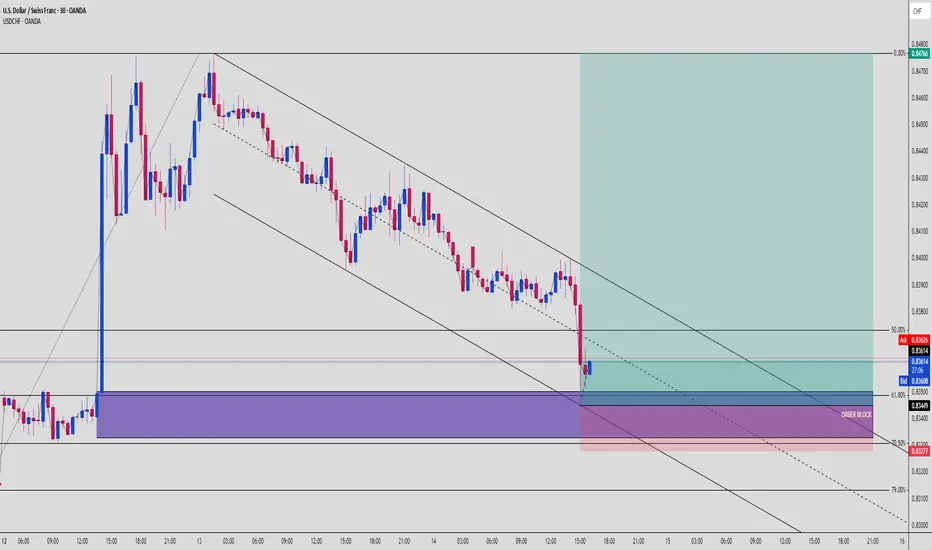
USDCHF 30min | Fibonacci + Order Block Combo Reversal Setup💵 USDCHF 30-Min Smart Money Breakdown — May 14, 2025
This is a prime example of a multi-confluence reversal trade. Let’s walk through this sniper setup:
🔍 1. Market Structure & Context
Price has been flowing within a solid descending channel
We just witnessed a sharp impulse leg downward, now reacting from a key demand area
Channel bottom + OB + fib = confluence stacker heaven
🧱 2. Zone Confluence
Price taps into a high-probability Order Block (highlighted purple)
Lining up with the 61.8% fib retracement, one of the most powerful golden pockets
Immediate reaction seen with bullish wick rejection — evidence of smart money stepping in
📈 3. Entry Logic
Entry: Around 0.83350
SL: Below 0.83200 (protected under 70.5%)
TP: Near 0.84700
RRR ≈ 1:5+ — perfect for prop firm funded traders or swing-style scalpers
🔁 Management & Outlook
Key confirmation = break above midline channel
Scale out at 0.83700 (50% fib), then trail SL for runners
If price rolls back under 0.83200, it may seek the 79% or deeper liquidity zone
💡This type of setup is what separates reactive traders from anticipatory Smart Money traders. You’re not chasing—you're waiting in the kill zone.
💬 Comment “🔥” if you’d take this setup.
🔁 Repost if you love OB + Fib sniper logic.
📲 Follow @ChartNinjas88 for next-level breakdowns.
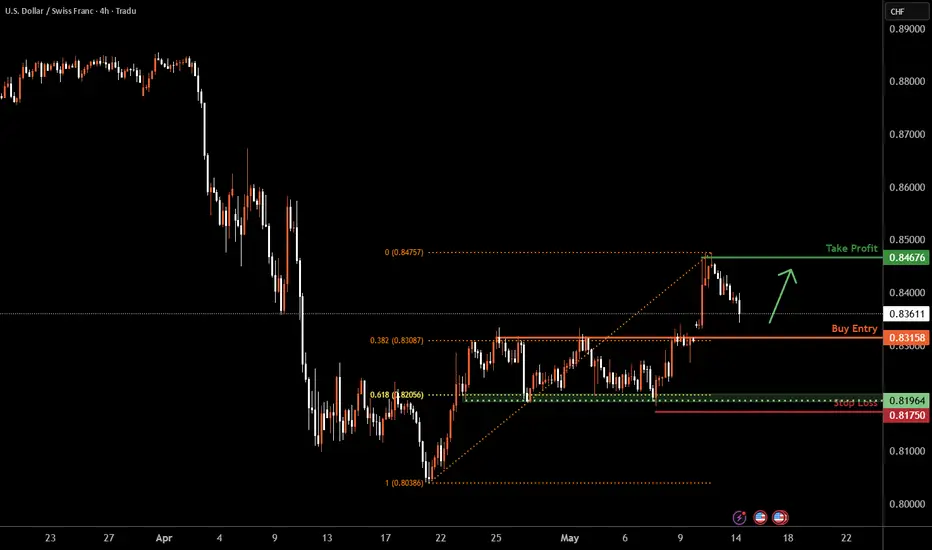
USD/CHF H4 | Falling toward a pullback supportUSD/CHF is falling towards a pullback support and could potentially bounce off this level to climb higher.
Buy entry is at 0.8315 which is a pullback support that aligns with the 38.2% Fibonacci retracement.
Stop loss is at 0.8175 which is a level that lies underneath a multi-swing-low support and the 61.8% Fibonacci retracement.
Take profit is at 0.8467 which is a swing-high resistance.
High Risk Investment Warning
Trading Forex/CFDs on margin carries a high level of risk and may not be suitable for all investors. Leverage can work against you.
Stratos Markets Limited (tradu.com):
CFDs are complex instruments and come with a high risk of losing money rapidly due to leverage. 63% of retail investor accounts lose money when trading CFDs with this provider. You should consider whether you understand how CFDs work and whether you can afford to take the high risk of losing your money.
Stratos Europe Ltd (tradu.com):
CFDs are complex instruments and come with a high risk of losing money rapidly due to leverage. 63% of retail investor accounts lose money when trading CFDs with this provider. You should consider whether you understand how CFDs work and whether you can afford to take the high risk of losing your money.
Stratos Global LLC (tradu.com):
Losses can exceed deposits.
Please be advised that the information presented on TradingView is provided to Tradu (‘Company’, ‘we’) by a third-party provider (‘TFA Global Pte Ltd’). Please be reminded that you are solely responsible for the trading decisions on your account. There is a very high degree of risk involved in trading. Any information and/or content is intended entirely for research, educational and informational purposes only and does not constitute investment or consultation advice or investment strategy. The information is not tailored to the investment needs of any specific person and therefore does not involve a consideration of any of the investment objectives, financial situation or needs of any viewer that may receive it. Kindly also note that past performance is not a reliable indicator of future results. Actual results may differ materially from those anticipated in forward-looking or past performance statements. We assume no liability as to the accuracy or completeness of any of the information and/or content provided herein and the Company cannot be held responsible for any omission, mistake nor for any loss or damage including without limitation to any loss of profit which may arise from reliance on any information supplied by TFA Global Pte Ltd.
The speaker(s) is neither an employee, agent nor representative of Tradu and is therefore acting independently. The opinions given are their own, constitute general market commentary, and do not constitute the opinion or advice of Tradu or any form of personal or investment advice. Tradu neither endorses nor guarantees offerings of third-party speakers, nor is Tradu responsible for the content, veracity or opinions of third-party speakers, presenters or participants.
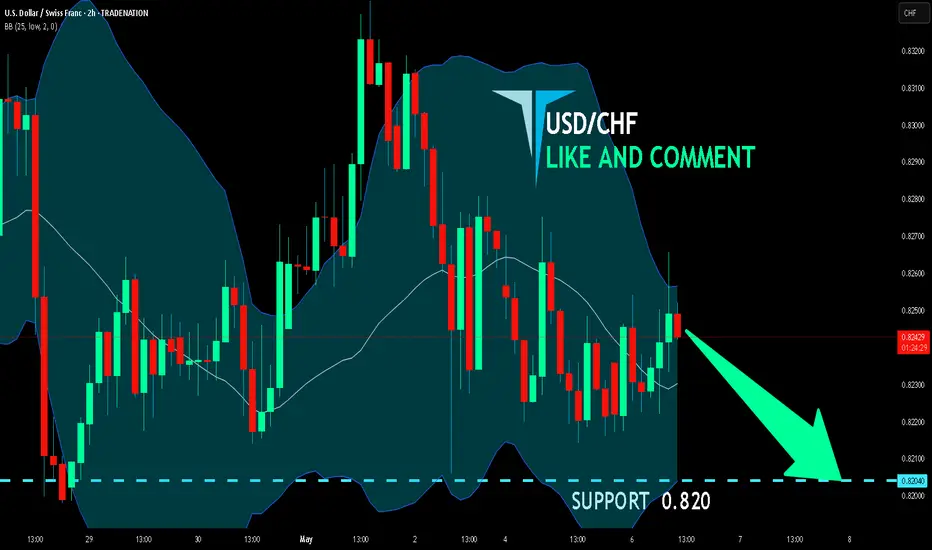
USD/CHF BEARS WILL DOMINATE THE MARKET|SHORT
Hello, Friends!
It makes sense for us to go short on USD/CHF right now from the resistance line above with the target of 0.820 because of the confluence of the two strong factors which are the general downtrend on the previous 1W candle and the overbought situation on the lower TF determined by it’s proximity to the upper BB band.
Disclosure: I am part of Trade Nation's Influencer program and receive a monthly fee for using their TradingView charts in my analysis.
✅LIKE AND COMMENT MY IDEAS✅