USDJPY - Detailed Video AnalysisHello everyone, if you like the idea, do not forget to support with a like and follow.
Here is the top-down analysis for USDJPY, feel free to request any pair/instrument or ask any questions in the comment section below.
Best of luck!
Usdjpy-bullish

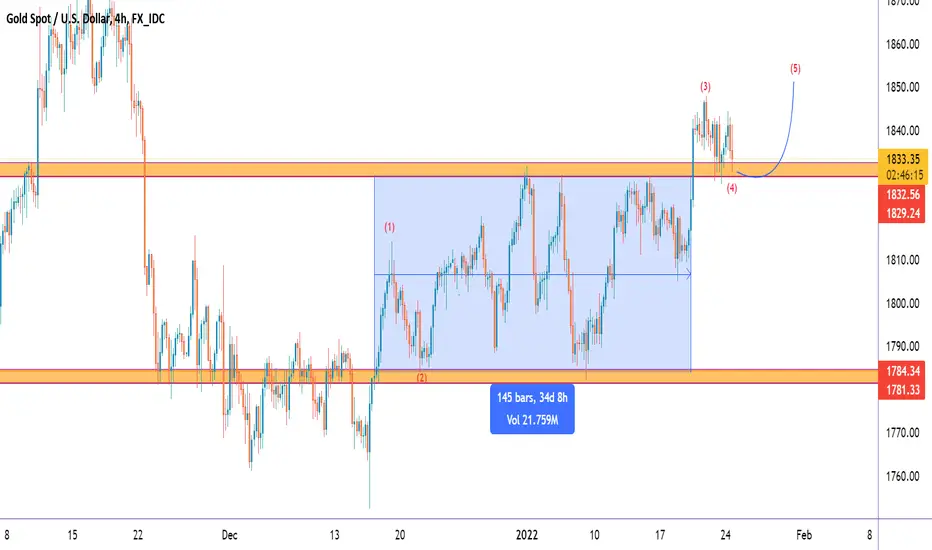
GOLD LONG TO 1850Gold has been in a uptrend all this time and it still is. Currently bullish momentum is slowing now indicating a correction is due soon. Expecting one more final wave (Wave 5) towards 1850 to complete the Elliot Wave Theory.
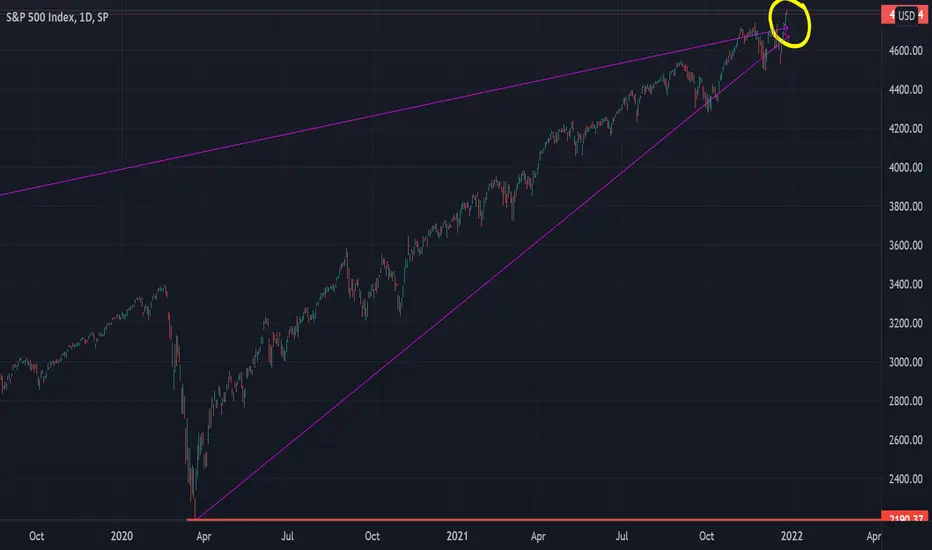
SPX us500 s&p 500 Great news and great upside potential.
What will 2022 bring us, yesterday marked new historical highs breaking the channel that had been marked since 2020.
A cordial greeting.
In Spain on 12/28/2021 L.E.D.
Wish you all the best and a happy New Year
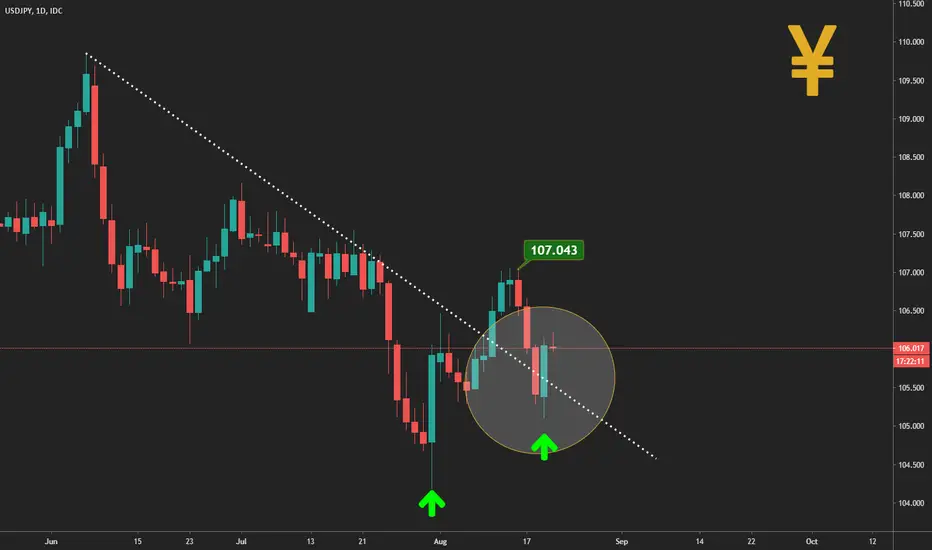
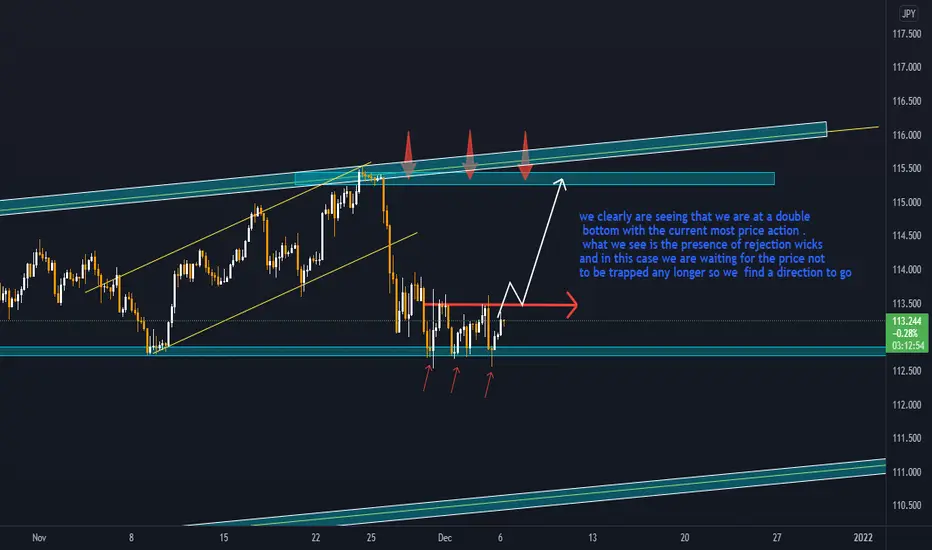
USDJPY . BULLS !! we clearly are seeing that we are at a double bottom with the current most price action . what we see is the presence of rejection wicks and in this case we are waiting for the price not to be trapped any longer so we find a direction to go.
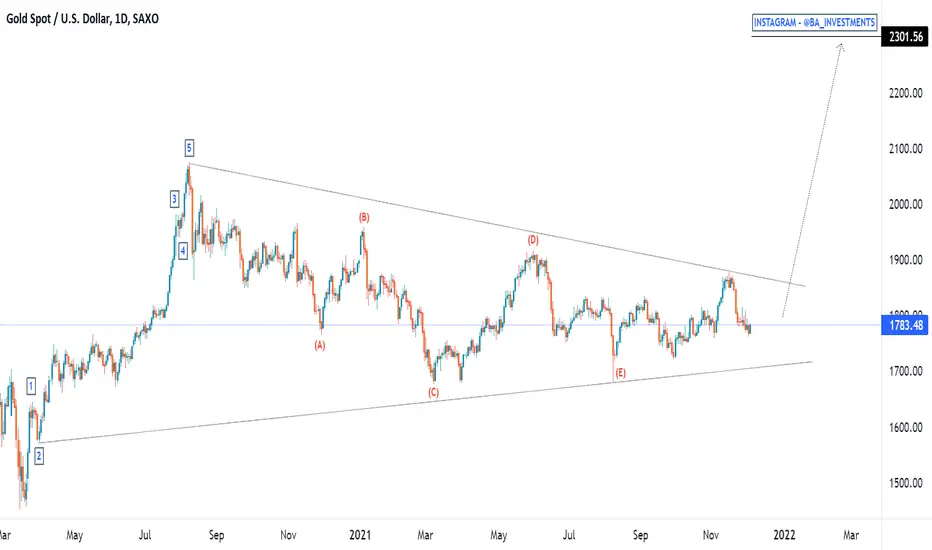
XAUUSD LONG TO $2300 (ALTERNATIVE SCENARIO)As many of you who follow me, know by now I am short on Gold down to 1570 long term as my main bias. I have even uploaded the analysis on my page which you can go back on see. However, this here is an alternative analysis and has a likely chance of coming into play. After last years strong bullish momentum, Gold has spent most of this year within a correction phase which now seems to be complete according to the Elliot Wave Theory.
Gold is now in it's final stages before making its next big move. I am expecting one more micro push down on Gold towards the 1745-1735 price, before we see Gold start pushing back up again. Don't forget, this is an ALTERNATIVE to my Gold short analysis. I am still holding both my long (1742) and short (1870) positions hedged against each other, in accordance to all the previous analysis I have uploaded on my page (feel free to go check them out).
I will be catching this move on behalf of myself & my Account Management investors within my private fund. Drop a like and follow if you would like to see more analysis uploaded.
Next Week Analyze, USDJPY, Bullish 🇺🇸 🇯🇵 We anticipate bullish movement for USDJPY for next week.
TP ~ 110.800
SL ~ 109.400
usdjpy bullish oppertunitybullish trend. daily fib ext not hit yey. possible 1hr brak of counter trendline. entry and hold
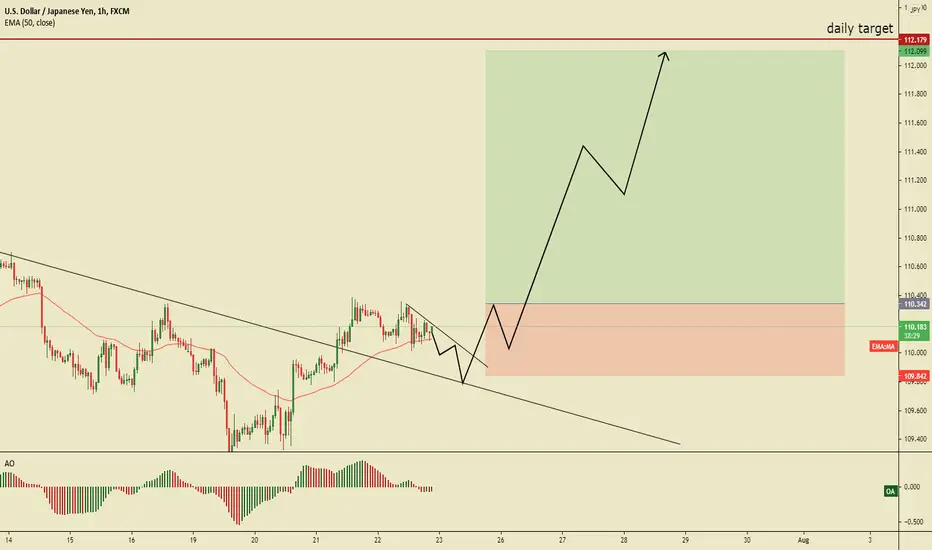
UJ Looking for next impulseBased on wave analysis. We should see UJ give a push to the upside to end this current corrective state. The next impulse should be strong but we still might make another Jab to the downside which is why I set a limit order on 50% fib and will add another position via a buy stop on the break of the recent high in case we dont get the Jab.
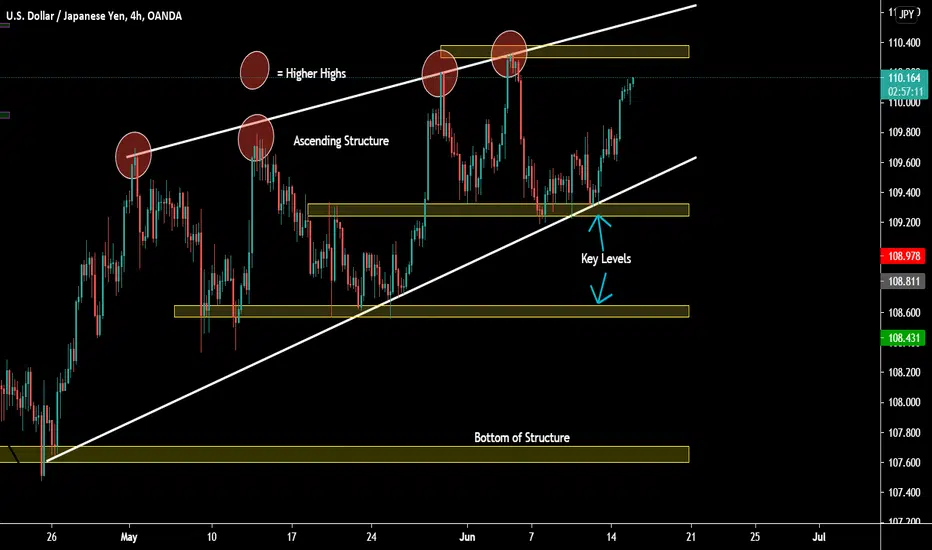
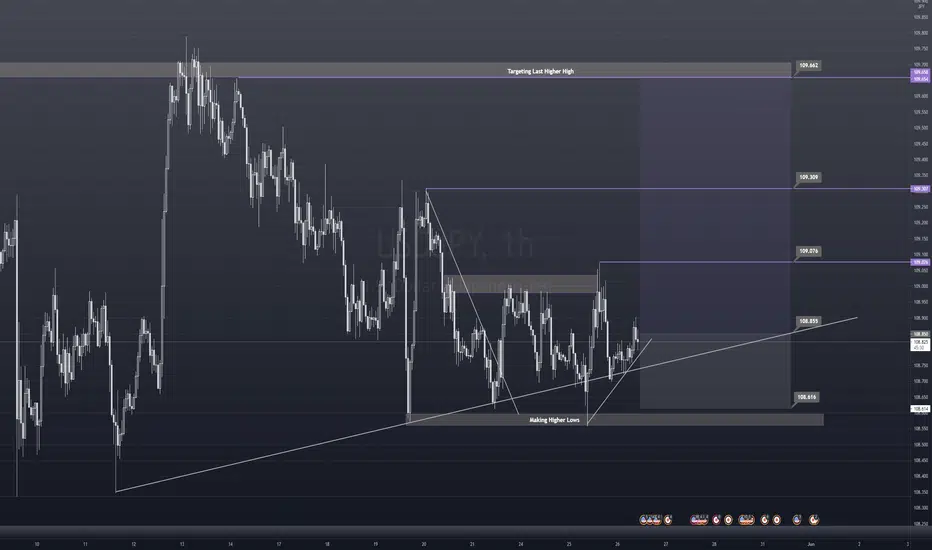
USD/JPY - Ascending Structure - Bullish MomentumHere we can clearly see higher lows and higher highs forming, creating this ascending structure marked by the white trendlines.
Key levels have been marked, including the bottom and top of current structure.
We have seen some strong bullish pressure of recent times on this pair.
Where will price head next? Drop your predictions in the comments!
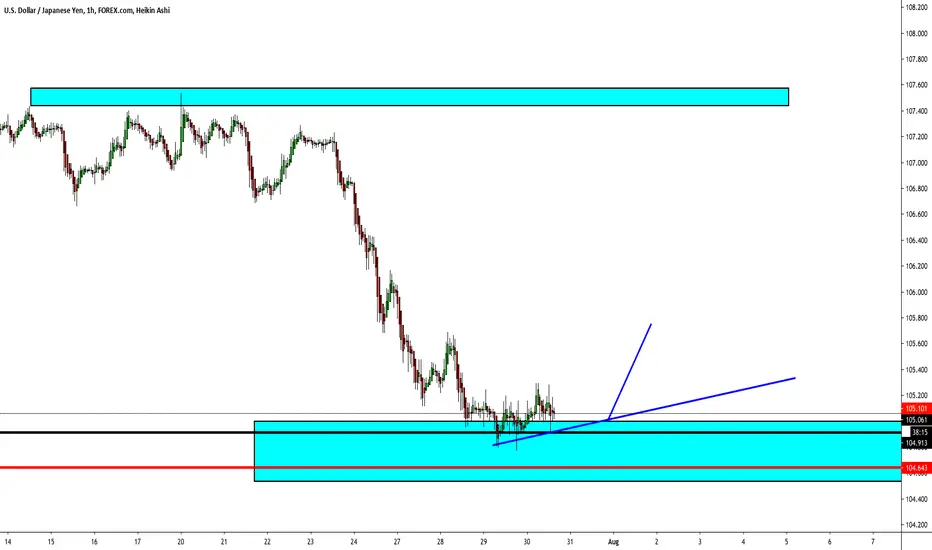
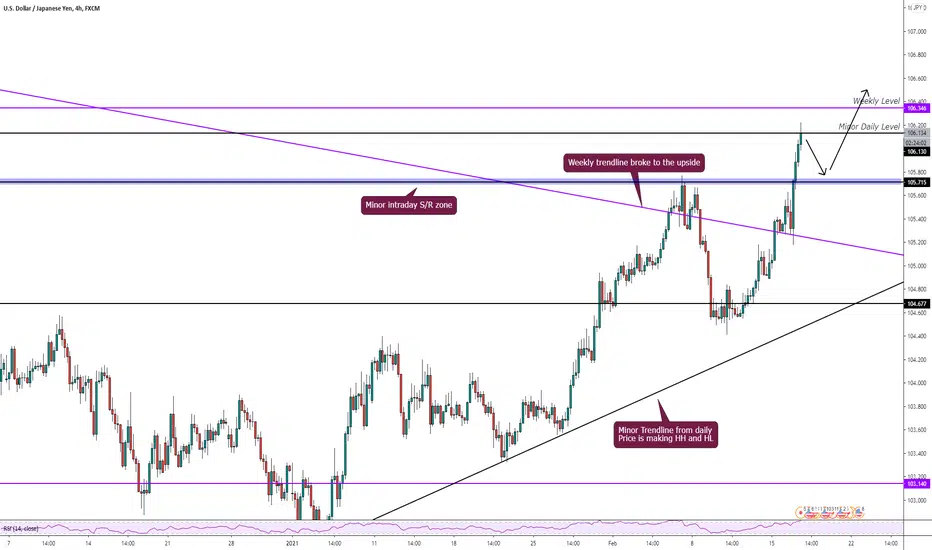
USD/JPY Finally Broke the RangeGood morning, traders! Today we will analyze USD / JPY in three timeframes to show you our bullish vision in depth.
We are going to carry out an analysis from highest to lowest. We will start with the highest timeframe (Weekly), and we will go down to 8H.
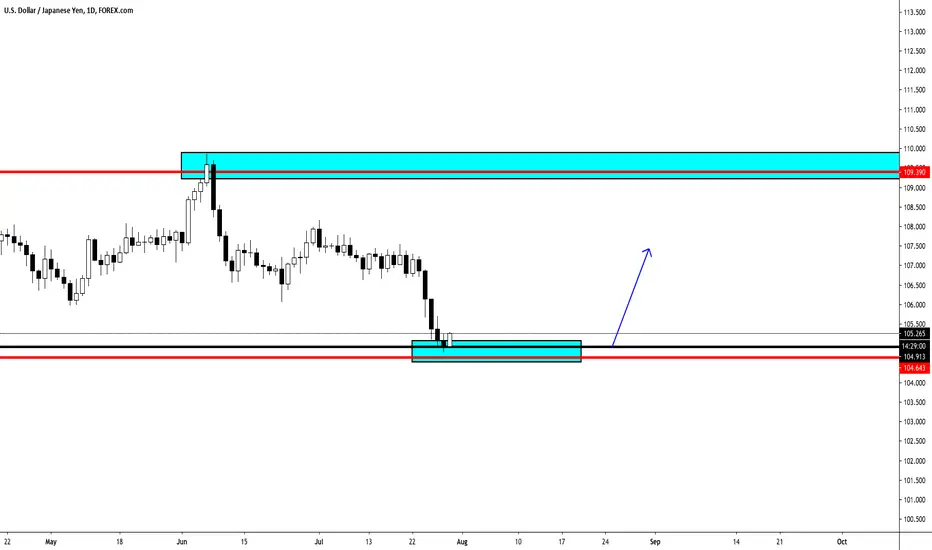
Weekly Chart:
🔸Here we can see how the price managed to penetrate the Descending Trendline that was in force for more than six years. After the break, it consolidated in the area for a few weeks, and now we see clear intentions for a bullish move. We go to the daily chart to see this behavior in more detail.
Daily Chart:
🔸We can trace not only the throwback to the Descending Trendline, but it also coincides with the bullish channel. This double confirmation gives greater security to the setup.
🔸These two timeframes provide valuable information about the price context, but we need more precise information to take a trade. That is why the main timeframe is 8H (published in the idea).
🔸In this timeframe, we see clearly within the bullish channel. After correcting for a few weeks and staying in a kind of range, the price yesterday was able to break the corrective structure with a bullish force. We consider that there is bullish potential towards the next Resistance zone (previous high).
USDJPY IDEADo your own analysis ...
Dont Forget Moving Stop-loss At Break-even
Disclaimer!
This post does not provide financial advice. It is for educational purposes only! You can use the information from the post to make your own trading plan for the market. You must do your own research and use it as the priority. Trading is risky, and it is not suitable for everyone. Only you can be responsible for your trading.
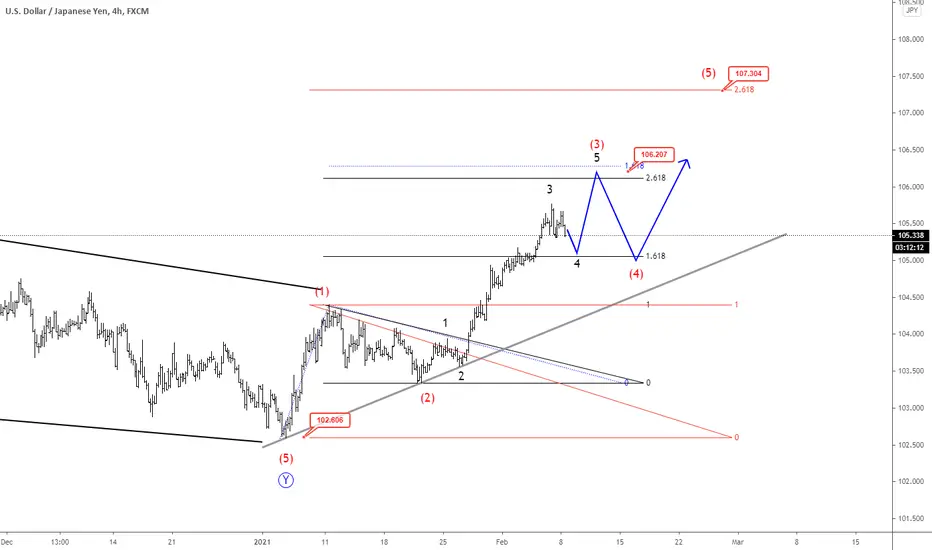
EW Analysis: USDJPY Remains Bullish Towards 2020 HighsHello traders!
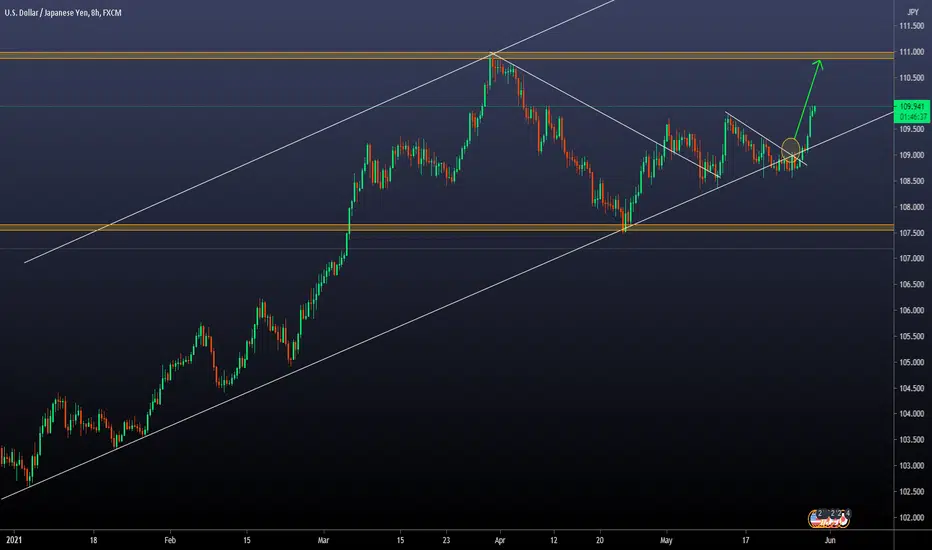
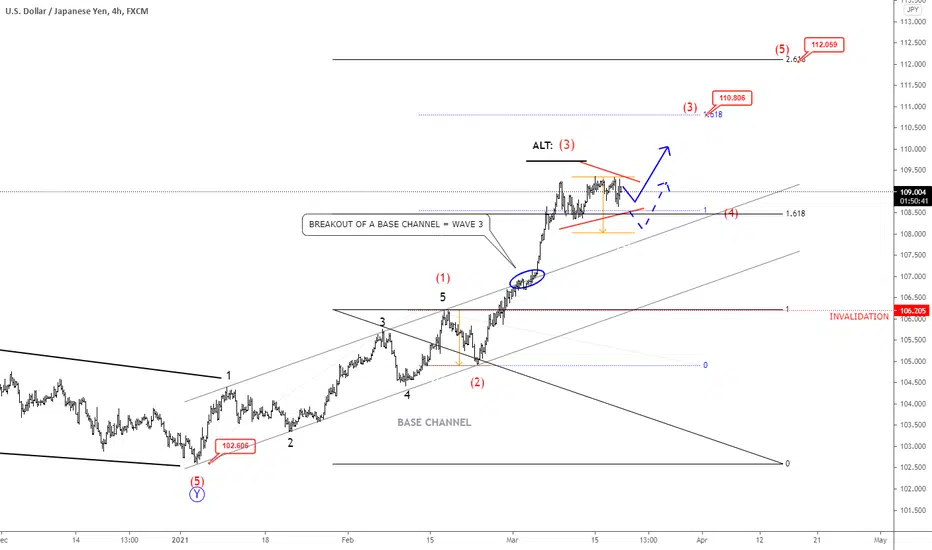
Today we want to update USDJPY chart, which is moving nicely bullish as we expected at the beginning of 2021 and seems like there's room for more gains towards 2020 highs as we see an unfinished five-wave cycle.
As you can see, USDJPY is in an impulsive move up, breaking even above base channel resistance line which suggests wave (3) of a five-wave cycle. So, more upside is in view towards projected Fibonacci 110.80 and 112 target levels, but probably once a current consolidation, ideally a correction in wave 4 fully unfolds. Wave 4 can be either a triangle or a flag pattern that can retest the base channel resistance line as a support before the uptrend resumes.
We remain bullish as long as the price is trading above 106.20 invalidation level.
Trade well and all the best!
If you like what we do, then please like and share the idea!
Disclosure: Please be informed that information we provide is NOT a trading recommendation or investment advice. All of our work is for educational purposes only.
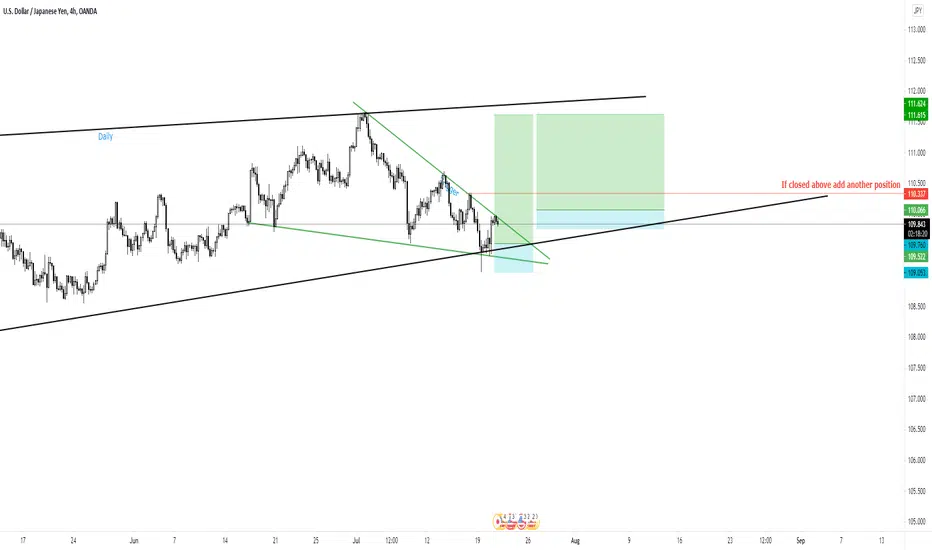
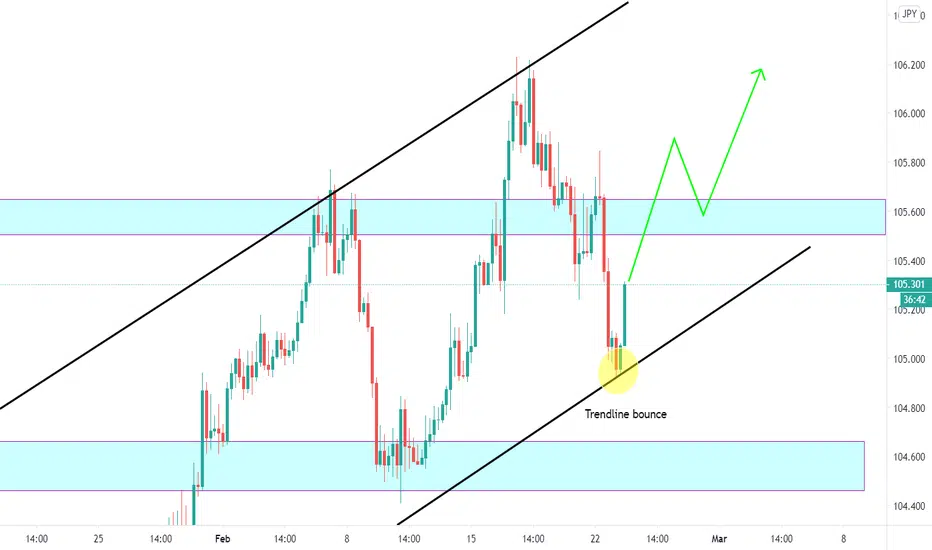
USD/JPY - Bullish cycle imminent? USD/JPY - 4HR Chart
We've seen a bounce off our long term ascending trendline. Bullish cycle upwards imminent? Will we see price follow our forecasted price path?
Do not use trendlines alone to take trades, however - they can be great to help you identify the trend on the HTF.
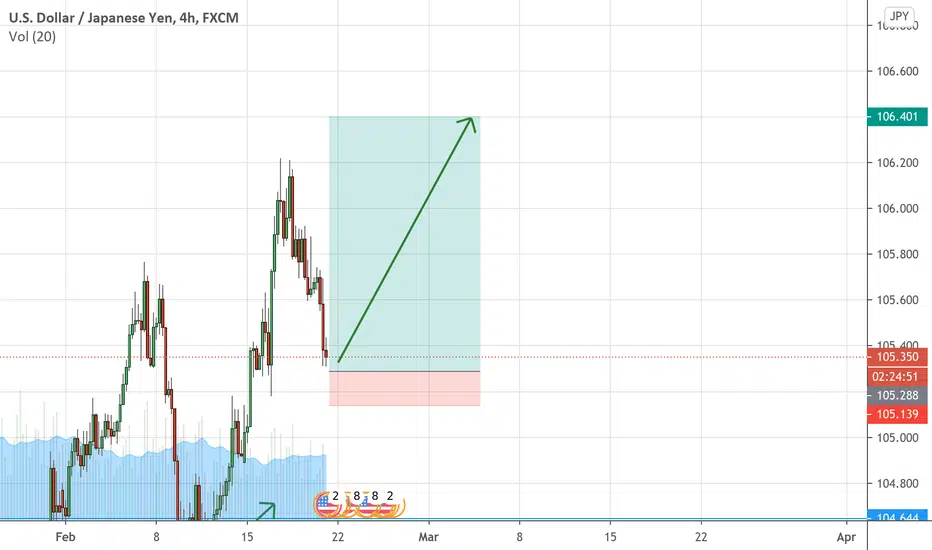
BUY USDJPYUSDJPY looking ripe, Entry for this buy at 105.337 . Our targets at 106.400 stop losses below 105.140
Use proper money management.
Tight stop losses as always
USDJPY Long TradeUSDJPY has strong bullish momentum, as it just broke the downtrend on the weekly.
I am waiting for a pullback with rejections before buying!
Hoping to see more bullish momentum after the pullback.
Feel free to let me know what you think! I would like to learn what you think!
USDJPY Update: Is It Turning Bullish Now?!Hello traders and investors!
USDJPY is nicely recovering after we noticed a completed ending diagonal and bottom formation at 102.60 lows. The price action looks strong and impulsive now, so seems like it's unfolding five waves up from the lows that can send the it even up to 106 - 107 area, just be aware of short-term wave 4 corrections, a lower degree and higher degree.
What we want to say is that as long as strong trendline connected from the lows and 104.00 level hold, we can expect more upside within a five-wave cycle.
Trade well!
If you like what we do, then please like and share our idea.
Disclosure: Please be informed that information we provide is NOT a trading recommendation or investment advice. All of our work is for educational purposes only.
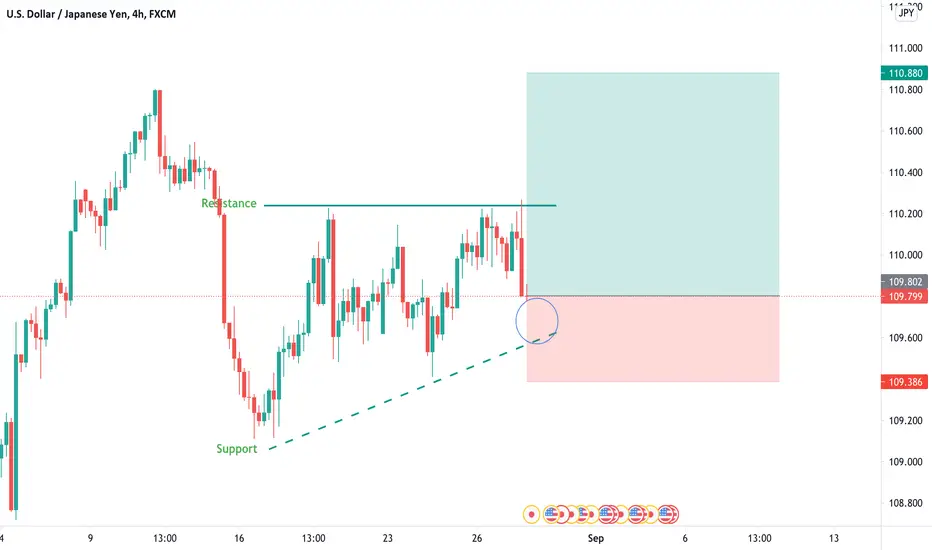
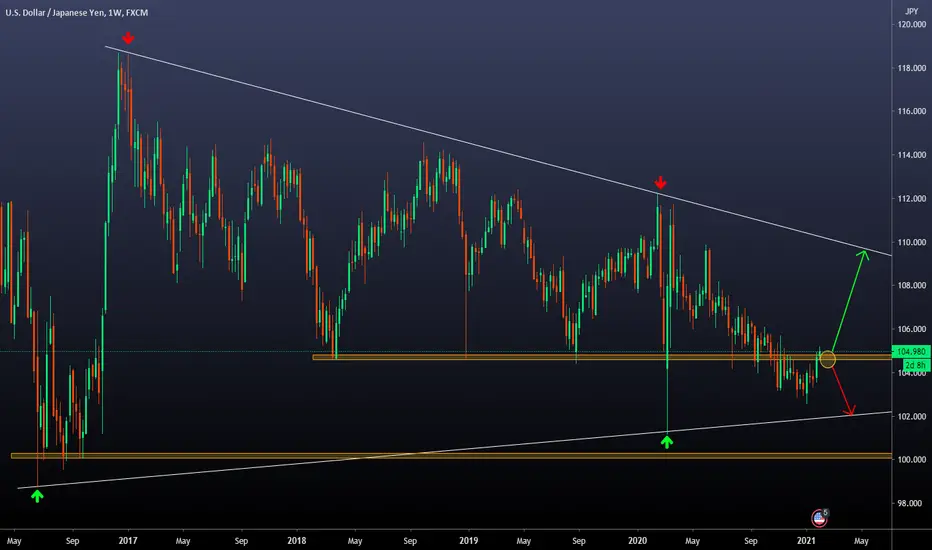
USD/JPY On a Critical ZoneGood morning traders, today we bring you our long-term analysis on the USD/JPY pair, as we consider that it is at a decisive point.
🔸The price is against a Resistance Zone where every time it is faced it has found some kind of reaction.
🔸At this moment, it is slightly above, so we could consider that it is entering the buying zone.
🔸If this move is confirmed, we could see strong bullish momentum over the next few months.
🔸The target of this movement is the long-term Descending Trendline, since it is before the nearest supply zone.
🔸And, finally, in case the price fails to confirm the rise and heads in a bearish direction, the target is the Ascending Trendline.
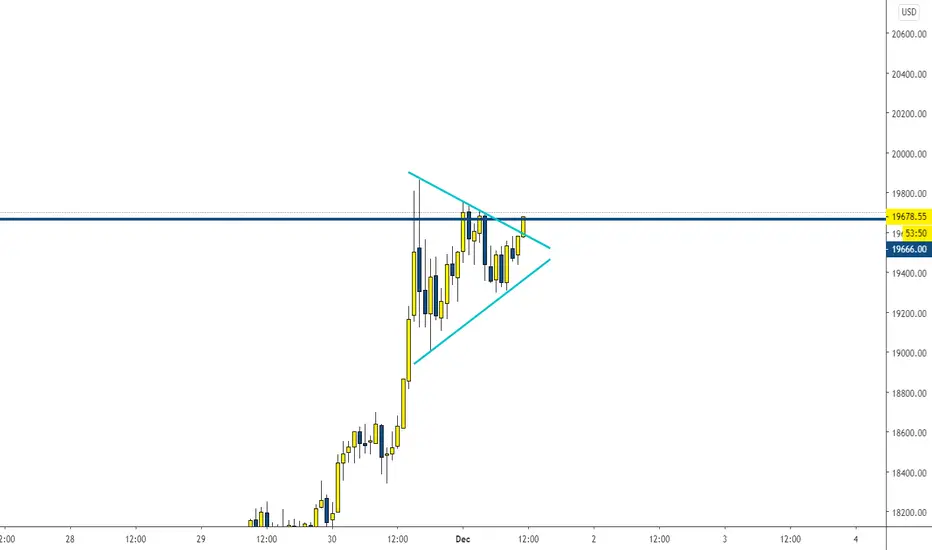
BTC bullish continuation above ATHBitcoin is holding firmy below ATH forming a pennant. This is a further bullish confirmation for me, long term holding.
Open space next.
CHF/JPY HARMONICSCHF/JPY is making bullish signs with the rvi daily bullish cross and a harmonic bullish pattern at play. expect a strong move up on the daily chart.

USDJPY Long USD/JPY LOOK very bullish at this key level and its respected many times and the trend is bouncing after it so this week should be bullish for the JPY against the USD but the trend can go down till 102.320 cause on 22 september the existing home sales should be higher then expected for USA so its a bullish signal for USA .
Be careful ,Thank you.

Bullish engulfing Yesterday was interesting and with good movements.
This morning we are reviewing the daytime candles for turn signals and one of the options is USDJPY.
Here we have bullish engulfing, which is a signal of an expected rise in price. We expect buyers to be stronger than sellers in the next few days.
We found another very clear signal on the daily chart of one of the main pairs.
Indicate which is it in the comments.
Tomorrow we will analyze it.