Usdjpy-bullish
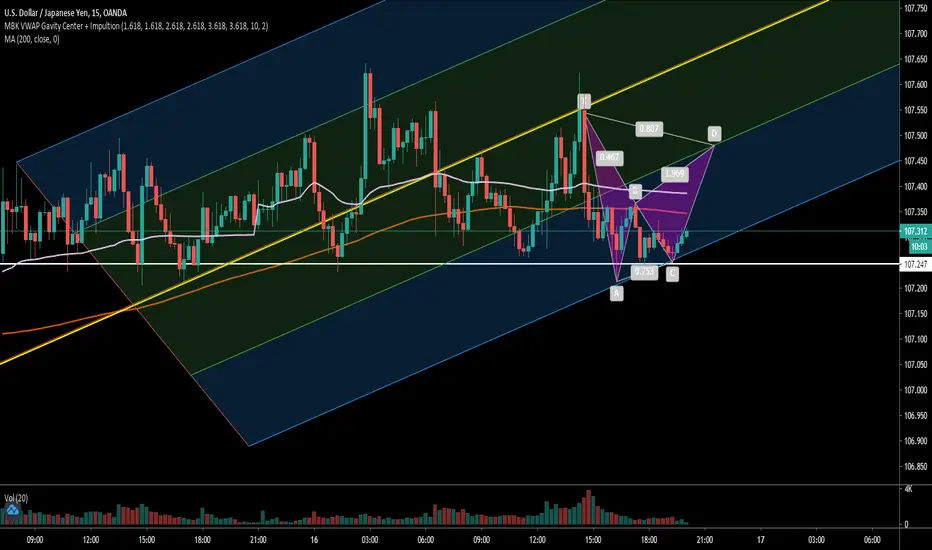
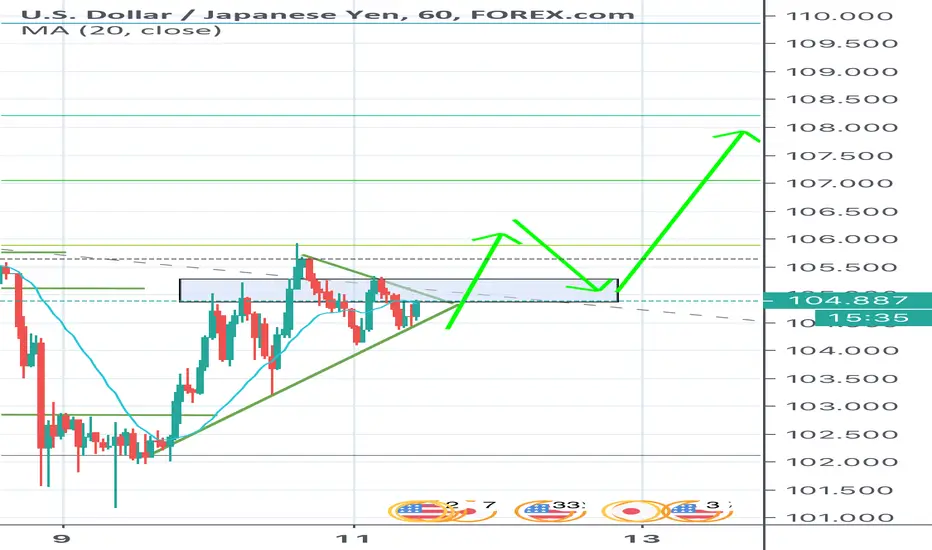
The Bull still have more stamina to fight the BearSo, hello guys and here we are again.
This is for the Forex community, i made this harmonic pattern with success and we can say that the market might go up with a strong probability
So stay tunned and when we will have the volume confirmation plus the breakout of the 200MA and the VWAP then the market will surely go up
Thanks for watching

GBPUSD Long setupGBPUSD has been riding the retracement level for a while now. Will probably wait for a slight pullback from yesterday before entering, unless a strong bullish candle forms in a lower timeframe.
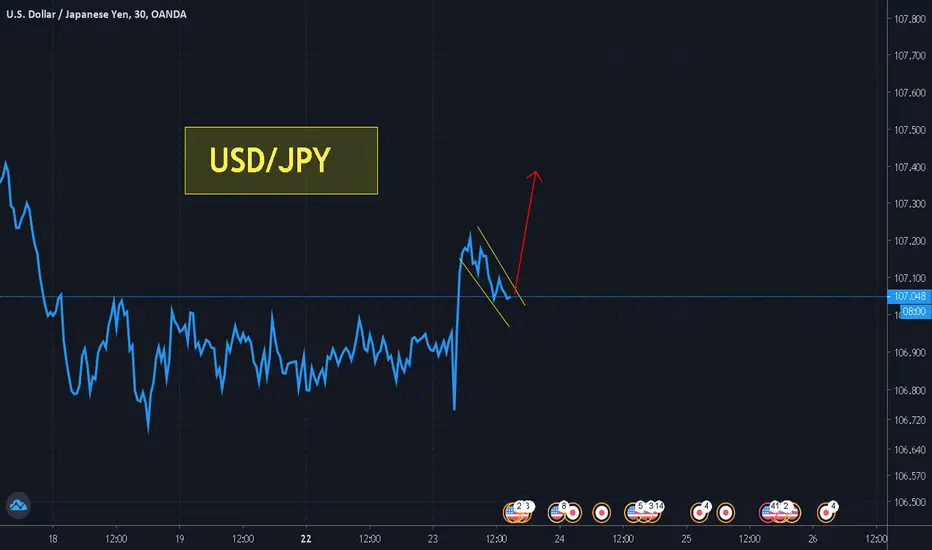
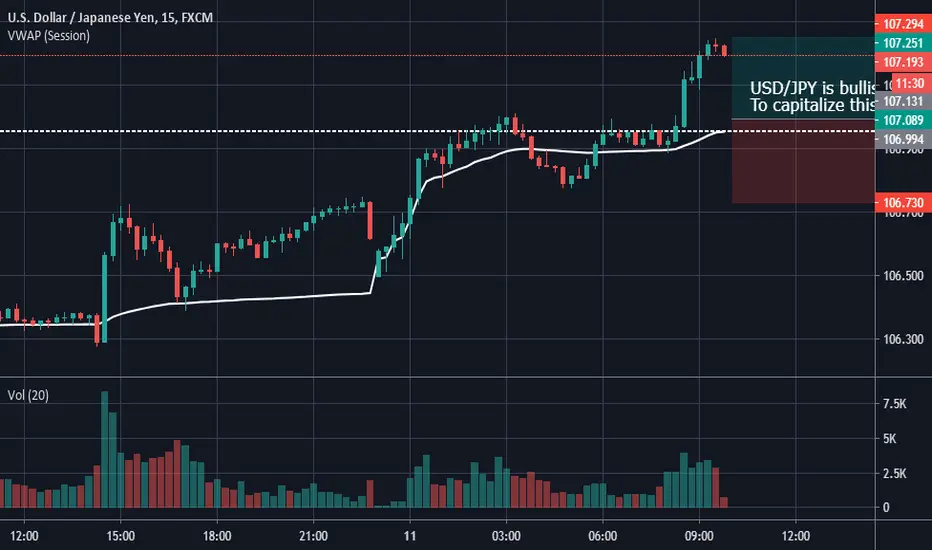
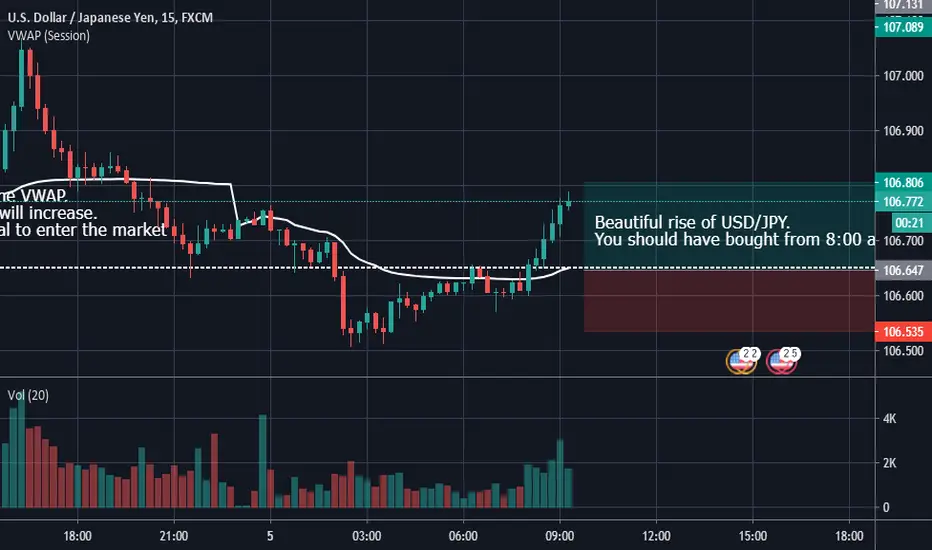
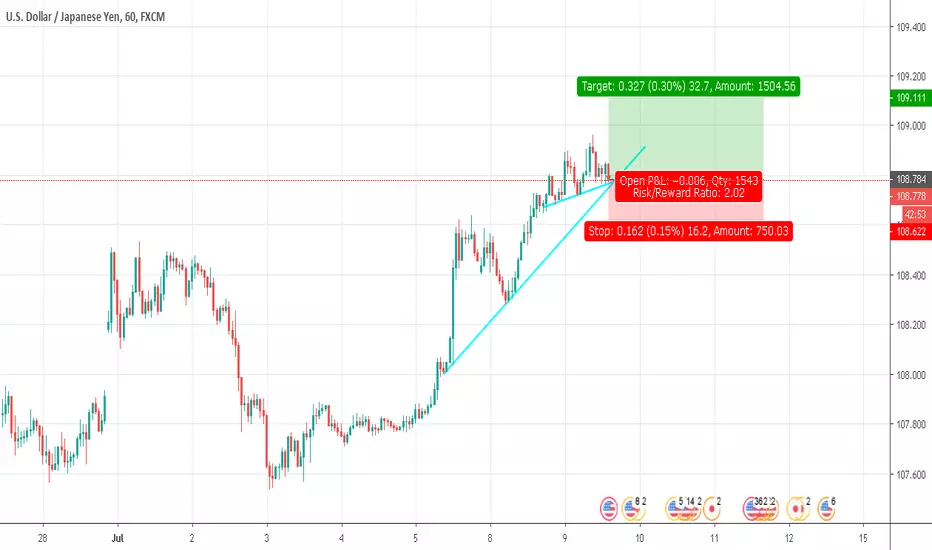
USD/JPY is bullishNow USD/JPY is about to correct itself.
If you missed its strong rise from 8:00 am this morning, don't stress yourself.
You probably get a second chance during the day.
USD/JPY to buy today.
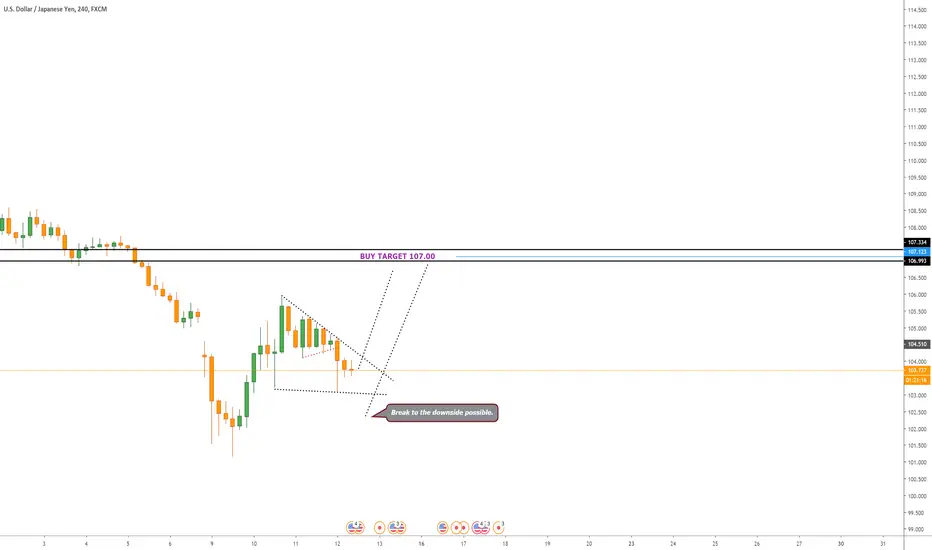
USDJPY 10th May 2020Hello Traders
What do you see in USDJPY?
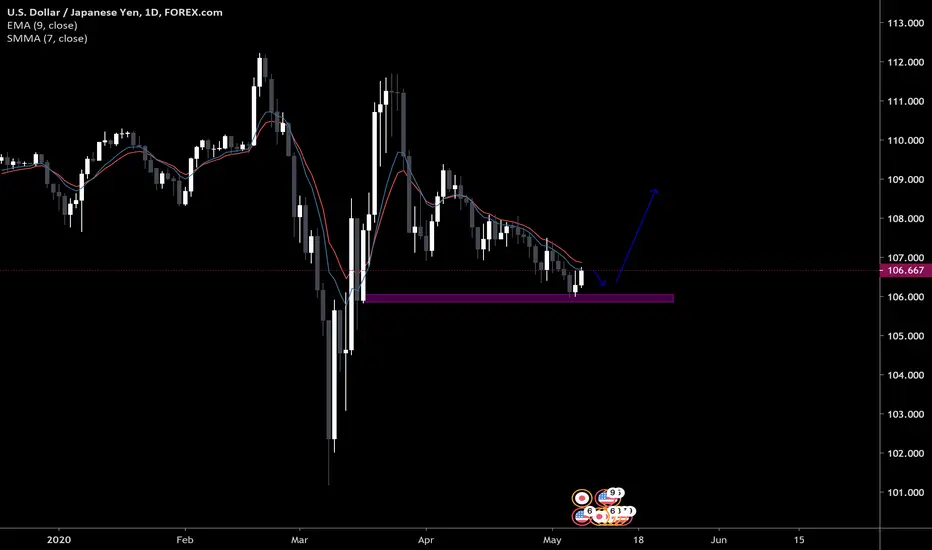
Here what I can see is a possible break to the upside.
On the weekly chart, using fibonacci I seen that on the most recent pulse the pair is now rejecting the 0.5 retracement area and moving up again.
I expect to see it retrace again to the support area before making a break to the upside.
Happy trading
Roo :)
Please remember I am a hobby trader, this is not financial advice and any losses or gains are your own!
Be sure to like and comment on the chart and follow me on trading view.
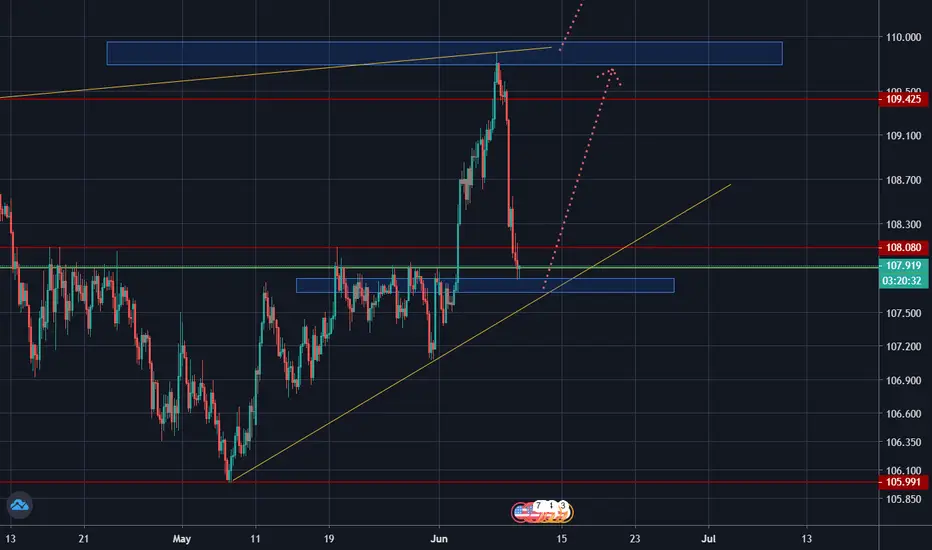
USD/JPY is bullishThere was a pretty rise of USD/JPY from 8: 00 am and which keeps going.
The market should correct itself after this.
USD/JPY to keep in Portfolio.
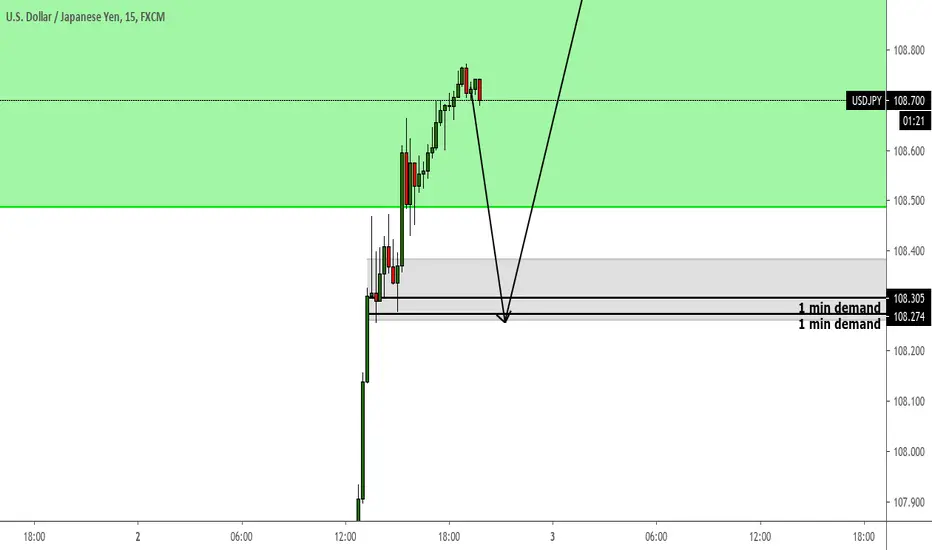
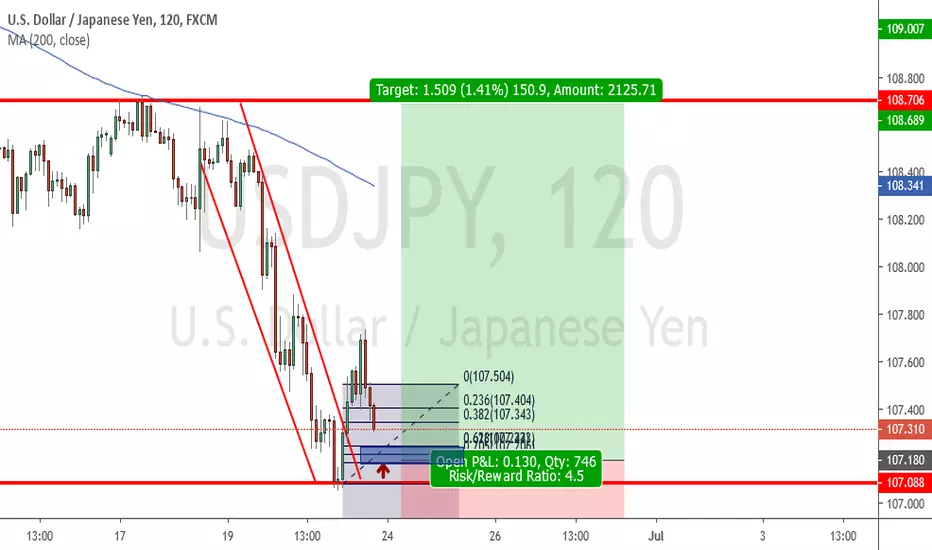
BUY | Possible Crab Forming#USDJPY - Tendency: Bullish
Observations -
i - Price has broken a trendline
ii - Possible Crab forming
iii - If Crab is forming, the D leg also coincides with a major key level and a major trendline above

USD JPY bulls breakout targetit has broken it months old symmetrical triangle. lets wait for sell target
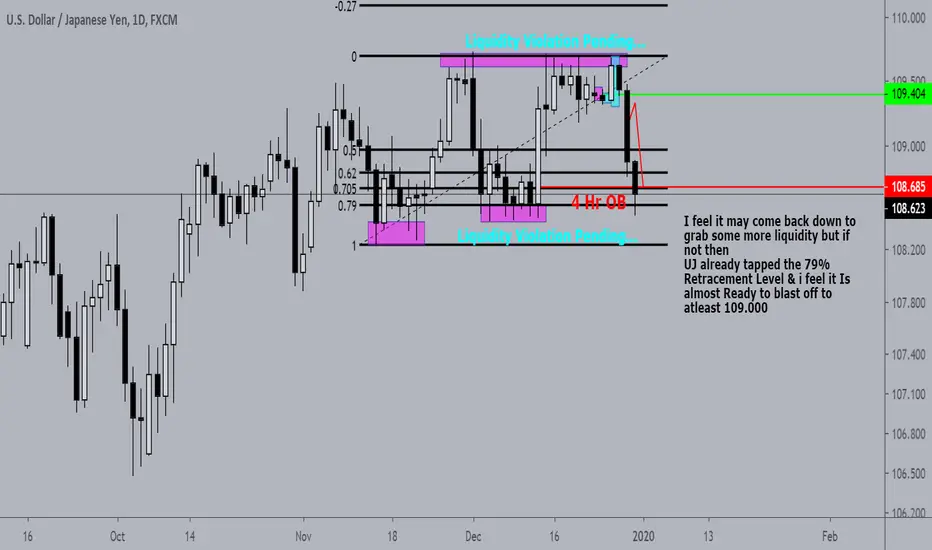
USDJPY Potential Buy Opportunity Based on my mark up, I feel it may come back down to grab some more liquidity but if not then
UJ already tapped the 79% Retracement Level & i feel it Is almost Ready to blast off! Let me know what you guys think!

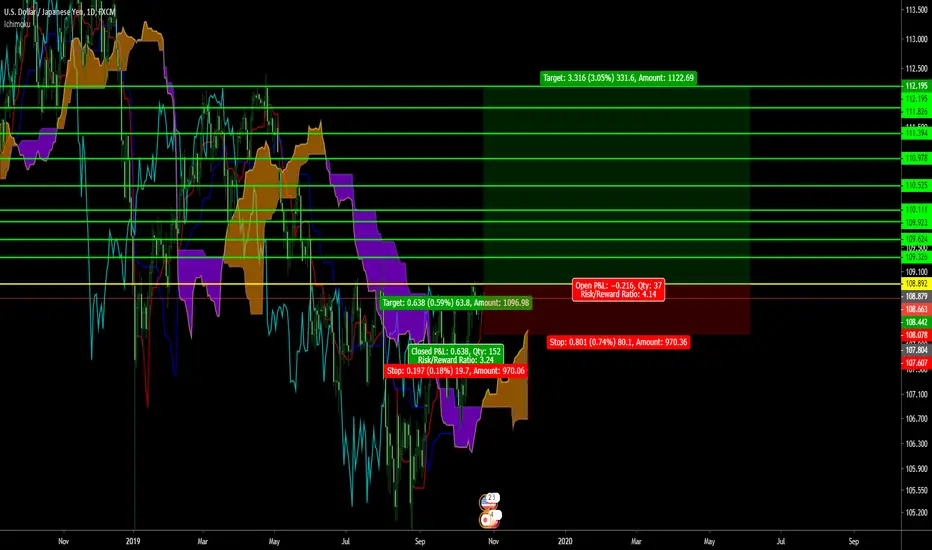
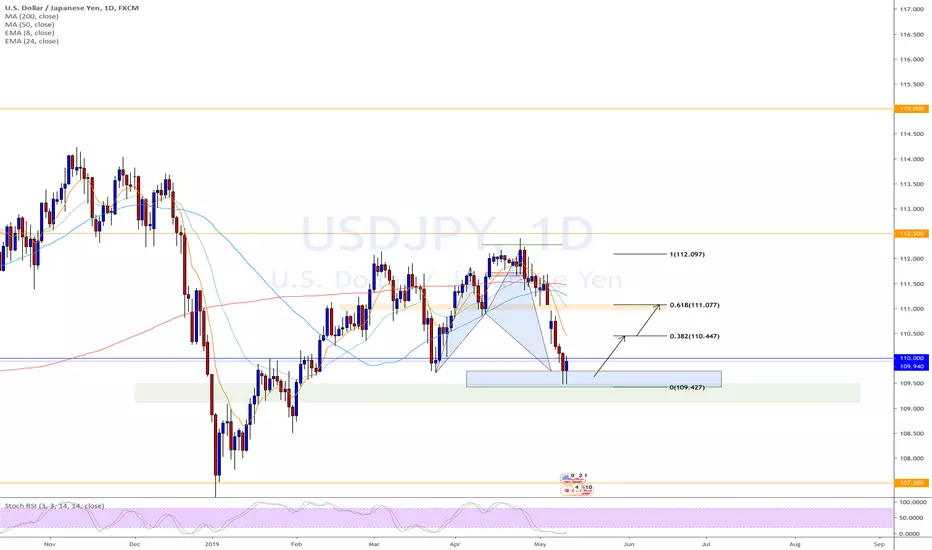
USD/JPY Ichimoku Swing Trade SetupWe're zooming out to the daily chart to look at this setup.
I am watching an important price structure level to be broken in order to help confirm that we have an established firm that will try and run bullishly for us.
I need to see a close above that level on at least the 4 hour to help confirm this bias.
I've drawn out several price structure targets on the way to our overall target but we'll be looking to grab some partial profit on the way and adding to our position at key levels.
IF we can't close above that resistance and maintain our bullish bias, this setup may become invalidated.
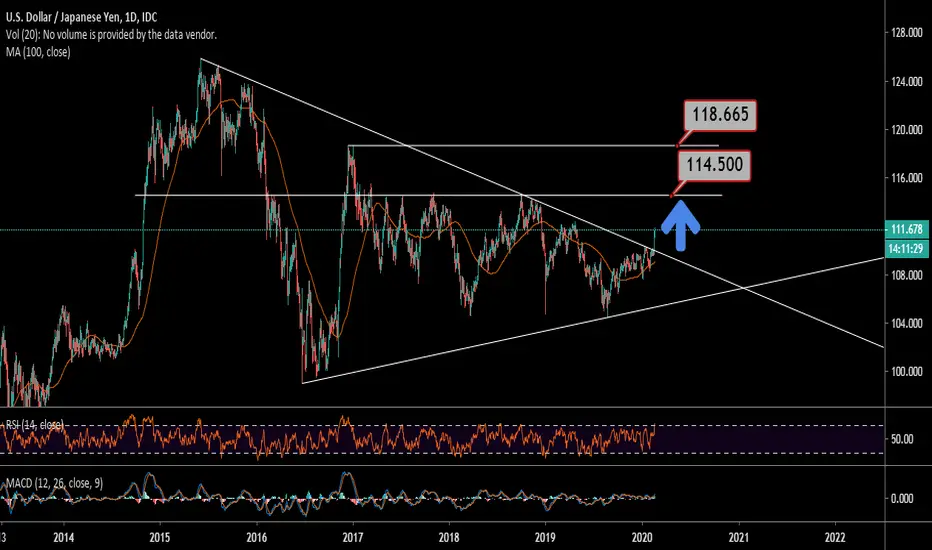
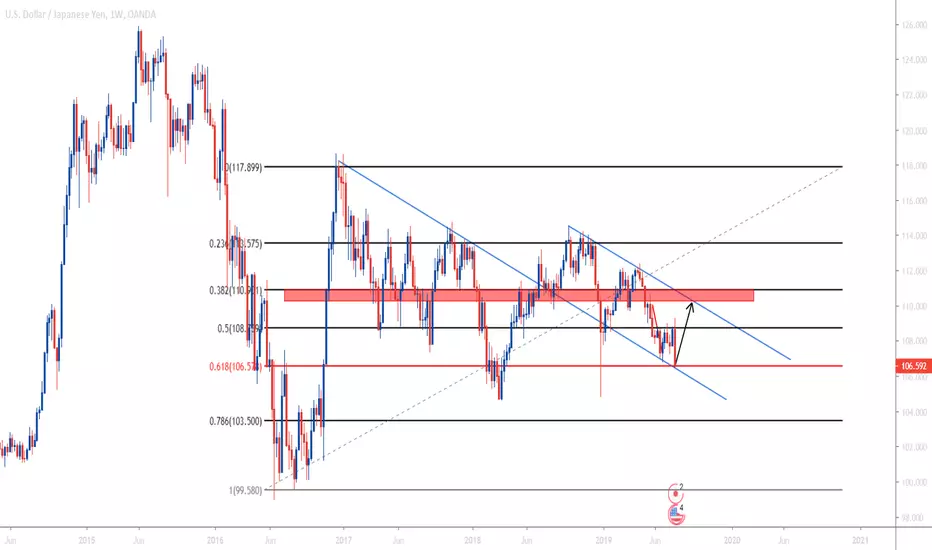
USDJPY WeeklyDonald Trump just made a bold statement on twitter. On his statement he mentioned:
Things are going along very well with China.
They are paying us Tens of Billions of Dollars,
made possible by their monetary devaluations and pumping in massive amounts of cash
to keep their system going. So far our consumer is paying nothing - and no inflation. No help from Fed!
This is a really bullish statement for the dollar and I would look forward to an upside fundamentally
Fundamental Wise: Bullish
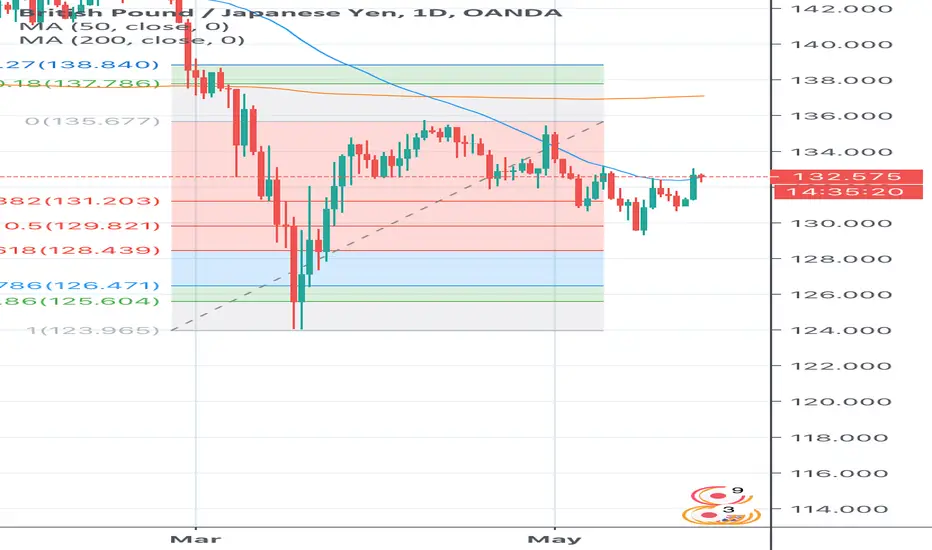
Technically, USDJPY is on a 61.8 Fibonnaci Level, a strong level to look out for reversals.
We are also on a downward weekly channel support and I would anticipate price to respect the channel and reverse.
Technical Analysis: Bullish.
This is a fairly high probability trade and I would Update more as the week progresses.
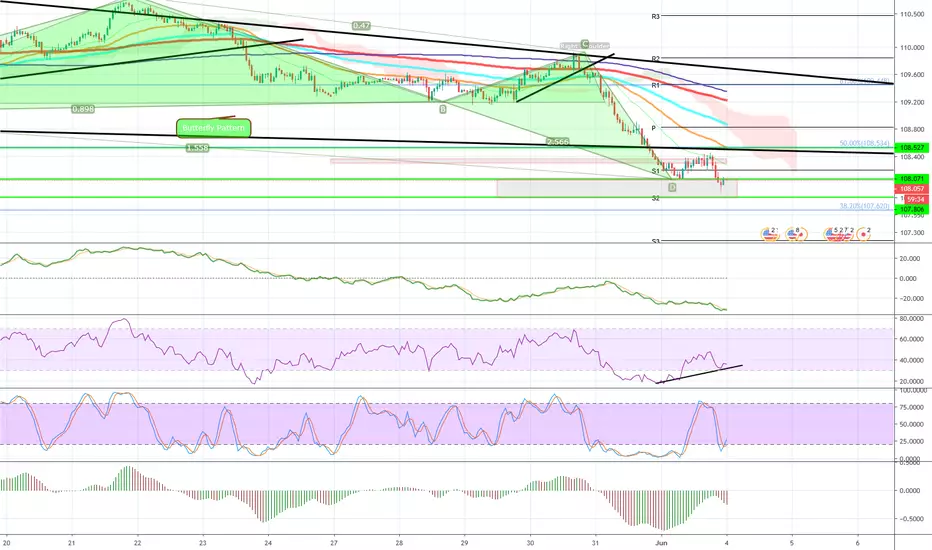
bullish move for usdjpy after respecting support and breaking the trendline its about to reverse at a fib 0,79 i will look for buys from that area
lets see how it plays out.
USDJPY D sharkPossible D point of bullish shark completed, stochRSI oversold and crossing. look to go long at signal.
Be aware price is at major quarter. Good luck to all.
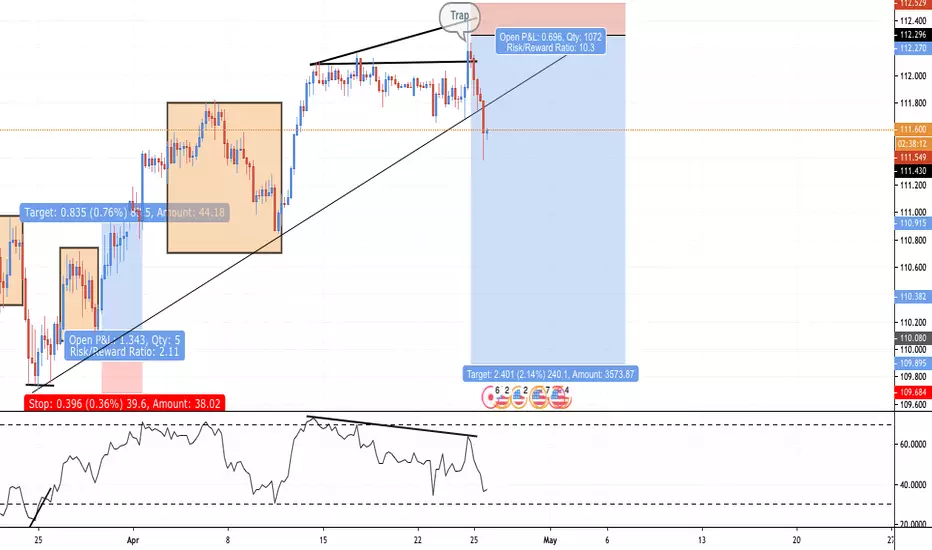
USDJPY: Bullish Trap Whats up everyone?
This is a quick update about my trade from yesterday.
We are looking at the USDJPY pair on the 4h timeframe. We saw a massive bullish trap on yesterdays trading close.
We are short from the top, where the trap happened. Our first position also was stopped out.
Price did break old highs within an hour although no news were happening.
Came back all the way down and obviously even lower within a short time period.
Imagine how much stops and orders were laying above those highs. Imagine how much money was made...
Wishing you guys nice trades and a great weekend!
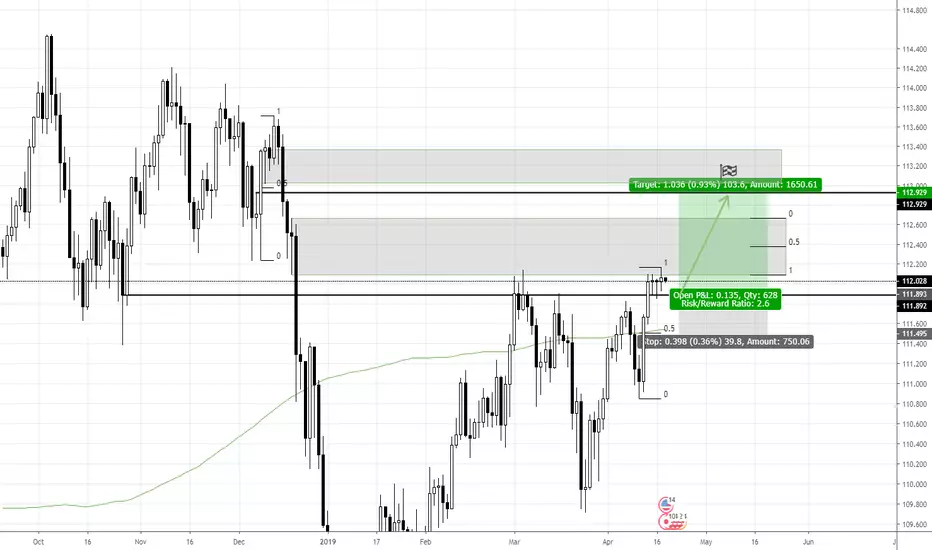
USD/JPY Long - bullish continuation until bearish OBDue to work on our webshop and app we've been busy for the last two weeks.
Let's dive into it. USD/JPY got a strong weekly close along with several decent daily closes above 111.892.
While taking out our 5th March high I'd make use of 112.929 as target. Upper-half of our bearish OB + 1.05 Fib-extension of bearish OB giving confluence here.
Stop-Loss below EQ of current leg-up + 200-MA on daily basis.