EW ANALYSIS: USDJPY Remains BullishHello traders! Today we will talk about USDJPY!
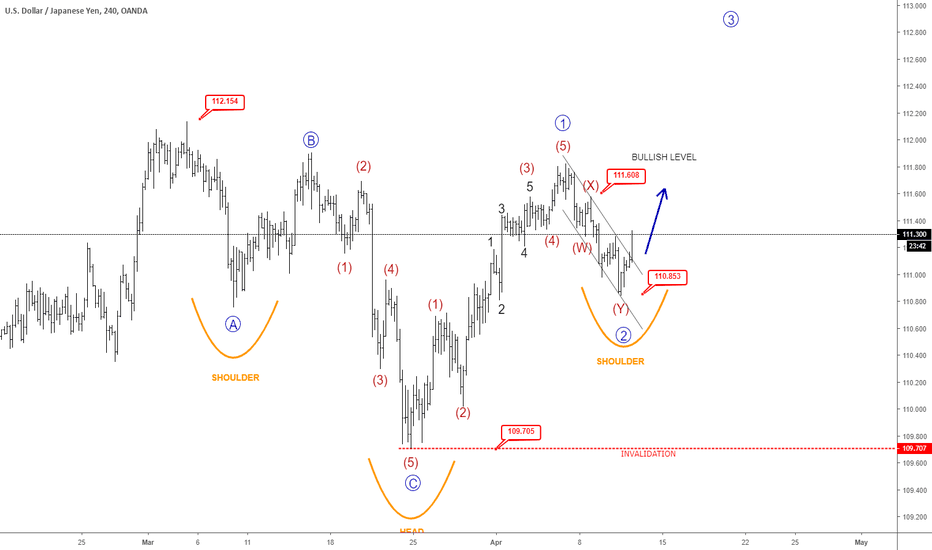
After a big three-wave A-B-C corrective decline in March, USDJPY made a nice five-wave recovery that can be a signal of a completed correction within ongoin uptrend, especially after that possible inverted H&S pattern and intraday W-X-Y corrective pullback. So, if continues higher back above 111.60 region, then we can confirm a bullish continuation within wave 3 back above 112.15 area and higher!
However, in case if goes more complex, we remain bullish as long as it's above 109.70 invalidation level!
Trade smart!
Disclosure: Please be informed that information we provide is NOT a trading recommendation or investment advice. All of our work is for educational purposes only.
Usdjpy-bullish
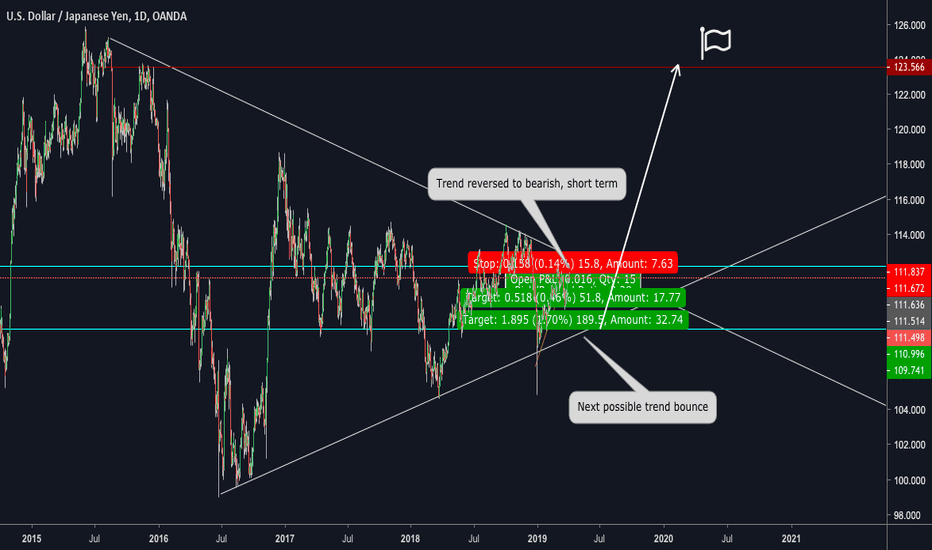
Dollar Yen's TravelThe chart speaks for itself, the entire path written by Dollar yen's journey after the rise of 2015 has been building a huge simetrical triangle.
On the last small bullish trend it has been broken near 111.500. Possibly leading the sellers to take aciton and follow the price until the next triangle bounce close to 108.700. When the huge pattern accumulates to the center it is probable to reach the 124.000 as occured in 2015.
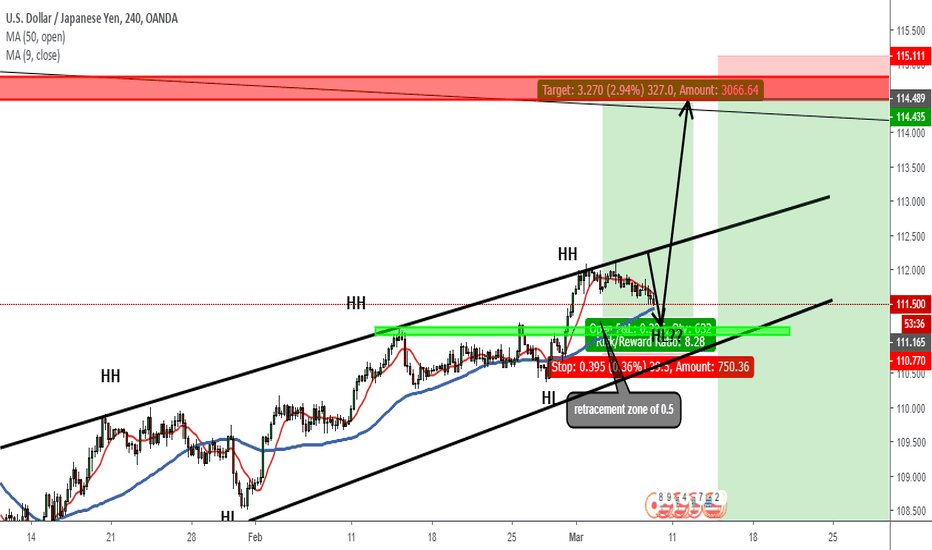
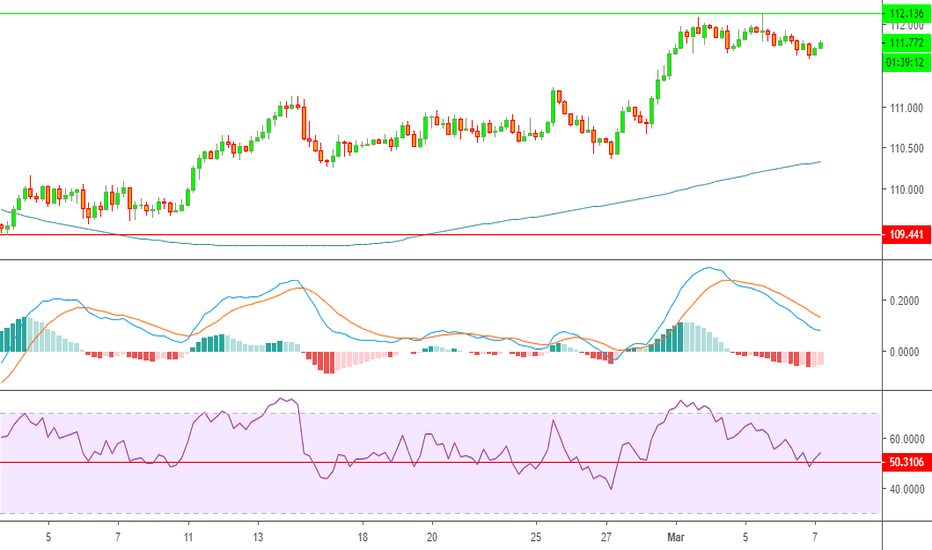
USDJPY: The rally shows strength The USDJPY currency pair on the 4-hour timeframe has been following an uptrend since 3 February. The price reached 112.136 on 5 March (The highest level of 2019). The price action in the USDJPY is mainly driven by the strength in the US Dollar. Traders eagerly waiting for the Non-Farm payroll numbers from the US and clarity on the US-China Trade deal for clear direction.
The 4-hour chart of the USDJPY confirms the positive sentiment in the price movement as the pair is making successively higher tops and higher bottoms. The lowest value of the period under study was recorded on 3 February when the price registered the low of 109.441. Since then, Bulls are in full control of the market as the price reached the highest level of 2019 on 5 March (112.136)
By applying Oscillators analysis, all three indicators confirm the positive bias in the market. As the chart shows, price is well above the 200-period Moving Average. The MACD (Moving Average Convergence/Divergence) is recording values above the zero-line which shows positive sentiment in the USDJPY currency pair. RSI (Relative Strength Index) showing values above 50 which means strength in bullish movement.
Despite of the recent pullback in USDJPY, the rally shows strength because of the strong US Dollar. First resistance level lies at 112.136, once the price break this level, bulls will be able to push the price to register fresh high of 2019.
Disclaimer:
This written/visual material is comprised of personal opinions and ideas. The content should not be construed as containing any type of investment advice and/or a solicitation for any transactions. It does not imply an obligation to purchase investment services, nor does it guarantee or predict future performance. FXTM, its affiliates, agents, directors, officers or employees do not guarantee the accuracy, validity, timeliness or completeness of any information or data made available and assume no liability for any loss arising from any investment based on the same.
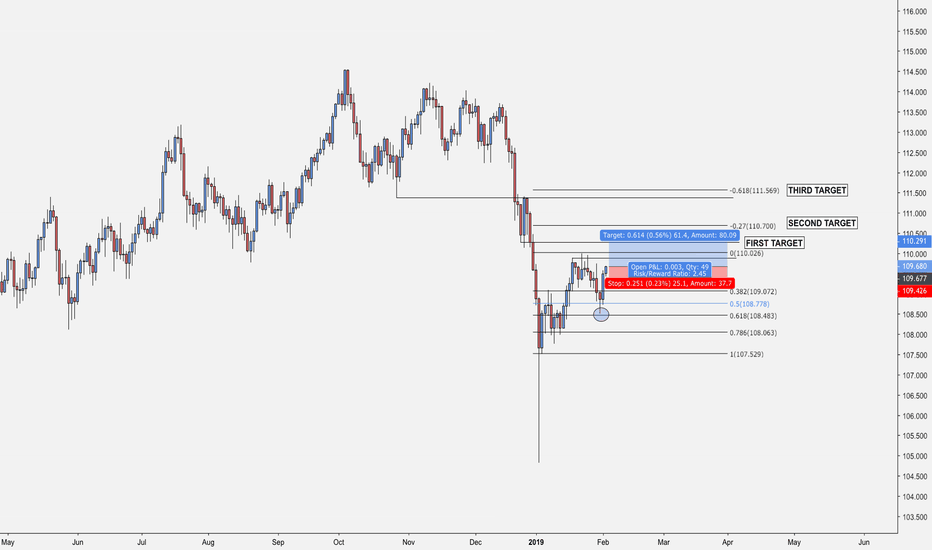
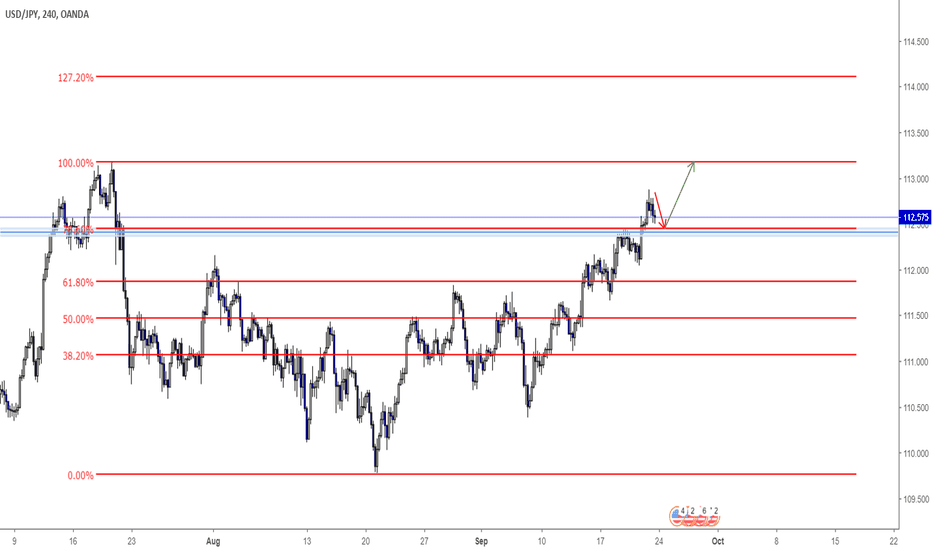
USD/JPY Bullish move!I am waiting for it to retrace to the 78.60% area (fibonacci), which is also a support & resistance area. If it stalls around that area, or if a indecision candle forms at that area, i take the trade to go long! I think this is a very bullish move, lets see!
THIS IS NOT FINANCIAL ADVICE!
Happy trading everyone!
OANDA:USDJPY
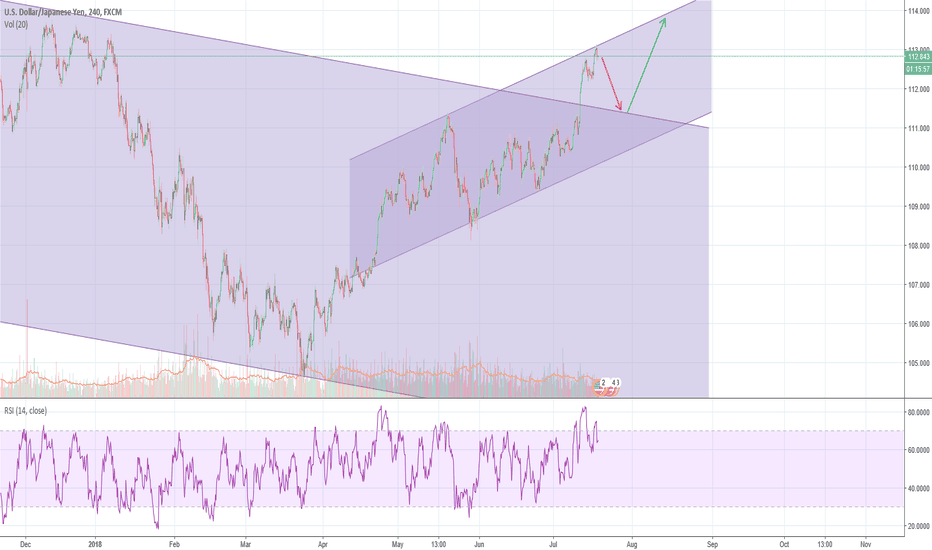
USDJPY breakoutThe price seems to have broken out the resistance level of this bearish channel. The price is currently forming a bullish channel as it breaks out the channel. The price is touching the resistance level of the bullish channel and looks like it may move down from here, this has also been confirmed by the high RSI value. I believe the price would move down from here, it is very likely that the price would move down to the previously broken resistance level, if the price is able to bounce from here it is very likely that this channel would run for a little longer and it is very likely that this pair would see bullish gains over time.
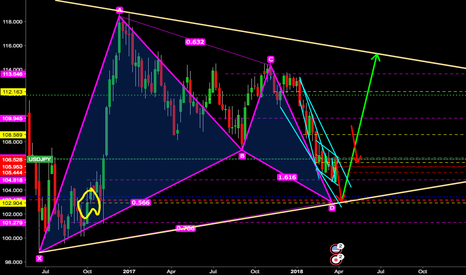
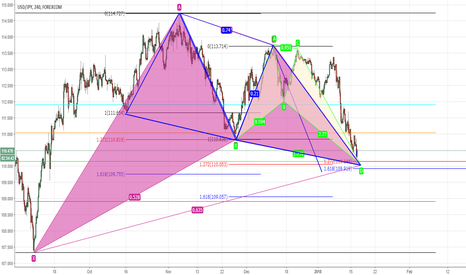
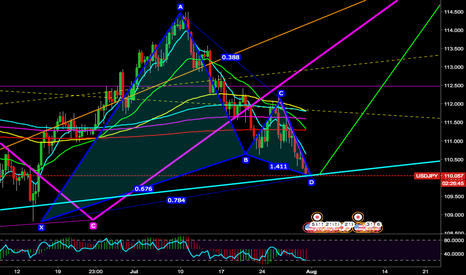
BULLISH USDJPY We are at a inportant level here...
Many patterns in same area..
we got a gartley hitting the 61.8% on the big swing
butterfly on the litle smaller swings hitting the 1.272%.
At the same time we got a three drive to a bottom pattern hitting the 1.272%
On the 5 min chart we got a butterfly... 1.272% equal to 61.8%
SL can be put under the 1.618% of the 5 min butterfly to make the risk as low as possible
Good luck out there
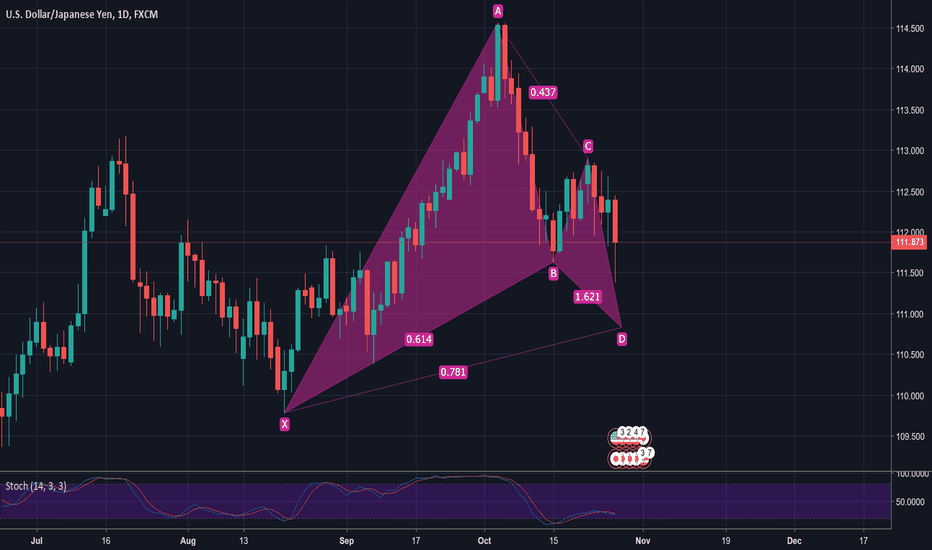
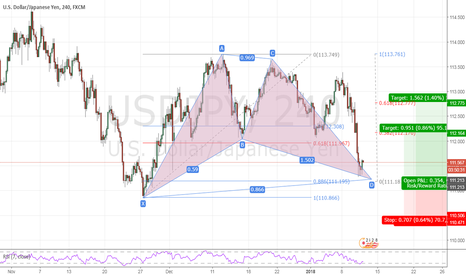
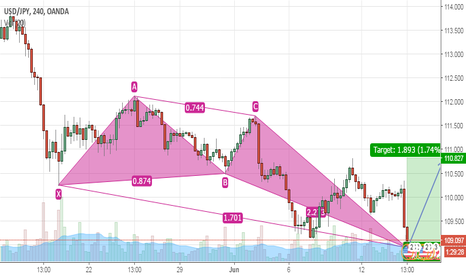
USDJPY bullish bat h4USDJPY might give a log opportunity with this bearish bat on h4
Entry @ 110,87
SL @ 110,47
TP1 @ 112,13
TP2 @ 112,63
NOTE: check your maximum allowed SL because on this case, it is wide
As always, comments are welcome
---------------------------------------------
"Build a plan, follow it consistently"
Regards
Rafael
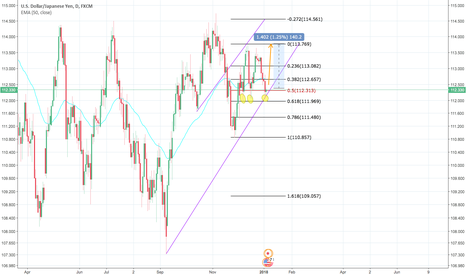
Could USDJPY be swinging back up?Could USDJPY be headed to the upside? Technicals may be leaning bullish on USDJPY and here’s why:
- Triple bottom formation currently forming (possible indicator of a reversal).
- Using bullish bias on the daily chart, price is currently hovering on the 50 level of the Fibonacci indicator, which can be used as high indication for bullish swings.
- Lastly, EURUSD has recently double topped (possible indication of reversal to the downside) which is known to oppositely correlate with USDJPY.
If USDJPY fails to hold this key area, we could see a tumble to the mid 110 zone before any robust evidence of upcoming bullish events. Thoughts?
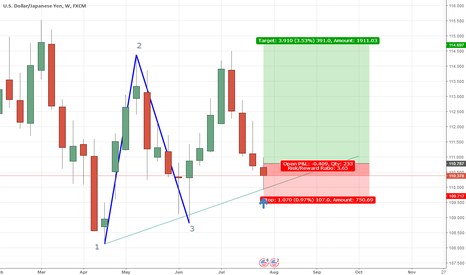
USDJPY WEEKLY BULLISH TARGETOn the daily we have good wick support and on the weekly we have a 123 + trend line. Previously price attempted to break 2 but failed to do so. This could be a retracement to build momentum from multiple confluences and strong zones. At the moment we have some range & indecision so watch out for a fake out and maybe a stop hunt. I hope to see price to break the weekly 2 and thus complete the 123 pattern.
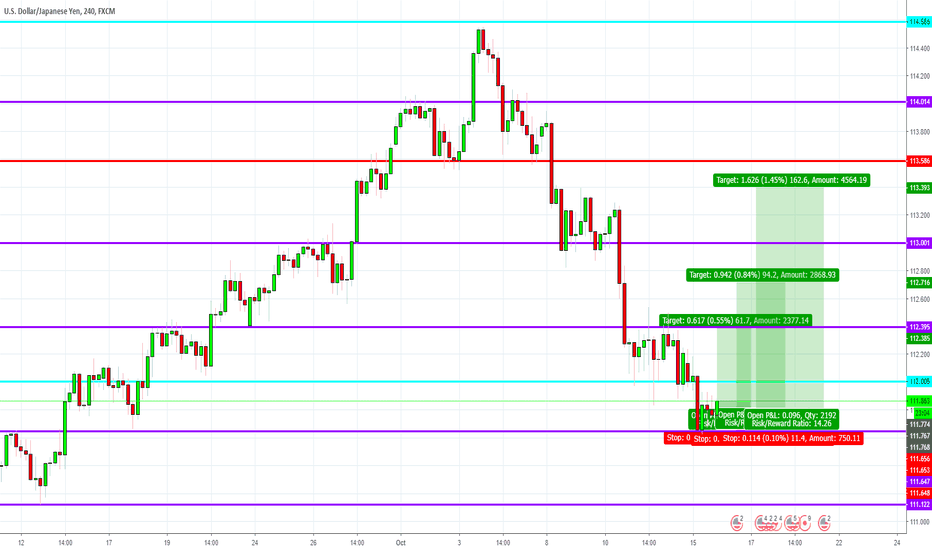
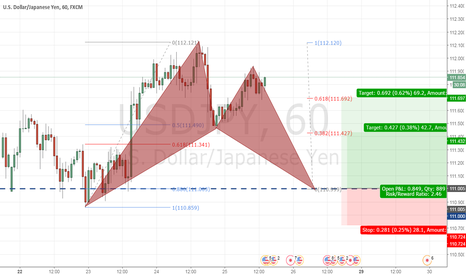
USDJPY potential bullish bat completeing at structureThere is POTENTIAL bullish bat on usdjpy h1
(I said potential because still long way to complete D. Still we don't know if market will move up or down to completion)
Something interesting is that IF it completes, it will do it at even price of 111.000
Entry @ 110.97
SL @ 110.67
TP1 @ 111.42
TP2 @ 111.67
As always, comments are welcome
---------------------------------------------
"Build a plan, follow it consistently"
Regards
Rafael
