UJ SHORT LONG Short then LONG in a channel Then once a good momentum candle on the 30mins we will see a strong ralley to 110.160 then a final touch down to 108.8
Usdjpy-bullish
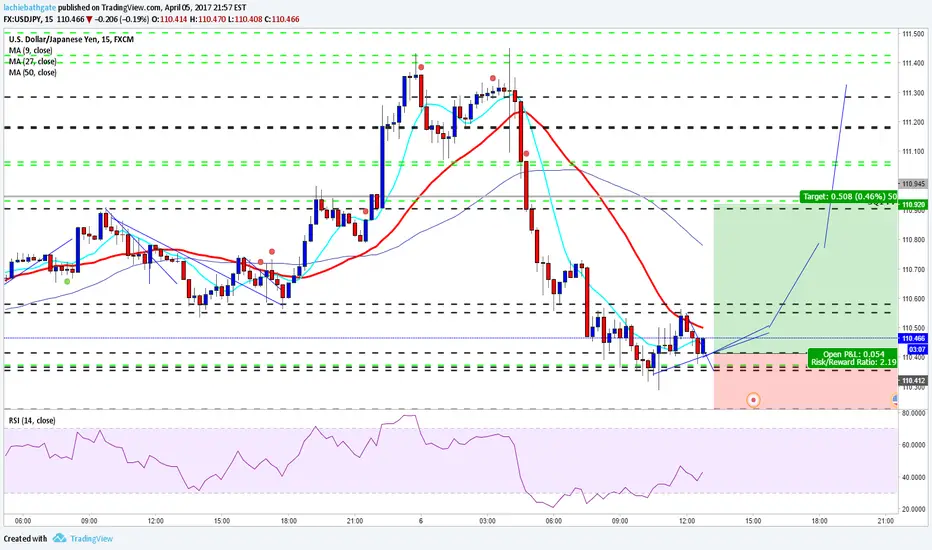
USDJPY LONGUSDJPY Bull on the 15min chart based on
15min 50% retracement
Key fib levels and SQ144
Stopping at 110.920 then possibly short back
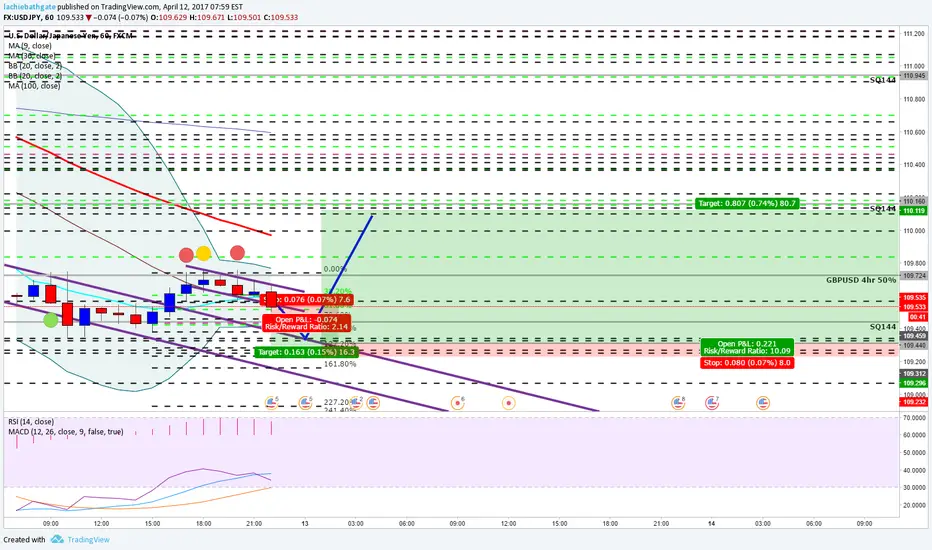
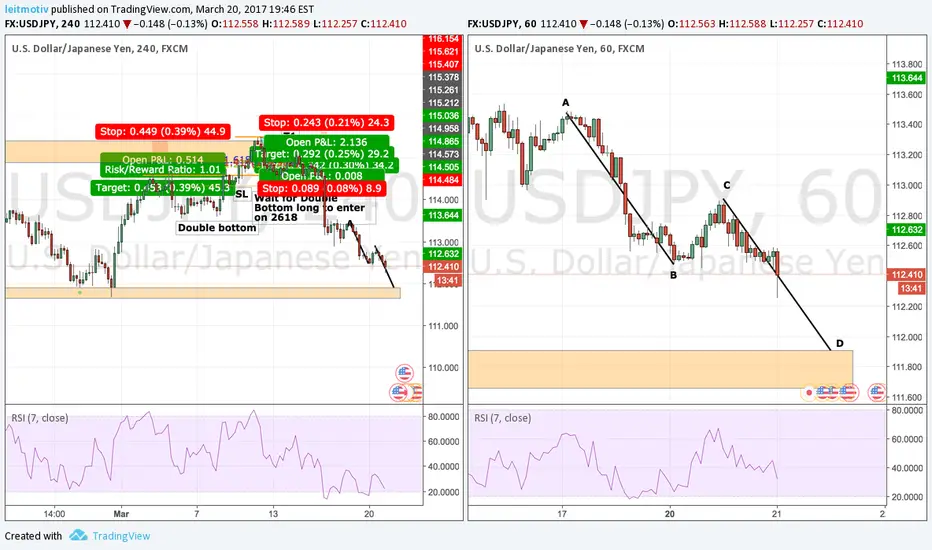
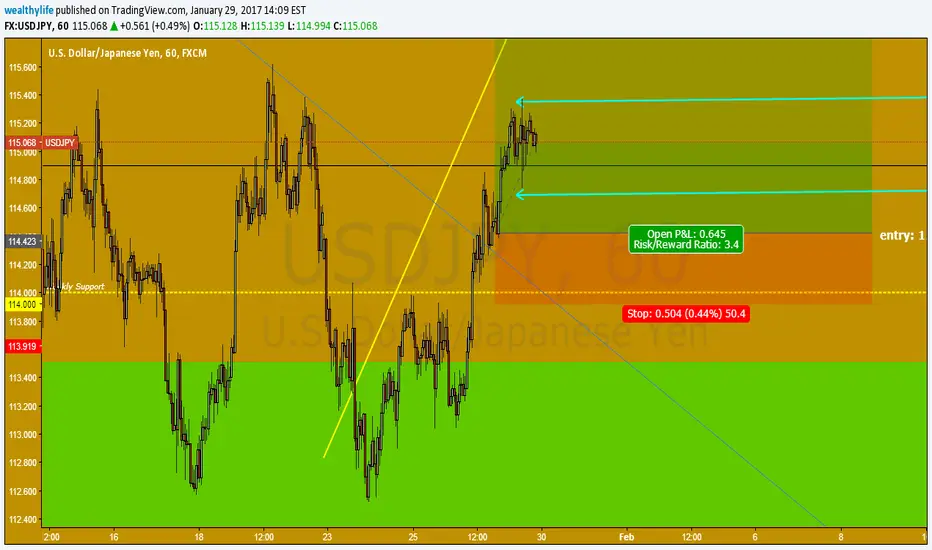
USDJPY 1H Bullish OpportunityHello traders,
Check out a bullish opportunity on the USDJPY. Currently price action is moving sideways with a potential retest of previous structure support on the 4H. If you take a look at the 60M chart, structure aligns perfectly with an AB=CD pattern, which provides for a decent bullish opportunity. However, I will need an additional signal in order to enter, something like a double bottom or an RSI oversold.
Targets can go anywhere within the consolidation channel.
If this helps, give it a like !
Enjoy !
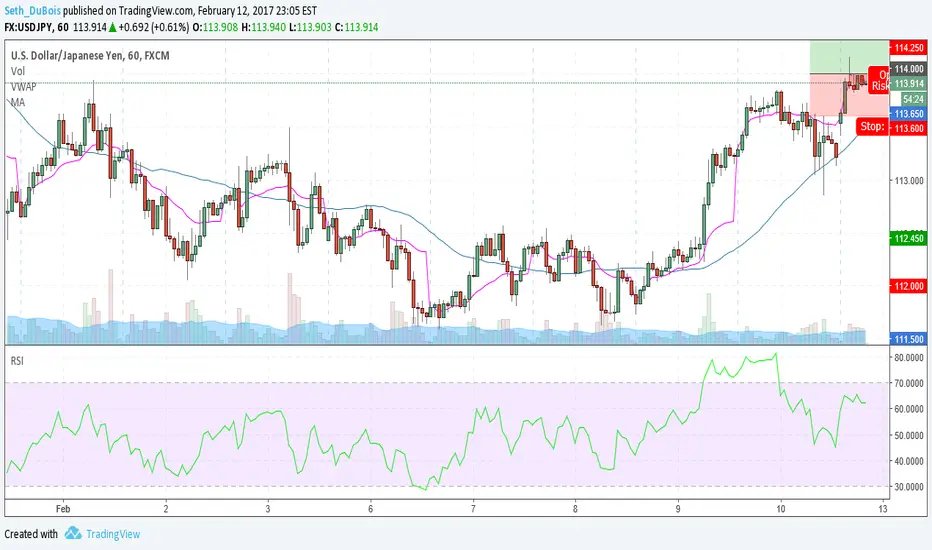
USDJPY (L) 2017.02.12Entry above high base on hourly chart, stop just below prior resistance break. Trading above 20&50SMA on hourly. 2:1 r/r, full position.
bull usd/jpydouble bottom on 111.7 support zone reaching back into November. Chart is beginning to consolidate and trend lines are being respected. Can predict it to move and eventually challenge 113.2 resistance and onto resistance level 115.339 if broken. Dxy is strong and expect a strong dollar to continue. Buy at 111.975 S/L: 111.675 T/P:112.549 notice: this is a premature entry and not the best trade opportunity. Just wanting to make a prediction and see what others think
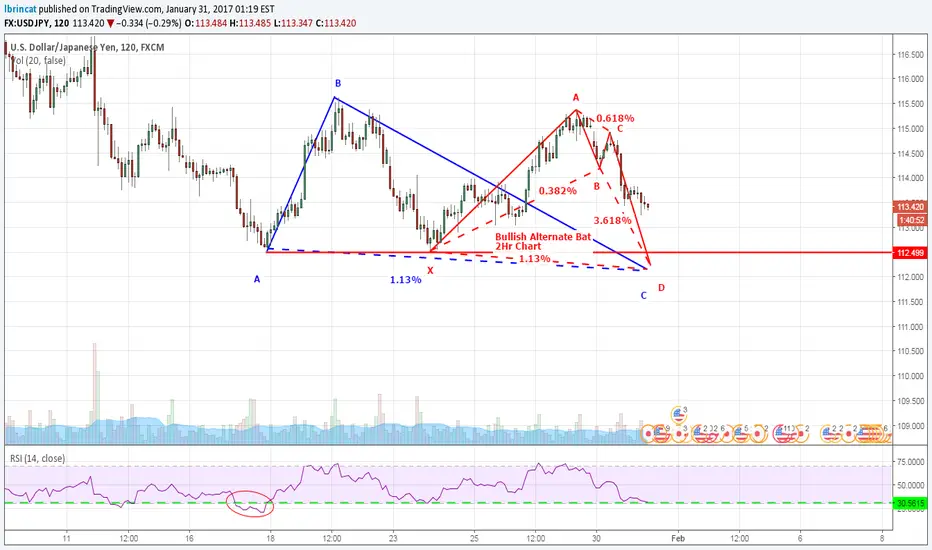
USDJPY LONG Bullish Alternate Bet + RSI BAMM 2Hr ChartWait for price to hit Point D of the Bullish Alternate Bat and For RSI BAMM to be Confirmed with divergence and go long on this.
RSI have to go lower than the 30 level marked with a green line but not lower than the previous low marked with a red circle on the chart.
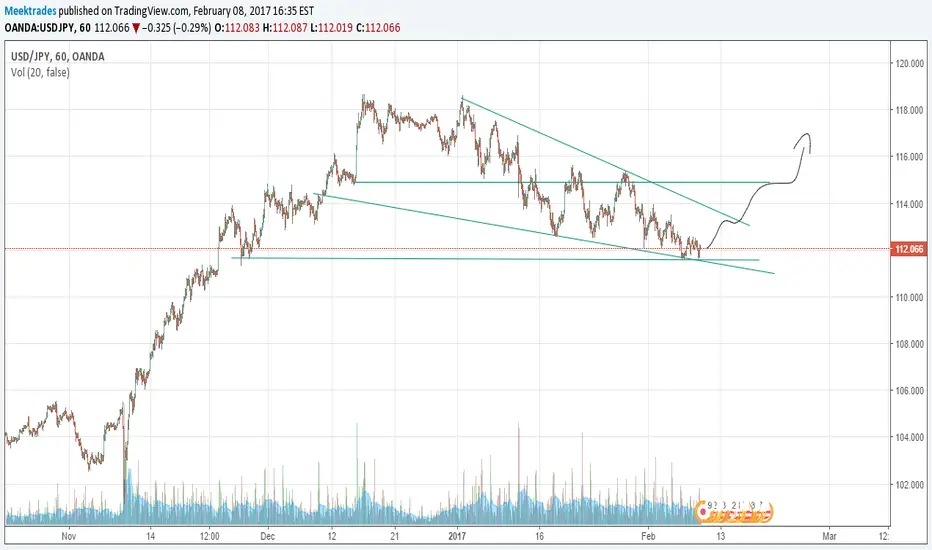
USDJPY BULL VIBESConfluence:
1. Looking for price to rally back around the 114.00 level then continuing the uptrend.
2. Price hasnt retested its breakout yet on the higher timeframe (daily)
3. Key level is the weekly support 114.00
4. Head and shoulders on the 1HR chart indicating probable rally downward before
continuing uptrend.
5. Probable tps
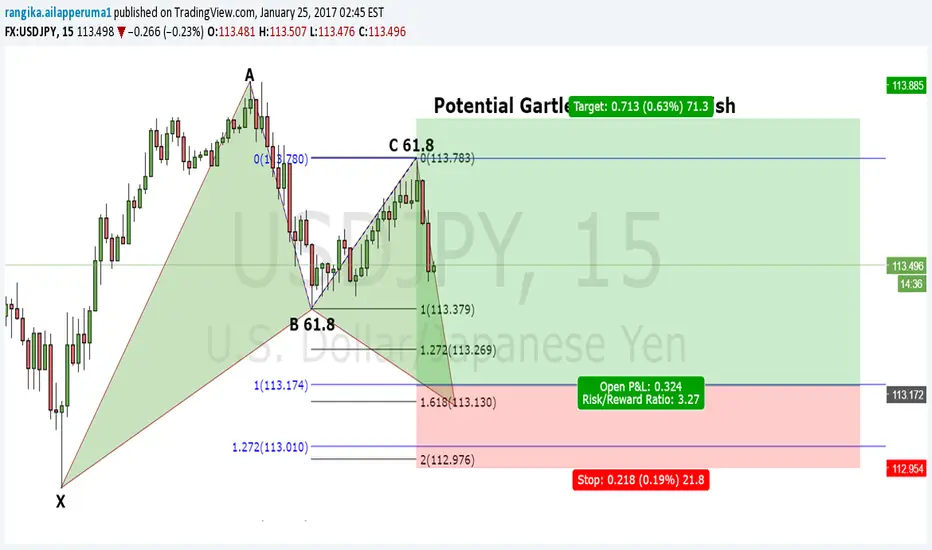
Gartley Pattern - USD/JPY 15 minutesPerfect Gartley pattern - bullish on USD/JPY with a 61.8 retracement of XA & AB, also making AB = CD 1.0
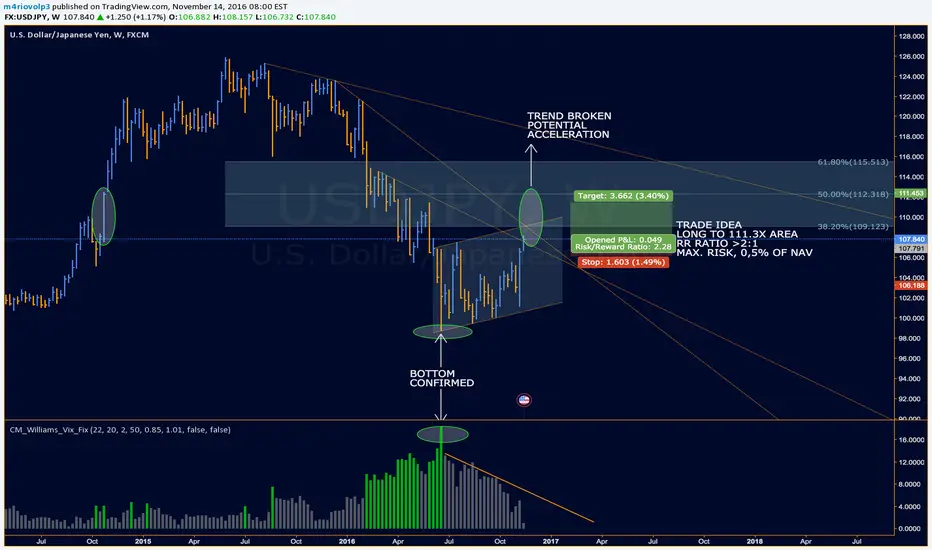
USDJPY Long Idea to 111.3X AREATRADE IDEA
LONG TO 111.3X AREA
RR RATIO >2:1
MAX. RISK, 0,5% OF NAV
For any questions, please, leave a message.
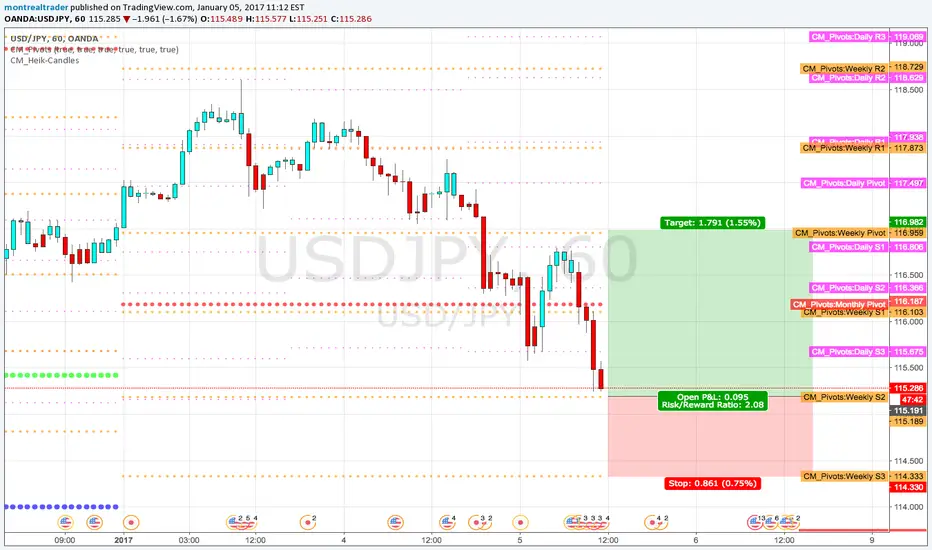
Long at weekly S2 long at 115,18 weekly S2 pivot , first target monthly pivot 116,18 then 116,95 weekly pivot . Stop loss weekly S3 114,33
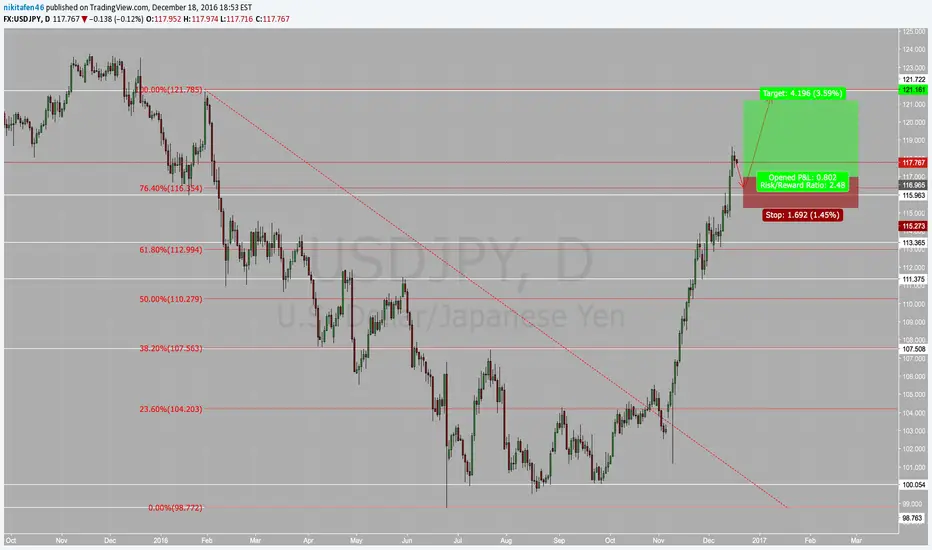
USDJPY Temporary Bearish Retrace, then BullishThe chart above is pretty self-explanatory, and it ties in with my previous analysis of XAUUSD on the daily chart.
1. For the first few days of this trading week, the US Dollar will be weak and USDJPY will retrace to the 116.00 area, a level of great importance.
2. From there, the pair will bounce up on a strong bullish candle, at which closing I will buy with the targets and stop loss shown above.
I think this is a reasonable assessment, well within my strategy parameters.
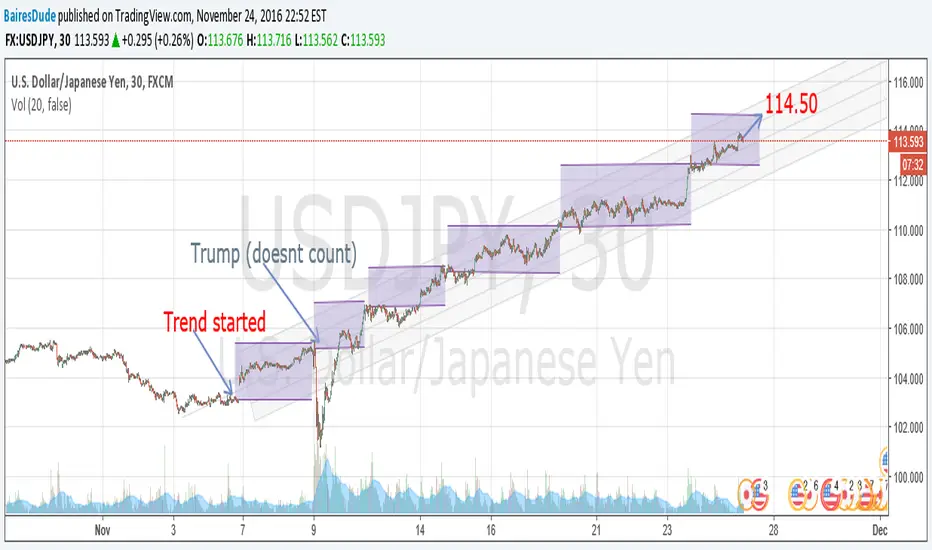
USD/JPY trend on a 30 minutes chartBullish trend repeating over and over on a 30 minutes chart for the USD/JPY chart. Aiming to 114.50 for 11-26-2016
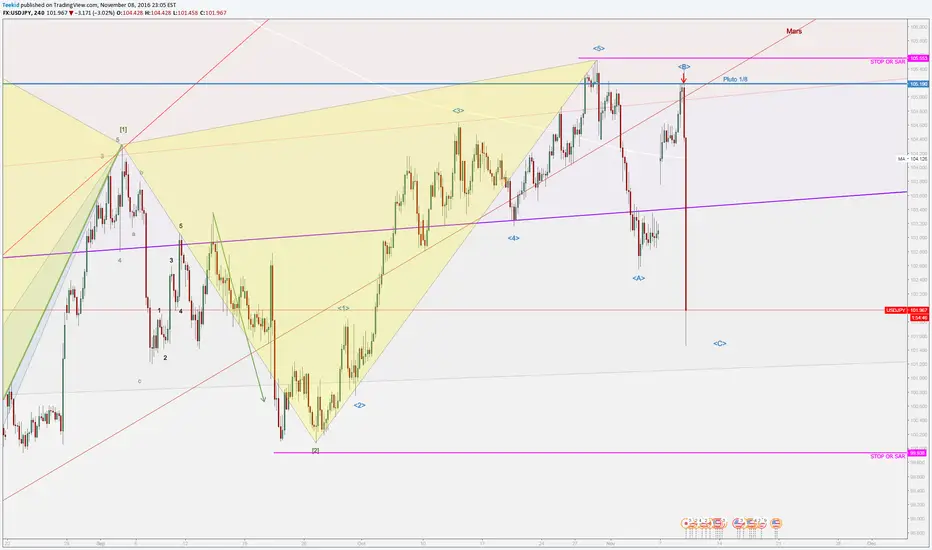
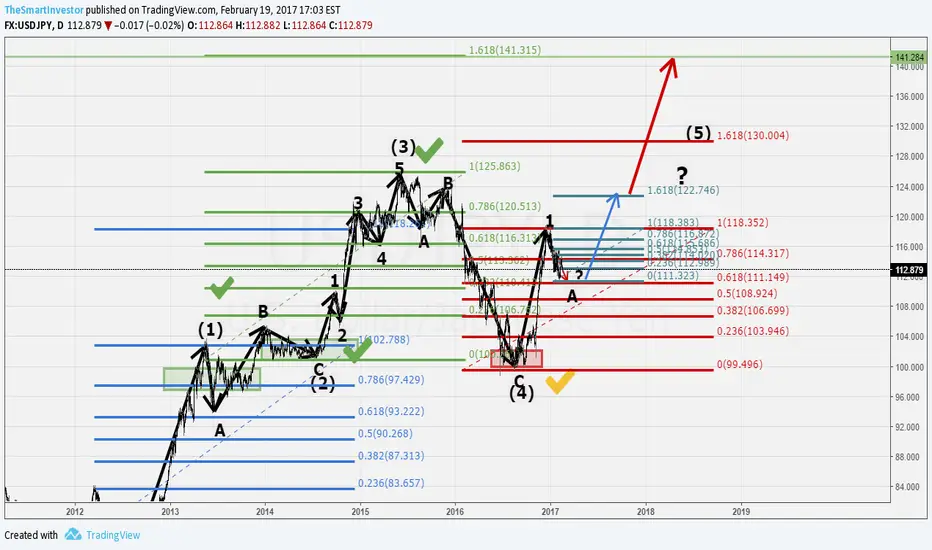
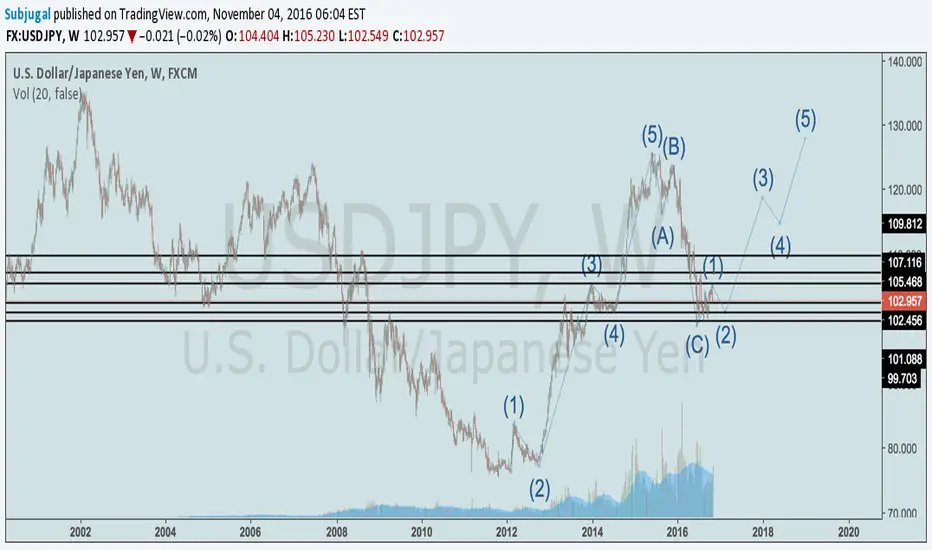
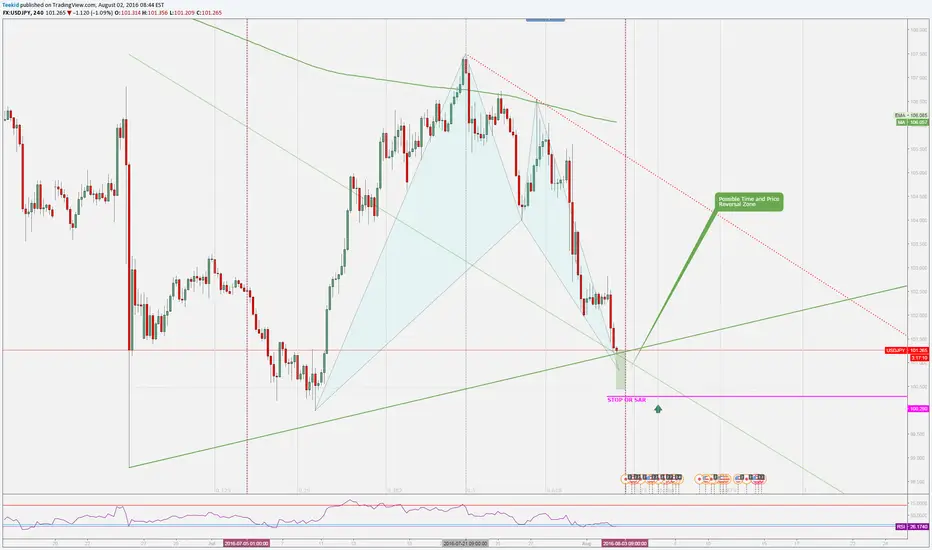
USDJPY might be not bearish ?I got the feeling, USDJPY is seen as short for longterm. Considering monthly timefrime I could imagine, that last sell pressure was kind of reaction to long uptrend. So the sell off might be an ABC correction to EW from year 2012 to 2015. Looking at wave 5 of that EW, where much bullish activity has been and much activity during wave C of ABC correction I could imagine, that USDJPY is not really bearish.
I know, this is not useful for trading at the moment, but I would be quite cautious to step into shorts.
I painted some levels, that might point to support and resistance zones. Regarding how USDJPY run through that zones on way up and back down, it looks to me like aggressive buys and, as reaction, sells to save profits.
For long view I think USDJPY might start another move up.
What I like is the geometry of the lines in EW move up and ABC move down. They look quite parallel. This makes the idea more valid to me.
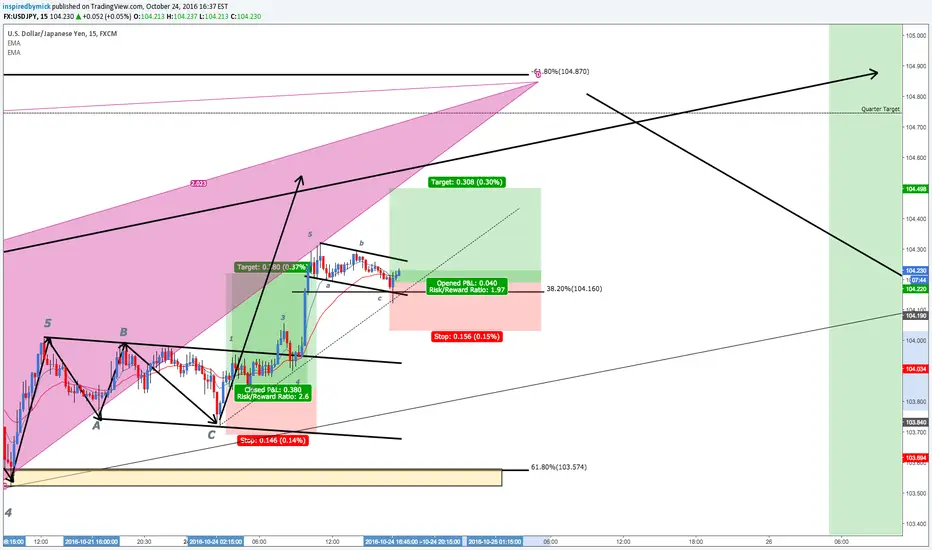
Intraday Setup for Bullish USD/JPY RunPrice has completed ABC Correction on Impulse leg from higher time frame ABC Correction. Expecting Bullish momentum to continue.
Entry at 104.19
TP is at 104.50 for 30 pip gain.
SL at 104.03 for 16 pip risk.
Usdjpy Price should continue into an uptrend for the week, DXY index also shows signs of bullish behavior
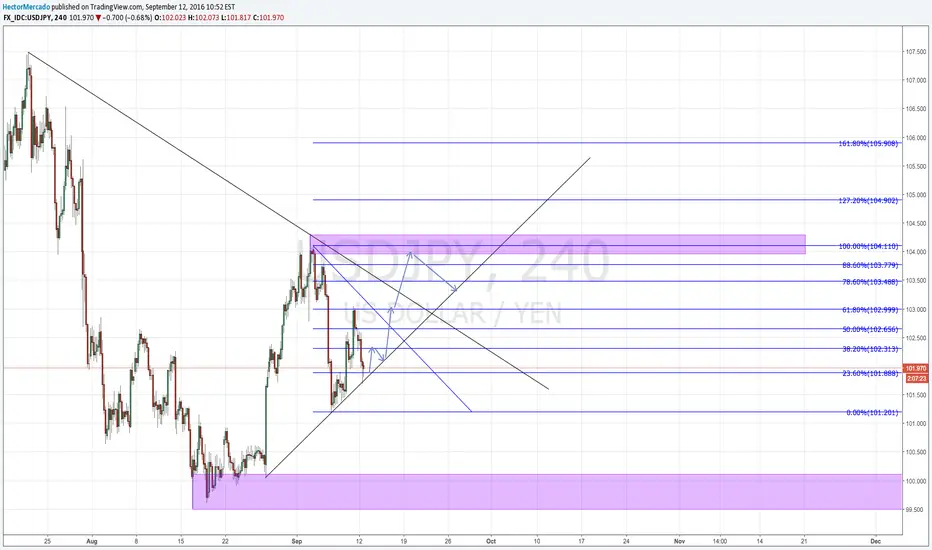
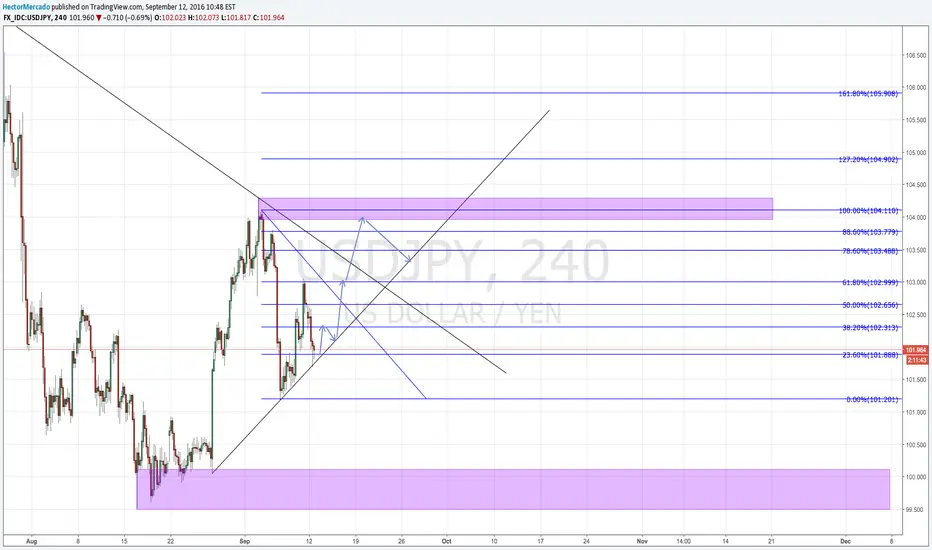
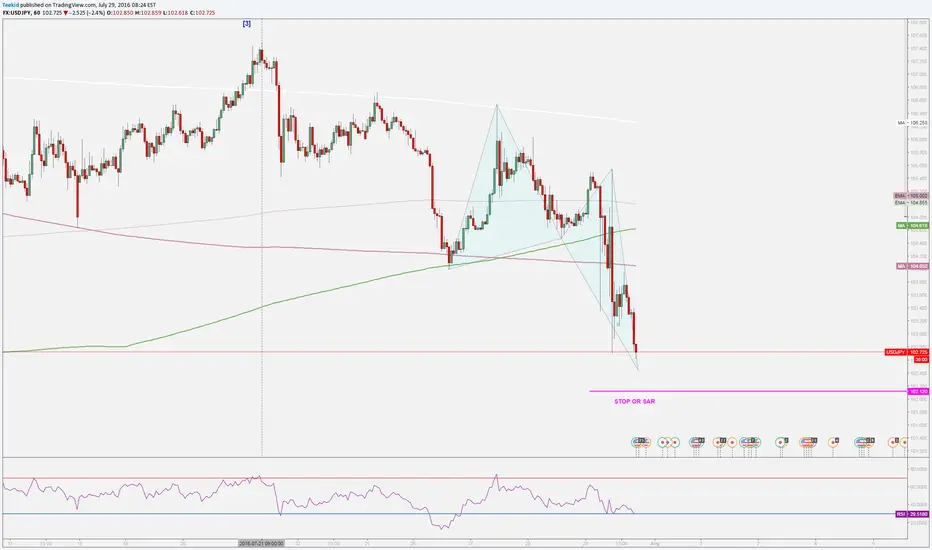
USDJPY Long IdeaUSDJPY stays strong after Yellen's speech and will ride the rally through to 105.5 next week. We could long when it pulls back on Monday around the blue box. We also expect it to hit 110 by the end of September when the US rate hike comes in September.
Fundamental wise, with global stock markets doing well, investors are getting less risk adverse. Safe haven assets like Gold and Yen will further depreciate. We expect BoJ will further defend USDJPY and prevent it from falling below 100. We see a limited downside from Longing USDJPY.
Technical wise, USDJPY broke the resistance and has turned bullish for the next few trading sessions. One could wait for retracement around the blue box for better entry and long it till 105.5.
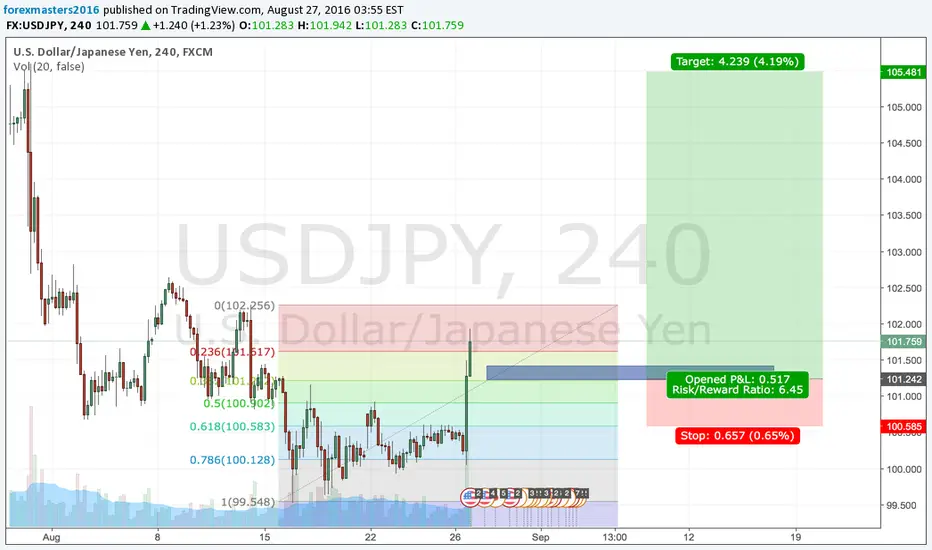
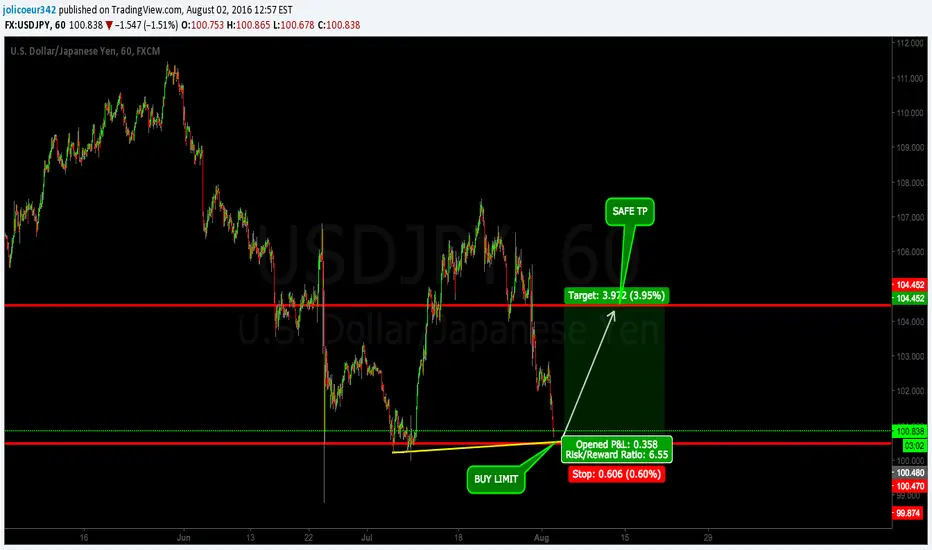
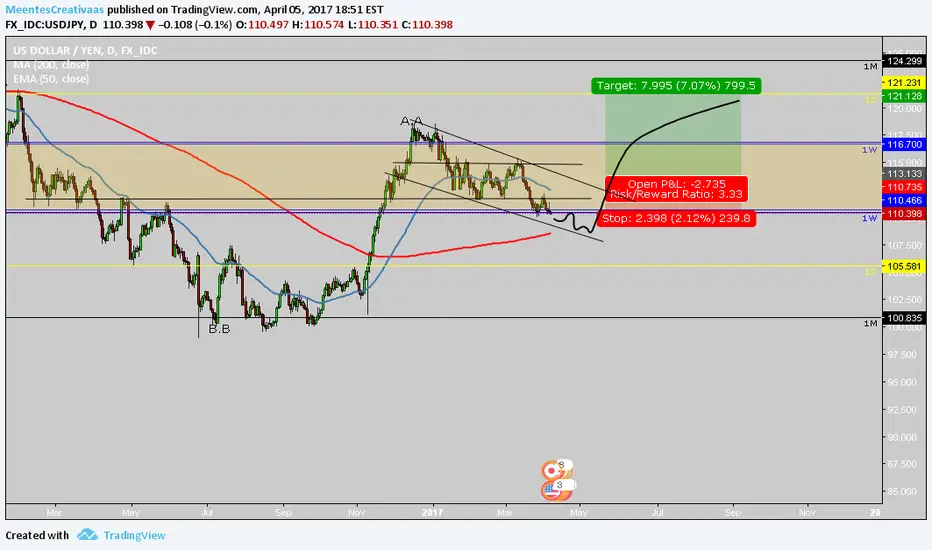
USDJPY - LONG POSSIBILITYSo as you can see the RISK REWARD worth it on this GRAPHIC =) We have a MONTHLY SUPPORT, so the market should reverse! If it doesnt the SL is pretty close to our entry! Simple trade with 400 PIPS reward! for a lost of around 25 PIPS
--
Make sure to LIKE and FOLLOW for more CHARTS IDEAS
I will also make sure to answer every comments below