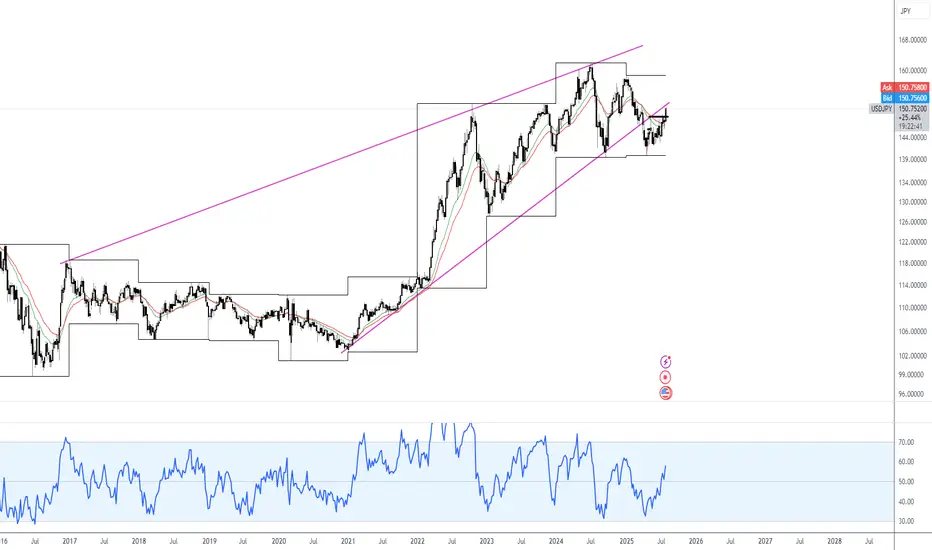
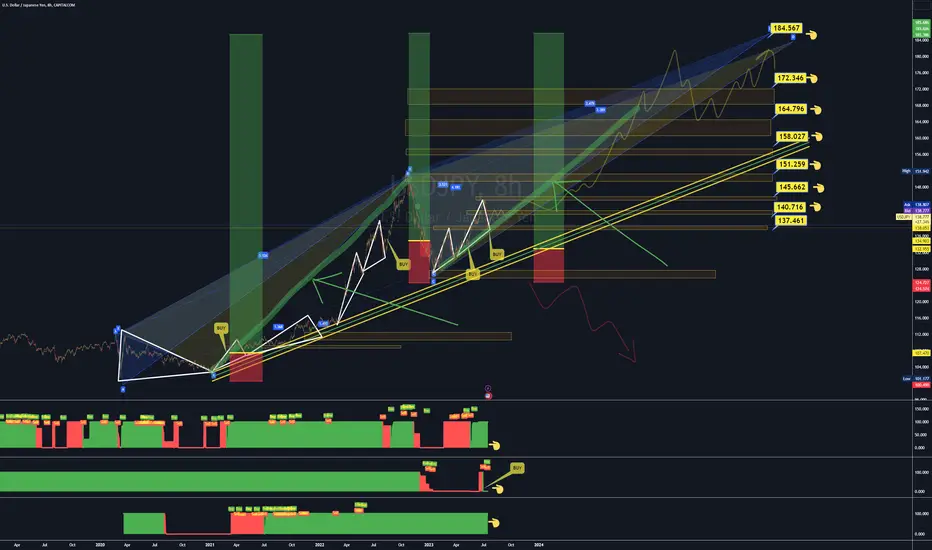
What we looking at heeeeeeeeeeere? My meaningful description is Im looking at this USDJPY pair and drawing magic lines, follow me for more meaningful insights.
TLDR possible long term down trend incoming, if confirmed, plentiful continuation shorts will be available to all.
Usdjpy-trading
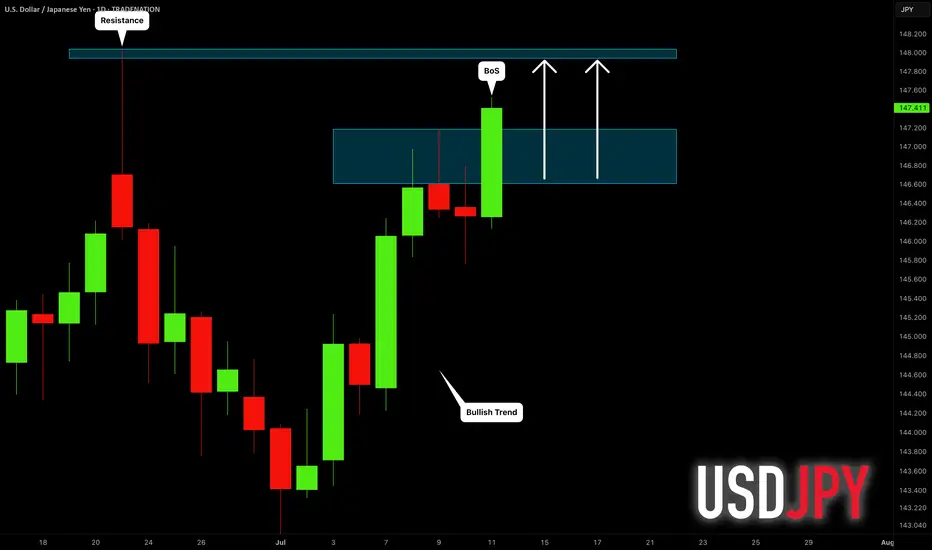
USDJPY: More Growth Ahead! 🇺🇸🇯🇵
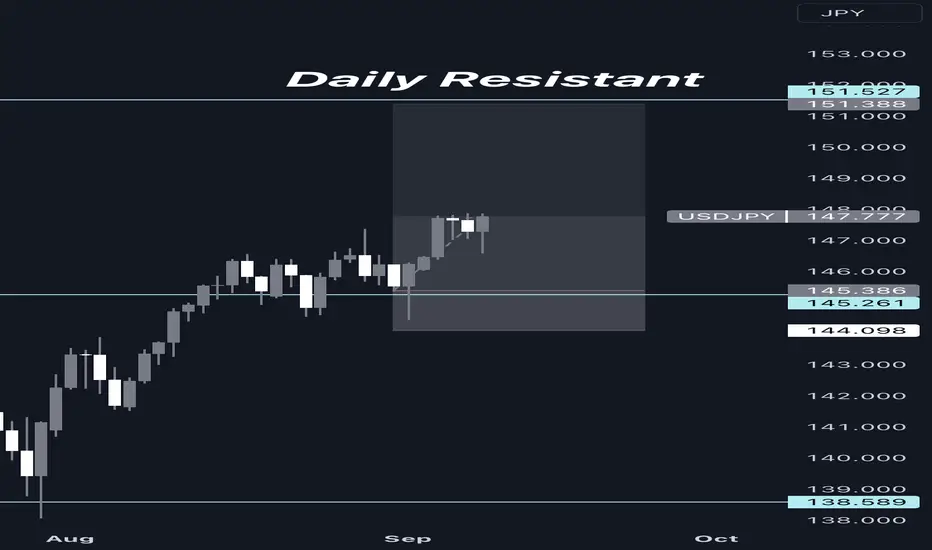
USDJPY broke and closed above a minor daily resistance
with a confirmed BoS.
The next strong resistance is 148.0
It is going to be the next goal for bulls.
❤️Please, support my work with like, thank you!❤️
I am part of Trade Nation's Influencer program and receive a monthly fee for using their TradingView charts in my analysis.
Storm Ahead? Key Level Breakout or Dangerous Reversal!USD/JPY: Storm Ahead? Key Level Breakout or Dangerous Reversal!
Overview:
The USD/JPY pair stands at a crucial crossroads, with technical signals indicating the potential for significant volatility in the near term. Will the Yen regain its footing, or will pressure from the USD continue to push the pair to new highs? This analysis delves into technical, fundamental, and macroeconomic factors to outline potential scenarios and identify key trading zones.
Detailed Technical Analysis:
Primary Trend: The USD/JPY chart clearly shows a short-term uptrend, supported by an ascending trendline (dashed line on the chart) and upward-sloping moving averages (MA). Trend analysis is considered the most important area of technical analysis, and is key to determining the general direction of a security. However, the price is approaching strong resistance zones, suggesting potential selling pressure. Technical analysis is a trading tool used to evaluate stocks and attempt to predict their future movements by analyzing statistical data obtained from trading activity.
Key Price Levels:
Crucial Resistance Zone (SELL Zone): Around 144.894 - 145.178. This is a significant Fibonacci Extension zone (1.13 and 1.236), where the price has reacted in the past and could attract strong selling pressure. If the price breaks and holds above this zone, the uptrend will be confirmed.
Crucial Support Zone (BUY Zone): Around 143.600 - 143.750. This support zone is formed by previous lows and the ascending trendline. If the price corrects to this zone and shows reversal signals, it could be a good buying opportunity. The next support zone is around 142.800. The goal of technical analysis is to determine the buy and sell points of a stock.
Technical Indicators: The MAs (blue, orange, red) maintain a relatively consistent distance and are sloping upwards, supporting the uptrend. However, the convergence of MAs near resistance zones could signal a weakening of upward momentum.
Price Patterns: Currently, the price is forming a pattern similar to a bull flag or an ascending triangle, suggesting a potential continuation of the uptrend if it breaks upwards. Conversely, if the price fails to overcome resistance and breaks the uptrend line, a bearish reversal pattern could form. Wave analysis is a technique based on the observation that markets move in specific patterns called waves.
Relevant Fundamental and Economic Factors:
Macroeconomic Analysis (Japan): The Bank of Japan (BOJ) continues to maintain ultra-loose monetary policy, with negative interest rates and yield curve control. This exerts continuous downward pressure on the Yen. Any signal of change from the BOJ regarding policy will have a significant impact on USD/JPY.
Macroeconomic Analysis (United States): The U.S. Federal Reserve (FED) is still in an aggressive monetary tightening cycle to combat inflation. Inflation reports (CPI, PPI), employment data (NFP), and statements from FED officials will be key drivers for the USD. If U.S. inflation remains high, the FED may continue to raise interest rates, pushing USD/JPY higher. Fundamental analysis focuses on evaluating economic, political, and social factors affecting the value of a currency pair.
Upcoming Economic Events: Closely monitor inflation reports from both the U.S. and Japan, GDP data, unemployment rates, and policy meetings of the BOJ and FED. These events will act as catalysts for sharp movements.
Conclusion and Trading Recommendations:
USD/JPY is in an uptrend but approaching crucial resistance zones.
BUY
Entry: When the price breaks and closes above 145.178, confirming the uptrend continuation. Or when the price corrects to the 143.600 - 143.750 zone and shows bullish reversal candles (e.g., bullish engulfing, hammer).
Take Profit: Higher Fibonacci levels (e.g., 1.382 at 145.491 or 1.5 at 145.918).
Stop Loss: Below the nearest support zone, e.g., below 143.500 if buying at support, or below 144.800 if buying after a resistance breakout.
SELL Scenario:
Entry: When the price approaches the 144.894 - 145.178 zone and strong bearish reversal signals appear (e.g., Gravestone Doji, bearish engulfing, double top pattern).
Take Profit: Lower support levels, e.g., 143.700, 142.800.
Stop Loss: Above the resistance zone, e.g., above 145.300.
Risk Disclaimer: Financial markets always involve high risks. Always manage your capital carefully and never trade with money you cannot afford to lose. This analysis is for informational purposes only and not investment advice.

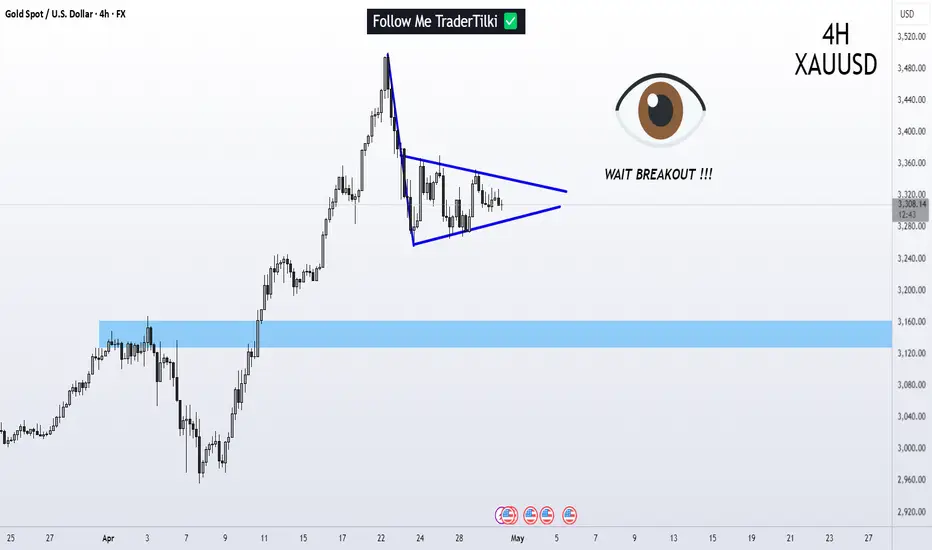
XAUUSD/GOLD | 4H | SWING TRADEHey There,
Guys, I advise you to just wait for the breakout in gold. This is swing trading. I am just waiting for a breakout; if this breakout is to the downside, the target will be at least 3.215 level.
I hope this matches your desired tone.
Don't forget to click the like button at the bottom of this post to stay up to date with the latest changes!
Dear friends, your likes are always the biggest motivation for me to share my analysis. Therefore, I would like to ask each and every one of my followers; please keep your likes coming.
I sincerely thank everyone who supports me with their likes.
USDJPYI don't usually trade using the RSI strategy, but for some reason, I decided to take a look at it. What I found was a very strong divergence on the 4-hour timeframe, which has been developing over 72 candles—a significant number. Based on this, I expect this candle to be the reversal candle signaling an upward move toward the targets mentioned above.
Trade safely
USDJPY Set To Grow! BUY!
My dear followers,
This is my opinion on theUSDJPY next move:
The asset is approaching an important pivot point 150.36
Bias - Bullish
Technical Indicators: Supper Trend generates a clear long signal while Pivot Point HL is currently determining the overall Bullish trend of the market.
Goal - 151.52
About Used Indicators:
For more efficient signals, super-trend is used in combination with other indicators like Pivot Points.
———————————
WISH YOU ALL LUCK
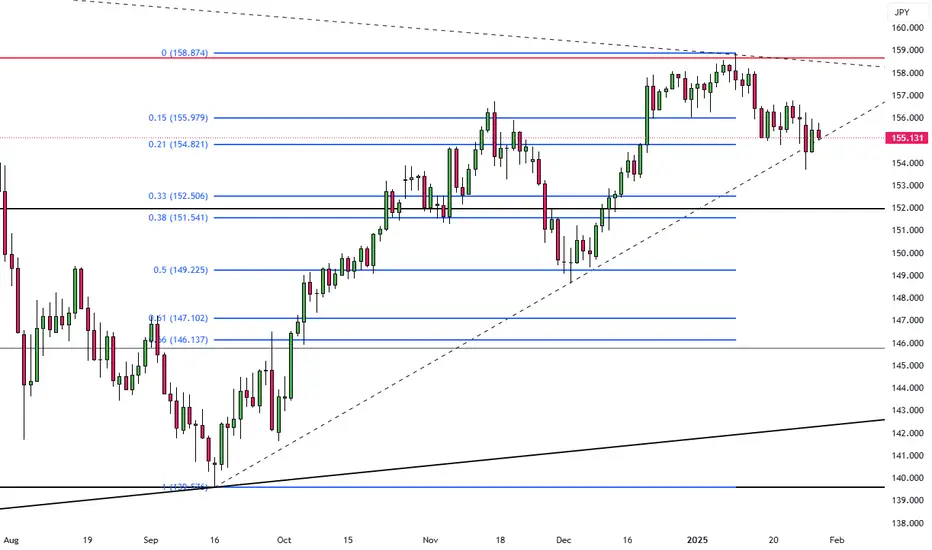
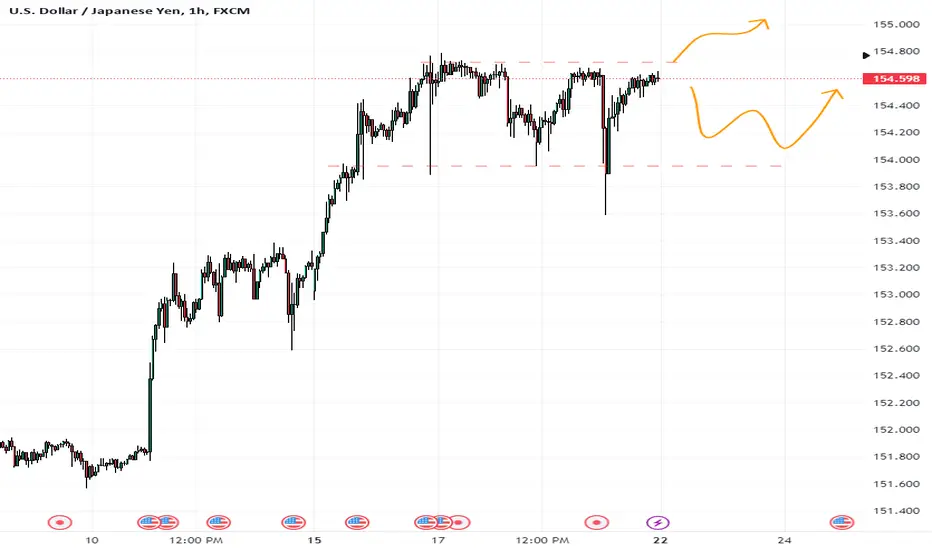
Yen Slips to 155.6 as Markets Await Fed Policy DecisionThe yen trades around 155.6 per dollar, slipping after Tuesday’s loss as investors await the Fed’s policy decision. The central bank is expected to hold rates steady despite Trump’s calls for immediate cuts.
Trump’s escalating tariff threats added pressure, while safe-haven demand linked to a low-cost Chinese AI model faded. BOJ minutes showed a cautious stance on policy adjustments, though January’s rate hike and inflation forecast revisions signal potential further increases.
The key resistance level appears to be 158.60, with a break above it potentially targeting 160.00 and 161.00. On the downside, 154.90 is the first major support, followed by 153.80 and 151.90 if the price moves lower.
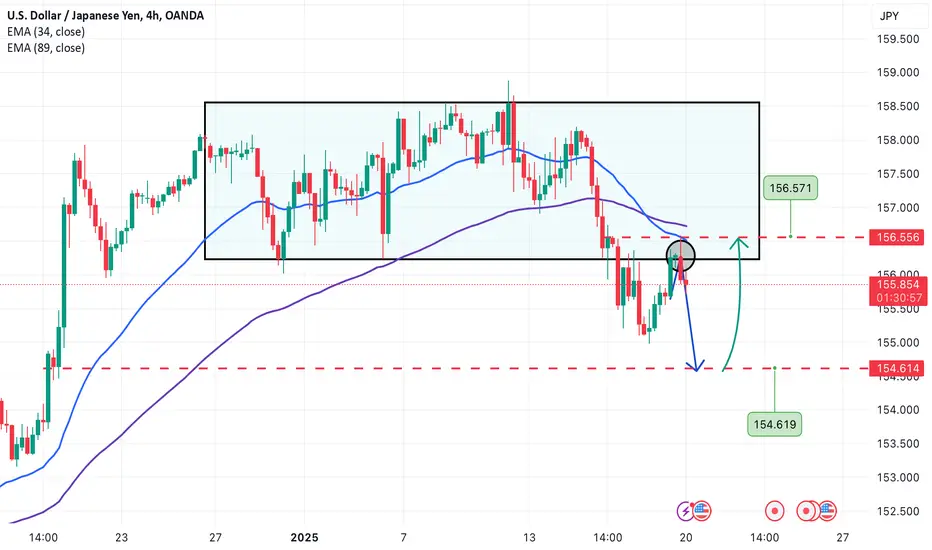
USD/JPY: Consolidation Ahead of Big MoveLooking at the 4-hour chart of USD/JPY, I see the pair is currently trading around 155.79, with a notable reaction at the support area near 155.50. The 34 EMA and 89 EMA have started to widen their gap, indicating that the bearish pressure is still in place. However, the 155.50 price zone acts as an important psychological support, creating a temporary balance between buyers and sellers.
The 34 EMA acts as dynamic resistance near 156.20. If the price fails to break above this level, the downtrend is likely to continue.
A break below 155.50 could drag the price to test deeper support at 154.80 – a strong support level in previous sessions.
Conversely, if the price breaks above the 34 EMA, the pair could test the higher resistance at 156.80, near the 89 EMA.
Usdjpy could be seeing a turn ,mindful of spikes on monday Hello fellow traders , my regular and new friends!
Welcome and thanks for dropping by my post.
Chart wise it seems to be heading more to the downside resuming its downtrend.the friday's move was due to the election in japan. Now that the result is out, let's see how the market react on monday.
Do check out my recorded video (in trading ideas) for the week to have more explanation in place.
Do Like and Boost if you have learnt something and enjoyed the content, thank you!
-- Get the right tools and an experienced Guide, you WILL navigate your way out of this "Dangerous Jungle"! --
*********************************************************************
Disclaimers:
The analysis shared through this channel are purely for educational and entertainment purposes only. They are by no means professional advice for individual/s to enter trades for investment or trading purposes.
*********************************************************************

Do not speak English !!! I only speak chart language!!!Do not speak English !!! I only speak chart language!!!
Usdjpy, congrats to those who long the break up last week!Hello fellow traders , my regular and new friends!
Welcome and thanks for dropping by my post.
Yup, as mentioned, if you have gone long last week..so question this week, is it gonna repeat what happened last week?Hmmmm i am starting to be more cautious
Do check out my recorded video (in trading ideas) for the week to have more explanation in place.
Do Like and Boost if you have learnt something and enjoyed the content, thank you!
-- Get the right tools and an experienced Guide, you WILL navigate your way out of this "Dangerous Jungle"! --
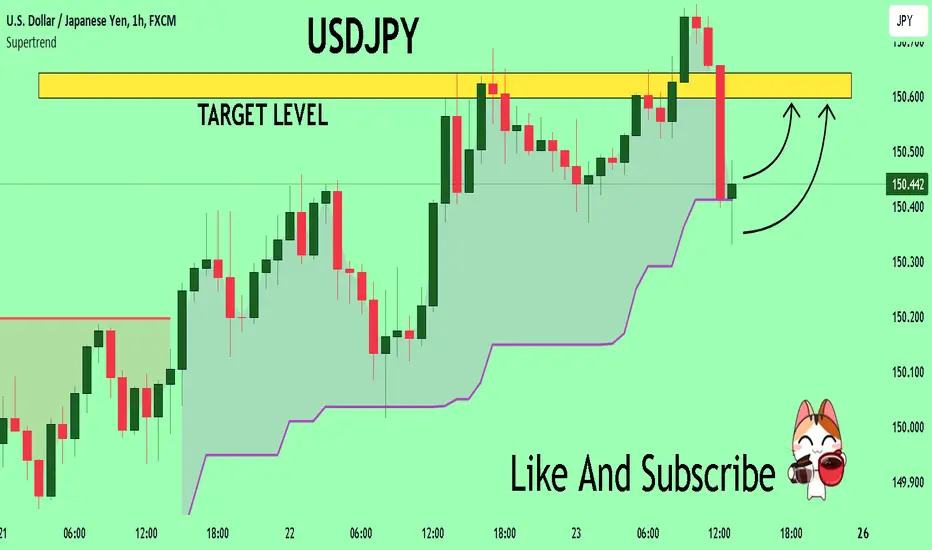
USDJPY Technical Analysis! BUY!
My dear subscribers,
USDJPY looks like it will make a good move, and here are the details:
The market is trading on 150.42 pivot level.
Bias - Bullish
Technical Indicators: Both Super Trend & Pivot HL indicate a highly probable Bullish continuation.
Target - 150.59
About Used Indicators:
The average true range ATR plays an important role in 'Supertrend' as the indicator uses ATR to calculate its value. The ATR indicator signals the degree of price volatility.
———————————
WISH YOU ALL LUCK
Analyzing USDJPY price today, please follow my articleUSDJPY surged after falling below the 200-day SMA but encountered strong resistance at the 200-day EMA and recovered some of last week's decline. The Relative Strength Index has recovered from the 30 level, but it is trending sideways and the MACD is rising after falling below the trigger line.
If the upward pressure continues, the price could revisit the previous starting point at 146.60. A break above this area is the starting point for USDJPY's second sell-off and a tightening of the 100-day SMA.
If the bears reappear and the bears attempt to pull back the price, the initial downtrend could stall at the short-term support zone at 141.86 and then at the short-term bottom at 140.90 .
Overall, USDJPY remains in negative medium-term mode after the sharp pullback from 151.91, but it seems to have received enough support. However, with the MACD strengthening in the negative zone, a bullish breakout is more likely. Recommended to buy at a discount.

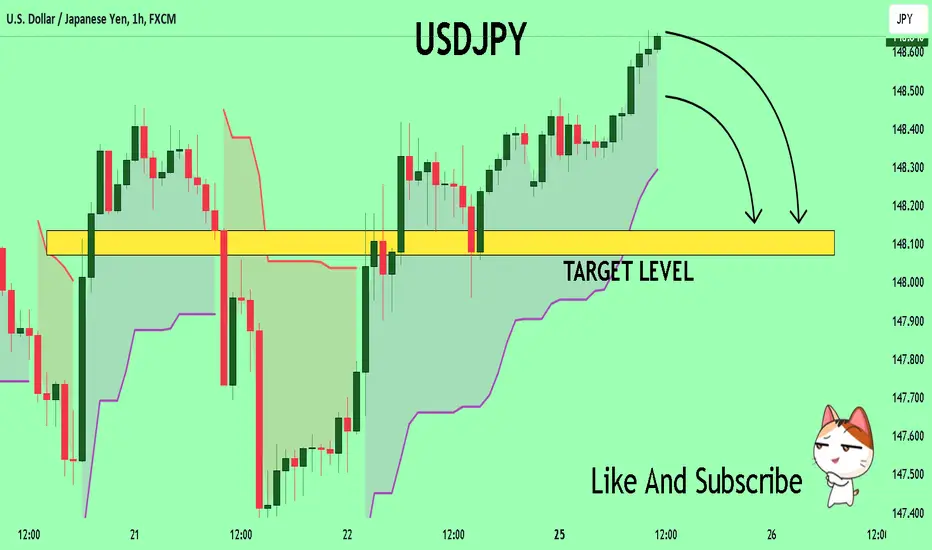
USDJPY Buyers In Panic! SELL!
My dear friends,
My technical analysis for USDJPY is below:
The market is trading on 148.62 pivot level.
Bias - Bearish
Technical Indicators: Both Super Trend & Pivot HL indicate a highly probable Bearish continuation.
Target - 148.13
About Used Indicators:
A pivot point is a technical analysis indicator, or calculations, used to determine the overall trend of the market over different time frames.
———————————
WISH YOU ALL LUCK
USDJPY TO THE MOON Hello traders how's your weekend is goingggg!! here is our usdjpy trade still if you want to buy so you can buy till daily resistant!
USDJPY Analysis: Buyers clearing resistanceToday's focus: USDJPY
Pattern – Resistance test
Support – 144.72
Resistance – 146.50 / 149.00 area
Today, we have run over the USDJPY price action and looked at the overall trend. Buyers have beaten resistance, but will we see a new move back up to test the key supply area that stopped the last rally?
Have a great day and good trading.

USDJPY BULLISH WILL Go to 180 Yen the Bank of Japan is unlikely to increase its ultra-loose policy rate until Governor Kuroda's term expires in the first quarter of 2023.
A break below 124is the start of bearish trend.
Technical: BULLISH
STRATEGY
BUY THE CORRECTION
Higher Highs
Higher Lows
Fundamentals:
See my previouse USDJPY trade ideas.All Tades are active, and a lot of fundamental explanations of USDJPY. Read them.Undestand them,then you can mae good trades.
Japan has kept interest rates at 0% since the global financial crisis in 2008.
Japan’s current interest rate is -0.10% which has been in place since January 2016.
Wven an interest rate rise will hold the bullish trend.
Japan must increase its interest rates to minimum 5points, to make eve, and make Yen more attractive. And this neve will happen duing the next 5-10 years!!!!!
As the yen continues to depreciate, and the inflation rate is expected to accelerate in the coming months, what are analysts’ forecasts for Japan's interest rate in 5 years?
The BoJ has projected in January that long-term rates could rise from 0.3% seen this fiscal year, to 0.4% in 2023-2025, before climbing eventually to 3.1% in fiscal 2032. The projections show that a 0.5 percentage-point rise in long-term rates would add 3.3 percentage points to the debt-to-GDP ratio.
Fitch Ratings and ING expected the Bank of Japan interest rate would remain unchanged at -0.1% until the end of 2024.
BofA expected the Bank of Japan to hold the ultra-loose policy rate through the remainder of Governor Haruhiko Kuroda’s tenure, and any policy normalisation would be delayed until new leadership came in after April 2023, despite pressure from the weaker yen.
The yen is likley to benefit later in 2023, as we believe the BoJ will eventually end its yield curve control policy and the Japanese bond yields will rise
Therefor traders will sell yen more excessively before this happens.
A decline in long-end U.S. yields and a peaking out in terminal rate expectations into 2023, alongside the risk of a moderate U.S. recession, should clear the runway for a lower repricing of the dollar/yen pair in 2023.
In addition, the BoJ shocked markets in December by relaxing its yield curve control (YCC) policy of pinning yields close to zero.
The central bank announced it would allow 10-year Japanese yields to climb as high as 0.5 percent, compared with 0.25 percent previously. The yen strengthened against the dollar after the news.
Electricity and gas for households registered the biggest jump of 21.5% and 20.1%, respectively. Japan is a net importer of oil and natural gas, whose prices have hit record highs amid Russia’s invasion of Ukraine.
Food prices in Japan rose by 7.3% yoy in January 2023.
The BoJ said in its January 2023 statement:
“On the price front, the year-on-year rate of change in the CPI (all items less fresh food) has been in the range of 3.5-4.0 percent due to rises in prices of such items as energy, food, and durable goods. Meanwhile, inflation expectations have risen.”
The new economic policy package will support domestic demand, partly offsetting subdued household confidence and real income. Loss of momentum in trading partner economies will moderate exports. After peaking in the course of 2022, headline consumer price inflation will fall back in late 2023 as energy prices stabilise, but then gradually increase again towards 2% in 2024 as wage growth gains momentum.
USDJPY: 4H-D Technical OverviewHello traders!
I hope you are all doing well. In this video, I am excited to share with you a detailed analysis of USDJPY on the Daily and 4H timeframes.
On the Daily timeframe , we are currently experiencing a strong uptrend (same as Weekly) and the price appears to be developing a complex pattern before resuming the bull run. We will need to exercise patience and wait for this consolidation to finish.
Meanwhile, on the 4H timeframe , we anticipate the price to make local higher highs, potentially reaching one of the two areas highlighted on the chart (FVG/4H bearish OB zone). Once this happens, we will be on the lookout for a reaction that could lead to a potential sell setup.
I will be keeping you updated on any new developments in the comment section below, so stay tuned!
As always, I urge you to trade safely and not over risk. Remember to exercise patience and wait for the pattern to fully develop before making any decisions.
Thank you and happy trading!

USDJPY trade Ideamarket at daily low
market rejected support area
market formed head and shoulders pattern
wait for break above trendline, after retest and wick rejection enter bullish

USDJPY Projection My projection for USDJPY on the daily timeframe. I expect higher prices for the end of february. We can see a strong reaction at the weekly bullish order block and the SMT bullish divergence with DXY.
We have 40 days high as buyside liquidity and a SIBI as next point of interest if the price keeps bullish structure.
What do you think?

USDJPYLong trade on UJ. Nice bounce off Support. CPI data coming out tonight so keeping a tight SL. PEPPERSTONE:USDJPY
USDJPY Hello Traders, here is the full analysis on USDJPY , let me know in the comment section below if you have any questions, the entry will be taken only if all rules of the strategies will be satisfied. Kindly tap on like and follow button l.. Please also refer to the Important Risk Management
Trading USDJPY with SMCProbably my first video here on trading view. i am looking for a very long term short on usdjpy. But now we are facing a short term long, in order for price to fill the fair value gap to balance price.
