USDJPY Short Setup – Bearish Breakout WatchBias: ✅ Strong Sell
Timeframe: 4H
Pair: USDJPY
Week: 26–30 May 2025
🔍 Technical Setup:
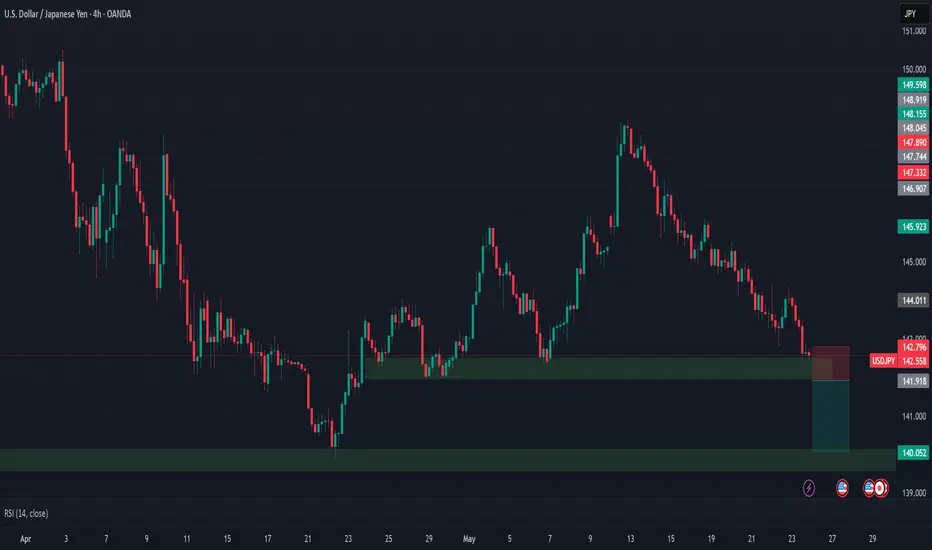
USDJPY is sitting on a critical support zone around 142.55. A decisive break and 4H close below this level would confirm a bearish continuation.
Entry: Break below 142.55
Stop Loss: Above resistance at 142.80
Take Profit: Major support around 140.05
Risk-Reward Ratio: ~4R
Structure: Lower highs, pressure on demand – momentum building
🧠 Macro Confluence:
📉 USD Weakness: Dovish Fed, worsening macro (Investogenie Score 1.8 ↓)
💴 JPY Strength: Seasonal bias, bullish COT positioning, risk-off sentiment
🧾 COT: JPY net long positions at 92% RSI
📊 Conditional Scores: JPY ↑, USD ↓
⚠️ Risk Sentiment: VIX 22.68 – risk-off favors JPY
⚠️ Risk Notes:
Wait for confirmation candle before entry
Watch FOMC + GDP (USD) for volatility spikes
Consider scaling in on retest of broken support
📌 Let the level break before jumping in. Precision matters.
Share your thoughts or charts below 👇
USDJPY
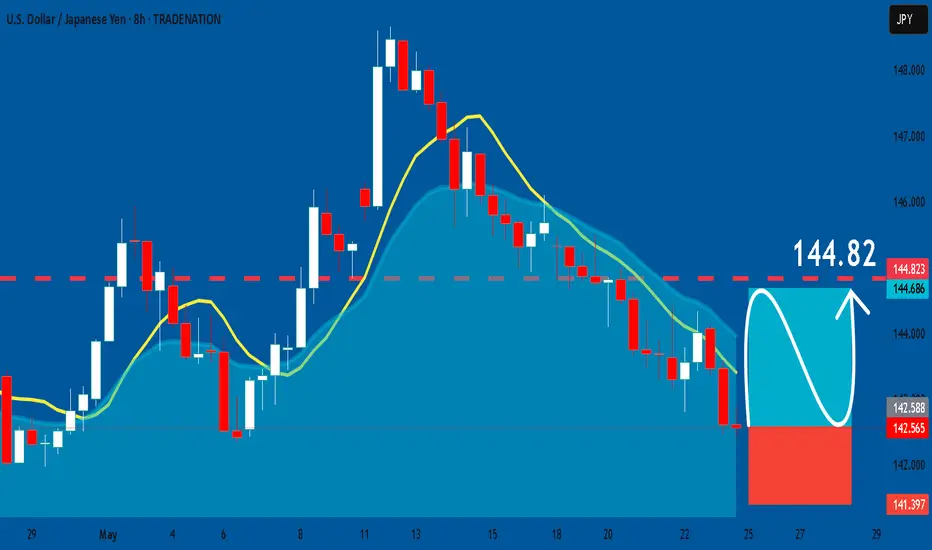
USDJPY: Long Signal Explained
USDJPY
- Classic bullish setup
- Our team expects bullish continuation
SUGGESTED TRADE:
Swing Trade
Long USDJPY
Entry Point - 142.56
Stop Loss - 141.39
Take Profit - 144.82
Our Risk - 1%
Start protection of your profits from lower levels
Disclosure: I am part of Trade Nation's Influencer program and receive a monthly fee for using their TradingView charts in my analysis.
❤️ Please, support our work with like & comment! ❤️
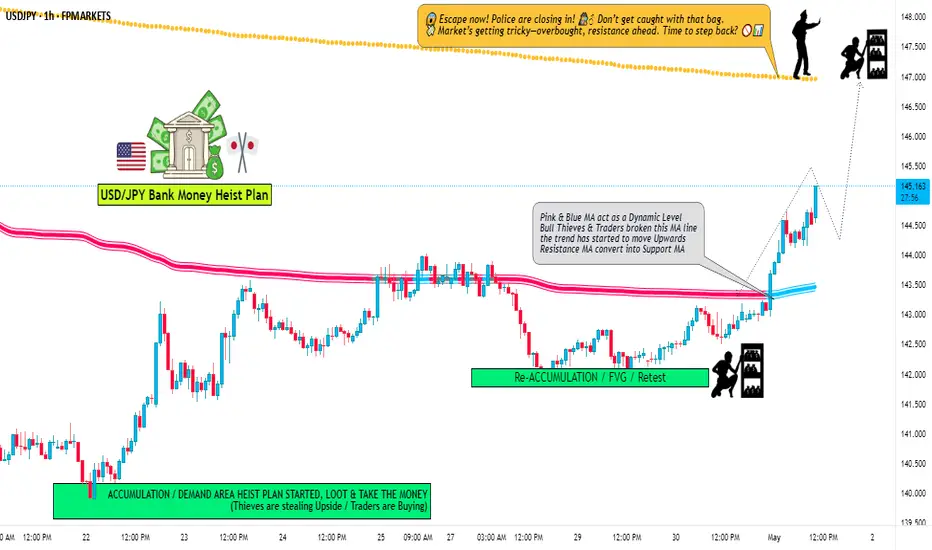
USD/JPY "The Ninja" Forex Bank Money Heist (Bullish)🌟Hi! Hola! Ola! Bonjour! Hallo! Marhaba!🌟
Dear Money Makers & Robbers, 🤑 💰💸✈️
Based on 🔥Thief Trading style technical and fundamental analysis🔥, here is our master plan to heist the USD/JPY "The Ninja" Forex Market Heist. Please adhere to the strategy I've outlined in the chart, which emphasizes long entry. Our aim is to escape near the high-risk YELLOW MA Zone. It's a Risky level, overbought market, consolidation, trend reversal, trap at the level where traders and bearish robbers are stronger. 🏆💸"Take profit and treat yourself, traders. You deserve it!💪🏆🎉
Entry 📈 : "The vault is wide open! Swipe the Bullish loot at any price - the heist is on!
however I advise to Place buy limit orders within a 15 or 30 minute timeframe most recent or swing, low or high level. I Highly recommended you to put alert in your chart.
Stop Loss 🛑:
Thief SL placed at the Nearest / Swing low level Using the 1H timeframe (143.000) Day trade basis.
SL is based on your risk of the trade, lot size and how many multiple orders you have to take.
🏴☠️Target 🎯: 147.000
💰💵💸USD/JPY "The Ninja" Forex Money Heist Plan is currently experiencing a bullishness,., driven by several key factors. .☝☝☝
📰🗞️Get & Read the Fundamental, Macro, COT Report, Quantitative Analysis, Sentimental Outlook, Intermarket Analysis, Future trend targets.... go ahead to check 👉👉👉🔗🔗🌎🌏🗺
⚠️Trading Alert : News Releases and Position Management 📰🗞️🚫🚏
As a reminder, news releases can have a significant impact on market prices and volatility. To minimize potential losses and protect your running positions,
we recommend the following:
Avoid taking new trades during news releases
Use trailing stop-loss orders to protect your running positions and lock in profits
💖Supporting our robbery plan 💥Hit the Boost Button💥 will enable us to effortlessly make and steal money 💰💵. Boost the strength of our robbery team. Every day in this market make money with ease by using the Thief Trading Style.🏆💪🤝❤️🎉🚀
I'll see you soon with another heist plan, so stay tuned 🤑🐱👤🤗🤩
Japan's Bond Market Crisis: A Global WarningIntroduction: The Shattering of an Illusion
Japan’s government bond market, the world’s second-largest, has long been a cornerstone of global financial stability. With a debt-to-GDP ratio exceeding 260%, Japan’s fiscal structure has relied on a captive bond market, a compliant central bank, and a political system willing to defer fiscal reckoning. Yet, in May 2025, this delicately balanced system began to unravel. For two consecutive days, Japan’s 30-year and 40-year government bonds (JGBs) found no buyers, marking a historic collapse in confidence. The 20-year JGB auction recorded its weakest demand since 2012, with yields on 20-, 30-, and 40-year bonds soaring to multi-decade highs. This isn’t a minor market hiccup—it’s a structural breakdown with global implications.
This article explores the causes, consequences, and global ramifications of Japan’s bond market crisis, positioning it as a warning for other heavily indebted nations, particularly the United States. We’ll examine the Bank of Japan’s (BoJ) yield curve control (YCC) policy, the erosion of fiscal credibility, the unwinding of the yen carry trade, and the ripple effects on global bond markets, the US dollar, and gold as a safe-haven asset. By dissecting these dynamics, we aim to provide a comprehensive understanding of why Japan’s crisis matters and how it could foreshadow a broader sovereign debt reckoning.
The Anatomy of Japan’s Bond Market Breakdown
A Captive Market Unravels
Japan’s bond market has been a model of repression for decades. Domestic investors—pension funds, banks, and insurance companies—have been compelled to hold JGBs due to limited investment alternatives and cultural preferences for stability. The BoJ, holding 43.3% of JGBs as of January 2025, has underpinned this system through massive bond purchases, ensuring low yields even as debt ballooned to 1.35 quadrillion yen ($8.84 trillion).
However, this captive market is no longer captive. The May 2025 auctions revealed a stark reality: investors are recoiling. The 20-year JGB auction saw a bid-to-cover ratio—the measure of demand—plummet to its lowest since 2012, with the spread between investor bids and government offers (the “tail”) reaching its worst level since 1987. Yields on 20-year bonds hit 2.555% (highest since 2000), 30-year bonds reached 3.185% (a record since 1999), and 40-year bonds surged to 3.635% (an all-time high). These spikes reflect a market no longer willing to absorb Japan’s debt at suppressed yields.
The End of Yield Curve Control
The BoJ’s yield curve control (YCC) policy, introduced in 2016, capped 10-year JGB yields to maintain low borrowing costs. By purchasing bonds en masse, the BoJ suppressed volatility and ensured market liquidity. However, as inflation rose above the BoJ’s 2% target (reaching 3.6% overall CPI in 2025), the central bank began tapering its purchases, signaling a shift from ultra-loose policy.
This tapering has exposed the fragility of YCC. The long end of the yield curve—30- and 40-year bonds—is most sensitive to inflation and fiscal risk. As the BoJ steps back, market forces are driving yields higher, undermining the central bank’s control. The lack of buyers for super-long JGBs highlights a crisis of confidence in Japan’s fiscal sustainability, exacerbated by Prime Minister Shigeru Ishiba’s comparison of Japan’s fiscal state to Greece’s during its 2010 debt crisis.
Fiscal Recklessness and Political Inertia
Japan’s debt-to-GDP ratio, at 263%, is among the highest globally. Decades of deficit spending, fueled by quantitative easing and political reluctance to implement austerity, have created a fiscal powder keg. Calls for consumption tax cuts ahead of the July 2025 upper house election further erode investor trust, as they signal increased borrowing without structural reforms. Prime Minister Ishiba’s resistance to these cuts has done little to restore confidence, as markets demand a credible path to fiscal balance.
Global Implications: The Yen Carry Trade and Liquidity Shock
The Collapse of the Yen Carry Trade
The yen carry trade—borrowing in low-yielding yen to invest in higher-yielding foreign assets—has been a cornerstone of global liquidity since the 1990s. Japanese investors, seeking returns unavailable domestically, poured trillions into US Treasuries, emerging market bonds, and other assets. However, rising JGB yields are reversing this flow. As Japanese yields approach or exceed foreign yields (e.g., 30-year JGBs at 3.185% vs. US 30-year Treasuries at 5%), investors are repatriating capital, unwinding carry trades.
This unwinding is a global margin call. Emerging markets, reliant on Japanese capital, face sudden outflows, increasing FX volatility. The yen’s strengthening, as capital returns to Japan, disrupts global currency markets. In the US, the Treasury market—dependent on foreign buyers like Japan—faces pressure as Japanese institutions sell or reduce purchases of US bonds.
Echoes in the US Treasury Market
The US is not immune. A recent 20-year Treasury auction saw weak demand, with primary dealers absorbing 17% of issuance—a sign of desperation. The 30-year Treasury yield has climbed above 5.1%, reflecting rising borrowing costs. Moody’s downgrade of US debt to Aa1 from Aaa, citing a $36 trillion debt burden and unsustainable deficits, has amplified concerns.
President Trump’s proposed “One Big Beautiful Bill Act,” reviving 2017 tax cuts, is projected to add $3.3 trillion to US debt by 2034, pushing the debt-to-GDP ratio to 125%. With $9 trillion in US debt maturing within the next 12 months, the Treasury market faces a refinancing challenge of unprecedented scale. If foreign buyers, including Japanese institutions, step back, the US could face a structural demand breakdown, forcing higher yields and tightening financial conditions.
The Sovereign Debt Crisis Blueprint
Japan as the Fuse, US as the Bomb
Japan’s bond market crisis is a blueprint for what could unfold in the US. Both nations share structural vulnerabilities: high debt-to-GDP ratios, reliance on central bank intervention, and political dysfunction. Japan’s breakdown demonstrates that even a captive market can rebel when trust erodes. The BoJ’s loss of control over the yield curve mirrors potential risks for the Federal Reserve, which faces rising long-end yields despite its efforts to manage expectations.
The metaphor of Japan as the fuse and the US as the bomb is apt. Japan’s crisis is a warning shot, but the US—given its role as the world’s largest bond market ($51 trillion) and the dollar’s reserve currency status—represents a far larger systemic risk. A US debt crisis would disrupt global bond markets, equity valuations (e.g., the S&P 500’s recent wobble), and liquidity flows.
The Role of Bond Vigilantes
Bond vigilantes—investors who sell bonds to discipline profligate governments—are reawakening. In Japan, their absence from JGB auctions signals a rejection of fiscal recklessness. In the US, rising Treasury yields and weak auction demand suggest vigilantes are saddling up. Central banks’ ability to suppress yields is waning, exposing markets to the harsh reality of supply and demand.
The US Dollar and Gold: A Shifting Landscape
The Dollar’s Eroding Trust
The US dollar’s dominance is not immediately threatened—neither the euro nor the renminbi offers a viable alternative due to fragmentation and control, respectively. However, self-inflicted wounds—fiscal recklessness, political gridlock, and the dollar’s weaponization in trade disputes—are eroding trust. A structural breakdown in Treasury demand, driven by Japan’s repatriation or global risk repricing, could push US borrowing costs higher, weakening the dollar’s appeal.
Gold as a Judgment on Fiat
Gold is resurging as a safe-haven asset amid this turmoil. Unlike sovereign bonds, gold offers no coupon, no intervention, and no deficits—it simply exists. As trust in central banks and fiat currencies falters, gold’s appeal grows. Bitcoin, another scarce asset, has hit $107,322, reflecting similar dynamics, but gold’s historical stability and lack of counterparty risk make it a preferred hedge. Analysts like Stack Hodler argue that central bank credibility is “shattering in real time,” driving demand for gold and other neutral assets.
Conclusion: Preparing for the Exit
Japan’s bond market breakdown is not an isolated event—it’s a warning for the global financial system. The BoJ’s loss of yield curve control, the collapse of the yen carry trade, and the erosion of fiscal credibility signal the end of an era of sovereign bond repression. The US, with its ballooning debt and reliance on foreign buyers, is on a similar trajectory. As trust in central planning wanes, capital will flee to assets like gold, which stand outside the fiat system.
Investors must prepare an exit plan. Diversifying into gold, reducing exposure to long-dated bonds, and monitoring central bank actions are critical steps. Japan’s crisis is the fuse; the US could be the bomb. When trust in sovereign debt crumbles, the question isn’t whether the system will break—it’s how long until detonation.
References
Reuters: Japan's super-long bond yields soar to records as market frets about demand
IndraStra: From Safe Haven to Fault Line: How Japan’s Bond Crisis Threatens Global Markets
American Thinker: Bond Market Shock: Is a New Financial Crisis Looming?
Wikipedia: National debt of Japan
Wolf Street: Japan’s 30-Year and 40-Year Bonds Crater, Yields Spike
@onechancefreedm: Japan Is the Fuse. The U.S. Is the Bomb
@DarioCpx: The BOJ losing control of long-term JGB Yields
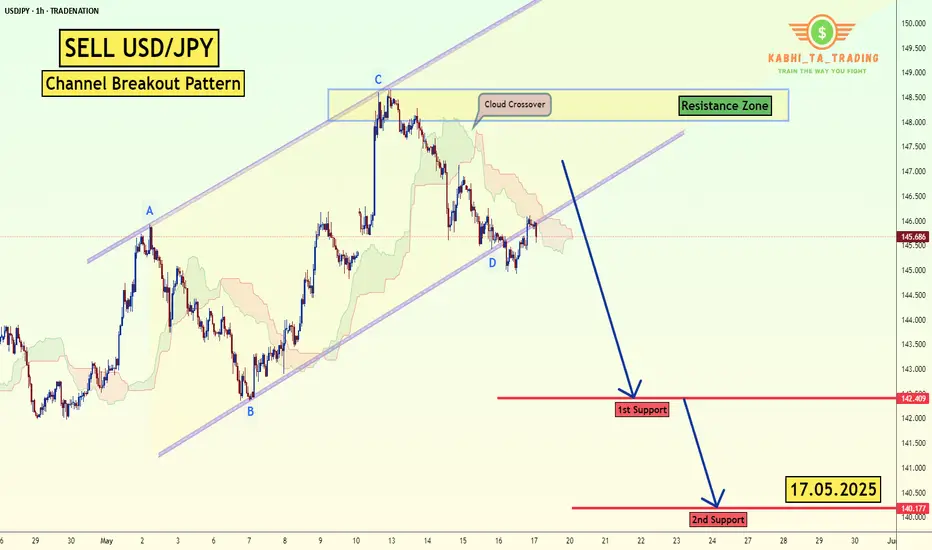
USD/JPY - H1 - Channel Breakout (17.05.2025) The Pair on the H1 timeframe presents a Potential Selling Opportunity due to a recent Formation of a Channel Breakout Pattern. This suggests a shift in momentum towards the downside in the coming hours.
Possible Short Trade:
Entry: Consider Entering A Short Position around Trendline Of The Pattern.
Target Levels:
1st Support – 142.40
2nd Support – 140.17
🎁 Please hit the like button and
🎁 Leave a comment to support for My Post !
Your likes and comments are incredibly motivating and will encourage me to share more analysis with you.
Best Regards, KABHI_TA_TRADING
Thank you.
Disclosure: I am part of Trade Nation's Influencer program and receive a monthly fee for using their TradingView charts in my analysis.
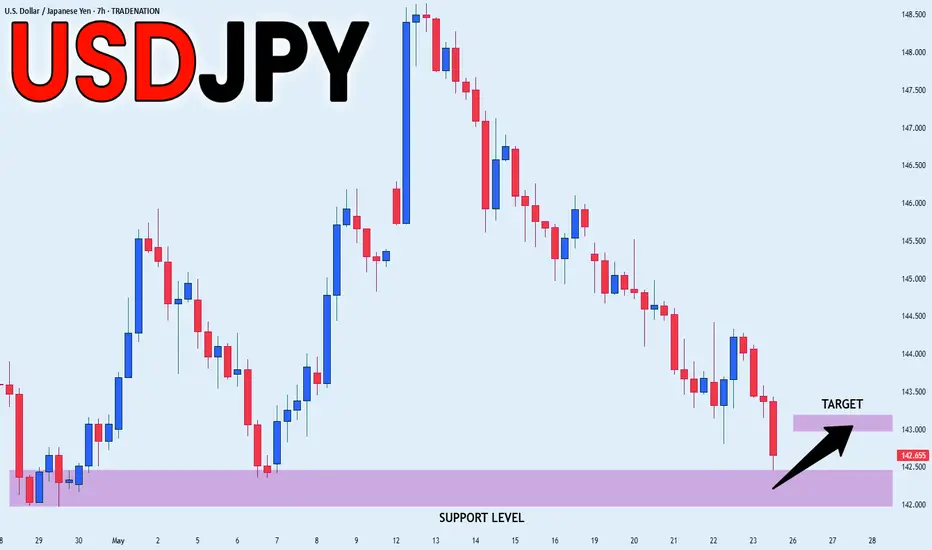
USD_JPY SUPPORT AHEAD|LONG|
✅USD_JPY is going down now
But a strong support level is ahead at 142.000
Thus I am expecting a rebound
And a move up towards the target of 143.000
LONG🚀
✅Like and subscribe to never miss a new idea!✅
Disclosure: I am part of Trade Nation's Influencer program and receive a monthly fee for using their TradingView charts in my analysis.
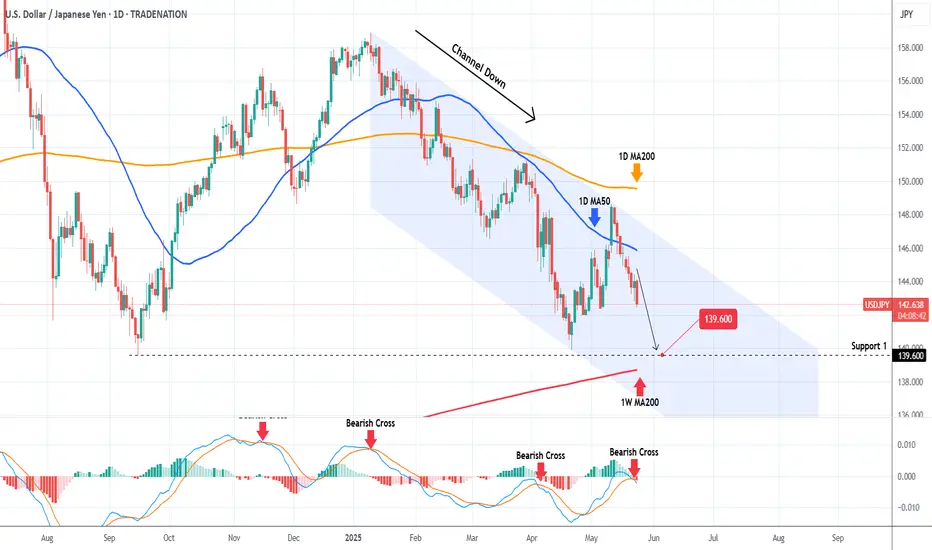
USDJPY Channel Down rejection aiming for the 2024 Support.The USDJPY pair has been trading within a Channel Down pattern since the January 10 2025 High and right now is on its latest Bearish Leg, an outcome of the rejection near the 1D MA200 (orange trend-line).
This has also been confirmed by the 1D MACD Bearish Cross and the next technical Support is on 139.600. By the time it gets tested, the price may also make contact with the 1W MA200 (red trend-line). Our short-term Target is 139.600.
-------------------------------------------------------------------------------
** Please LIKE 👍, FOLLOW ✅, SHARE 🙌 and COMMENT ✍ if you enjoy this idea! Also share your ideas and charts in the comments section below! This is best way to keep it relevant, support us, keep the content here free and allow the idea to reach as many people as possible. **
-------------------------------------------------------------------------------
Disclosure: I am part of Trade Nation's Influencer program and receive a monthly fee for using their TradingView charts in my analysis.
💸💸💸💸💸💸
👇 👇 👇 👇 👇 👇
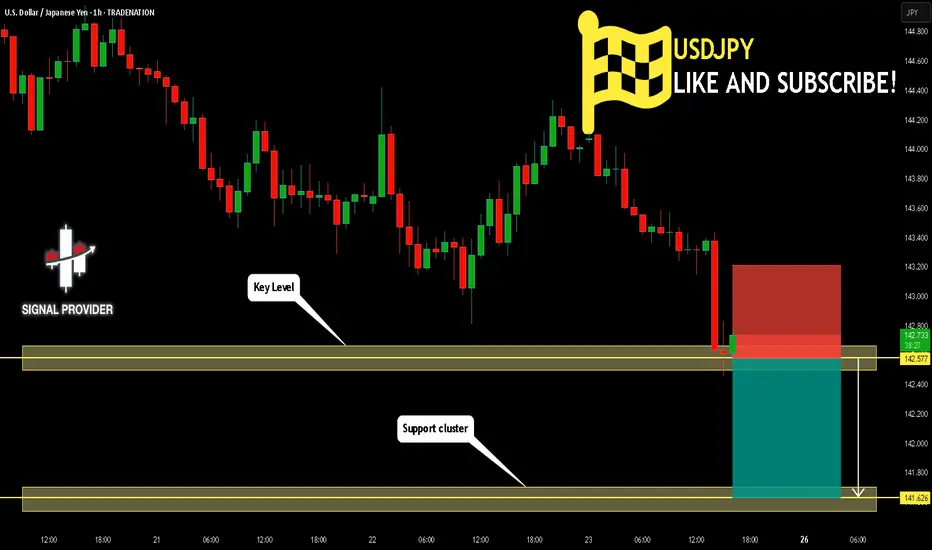
USDJPY Will Move Lower! Short!
Here is our detailed technical review for USDJPY.
Time Frame: 1h
Current Trend: Bearish
Sentiment: Overbought (based on 7-period RSI)
Forecast: Bearish
The market is approaching a significant resistance area 142.577.
Due to the fact that we see a positive bearish reaction from the underlined area, I strongly believe that sellers will manage to push the price all the way down to 141.626 level.
P.S
Please, note that an oversold/overbought condition can last for a long time, and therefore being oversold/overbought doesn't mean a price rally will come soon, or at all.
Disclosure: I am part of Trade Nation's Influencer program and receive a monthly fee for using their TradingView charts in my analysis.
Like and subscribe and comment my ideas if you enjoy them!
Yen Strengthens on Dollar WeaknessThe Japanese yen firmed to around 143.6 per dollar, heading for a weekly gain of over 1% as inflation data came in stronger than expected. Core inflation surged to 3.5%, its highest in more than two years, while headline inflation held at 3.6%, reinforcing expectations that the BoJ may maintain its tightening stance.
The yen also benefited from continued dollar weakness tied to U.S. fiscal worries. Earlier, Japan’s Finance Minister Katsunobu Kato denied discussing exchange rates with U.S. Treasury Secretary Bessent at the G7 summit, dismissing rumors of joint currency intervention.
USD/JPY faces resistance at 148.60, with further upside levels at 149.80 and 151.20. Key support lies at 139.70, then 137.00 and 135.00.
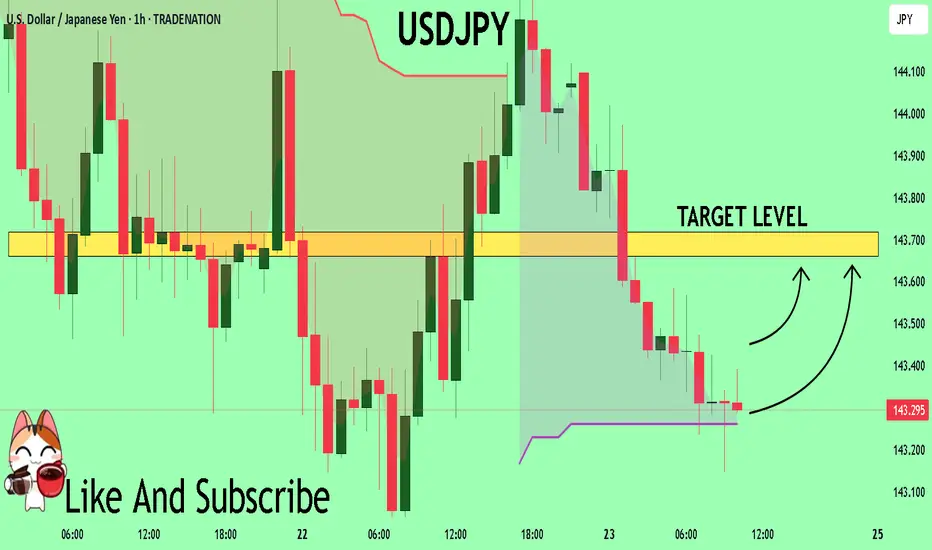
USDJPY Will Explode! BUY!
My dear subscribers,
USDJPY looks like it will make a good move, and here are the details:
The market is trading on 143.33 pivot level.
Bias - Bullish
Technical Indicators: Both Super Trend & Pivot HL indicate a highly probable Bullish continuation.
Target - 143.66
About Used Indicators:
The average true range (ATR) plays an important role in 'Supertrend' as the indicator uses ATR to calculate its value. The ATR indicator signals the degree of price volatility.
Disclosure: I am part of Trade Nation's Influencer program and receive a monthly fee for using their TradingView charts in my analysis.
———————————
WISH YOU ALL LUCK
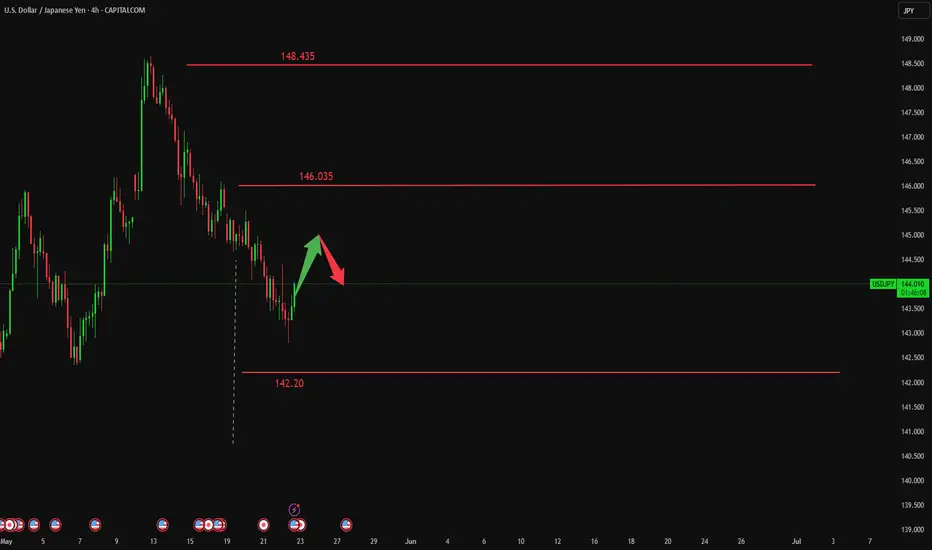
USDJPY Analysis todayHello traders, this is a complete multiple timeframe analysis of this pair. We see could find significant trading opportunities as per analysis upon price action confirmation we may take this trade. Smash the like button if you find value in this analysis and drop a comment if you have any questions or let me know which pair to cover in my next analysis.

USDJPY H4 I Bullish Reversal Based on the H4 chart analysis, the price is falling toward our buy entry level at 142.57, a pullback support.
Our take profit is set at 143.57 a pullback resistance.
The stop loss is placed at 141.69, below the 161.8% Fibonacci extension.
Disclaimer
High Risk Investment Warning
Trading Forex/CFDs on margin carries a high level of risk and may not be suitable for all investors. Leverage can work against you.
Stratos Markets Limited (tradu.com ):
CFDs are complex instruments and come with a high risk of losing money rapidly due to leverage. 63% of retail investor accounts lose money when trading CFDs with this provider. You should consider whether you understand how CFDs work and whether you can afford to take the high risk of losing your money.
Stratos Europe Ltd (tradu.com ):
CFDs are complex instruments and come with a high risk of losing money rapidly due to leverage. 63% of retail investor accounts lose money when trading CFDs with this provider. You should consider whether you understand how CFDs work and whether you can afford to take the high risk of losing your money.
Stratos Global LLC (tradu.com ):
Losses can exceed deposits.
Please be advised that the information presented on TradingView is provided to Tradu (‘Company’, ‘we’) by a third-party provider (‘TFA Global Pte Ltd’). Please be reminded that you are solely responsible for the trading decisions on your account. There is a very high degree of risk involved in trading. Any information and/or content is intended entirely for research, educational and informational purposes only and does not constitute investment or consultation advice or investment strategy. The information is not tailored to the investment needs of any specific person and therefore does not involve a consideration of any of the investment objectives, financial situation or needs of any viewer that may receive it. Kindly also note that past performance is not a reliable indicator of future results. Actual results may differ materially from those anticipated in forward-looking or past performance statements. We assume no liability as to the accuracy or completeness of any of the information and/or content provided herein and the Company cannot be held responsible for any omission, mistake nor for any loss or damage including without limitation to any loss of profit which may arise from reliance on any information supplied by TFA Global Pte Ltd.
The speaker(s) is neither an employee, agent nor representative of Tradu and is therefore acting independently. The opinions given are their own, constitute general market commentary, and do not constitute the opinion or advice of Tradu or any form of personal or investment advice. Tradu neither endorses nor guarantees offerings of third-party speakers, nor is Tradu responsible for the content, veracity or opinions of third-party speakers, presenters or participants.

USD/JPY Analysis: Bearish Bias with Multi-Market Confluence!📉 USDJPY Technical Breakdown – Yen Strength in Focus 📉
In this video, we take a close look at the USD/JPY, which is currently under pressure and trending to the downside 🔽. The bearish momentum is clear, but there are several key factors to consider before positioning ourselves for a potential short 📊.
🔍 First, it’s important to monitor the equity markets. If we start to see a pullback or sell-off in the stock indices 🏦📉, that could translate into further yen strength, adding weight to a USD/JPY short bias 💴💪.
Another key piece of confluence is comparing the DXY (Dollar Index) 📈 with the JXY (Japanese Yen Index) 📉. This gives us deeper insight into the relative strength of each currency and helps confirm our directional bias before entering a trade ⚖️.
🔁 Coming back to the USD/JPY chart, we’re watching for a retracement into a Fibonacci point of interest, which could provide a high-probability area to enter a sell setup. If price reacts from that level and confirms with structure, we could have a clean opportunity for continuation 🔂🎯.
⚠️ This is not financial advice — always conduct your own analysis and manage risk accordingly.

Bearish drop?USD/JPY is rising towards the pivot and could reverse to the pullback support.
Pivot: 145.18
1st Support: 142.56
1st Resistance: 146.70
Risk Warning:
Trading Forex and CFDs carries a high level of risk to your capital and you should only trade with money you can afford to lose. Trading Forex and CFDs may not be suitable for all investors, so please ensure that you fully understand the risks involved and seek independent advice if necessary.
Disclaimer:
The above opinions given constitute general market commentary, and do not constitute the opinion or advice of IC Markets or any form of personal or investment advice.
Any opinions, news, research, analyses, prices, other information, or links to third-party sites contained on this website are provided on an "as-is" basis, are intended only to be informative, is not an advice nor a recommendation, nor research, or a record of our trading prices, or an offer of, or solicitation for a transaction in any financial instrument and thus should not be treated as such. The information provided does not involve any specific investment objectives, financial situation and needs of any specific person who may receive it. Please be aware, that past performance is not a reliable indicator of future performance and/or results. Past Performance or Forward-looking scenarios based upon the reasonable beliefs of the third-party provider are not a guarantee of future performance. Actual results may differ materially from those anticipated in forward-looking or past performance statements. IC Markets makes no representation or warranty and assumes no liability as to the accuracy or completeness of the information provided, nor any loss arising from any investment based on a recommendation, forecast or any information supplied by any third-party.

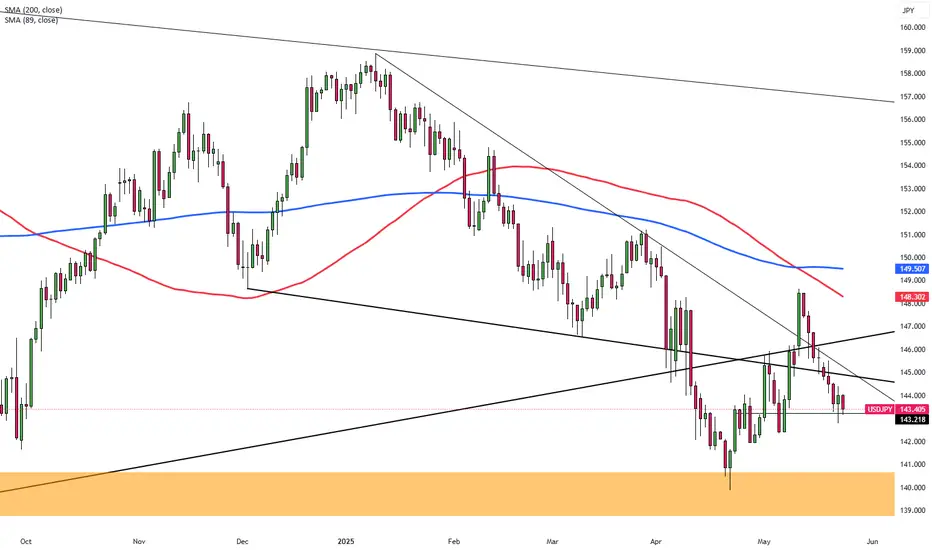
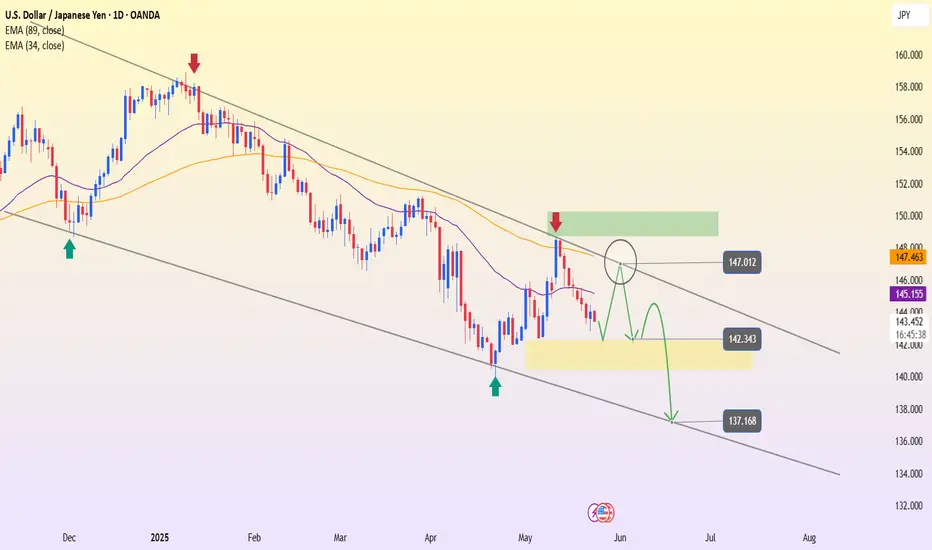
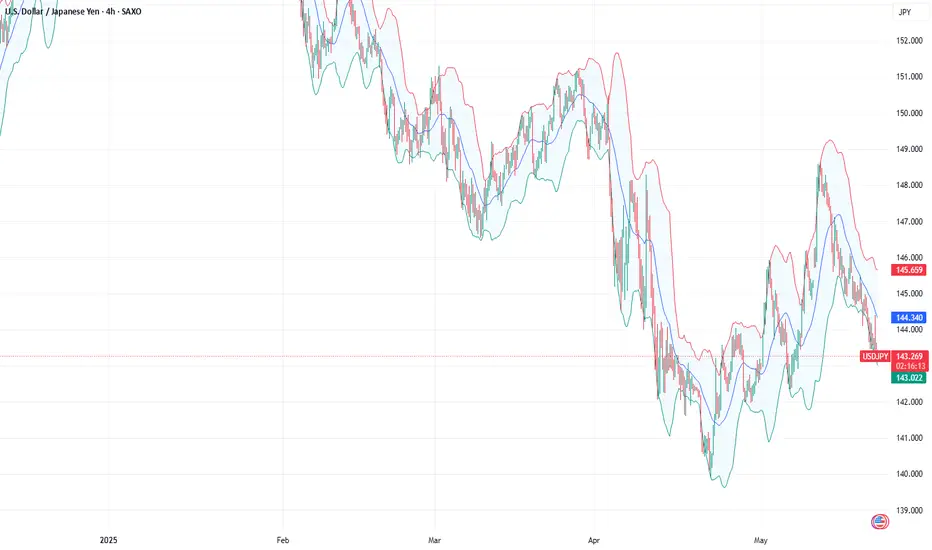
USDJPY – The downtrend continues, channel still leads the wayLooking at the D1 chart, USDJPY remains firmly within the descending channel that has persisted since the end of 2024. Every time the price approaches the upper boundary of the channel, selling pressure reappears – and the recent touch around the 147.012 area is no exception.
After being rejected at this strong resistance zone, the price has turned lower and is now forming a pullback structure within the prevailing trend. EMA34 and EMA89 continue to slope downward, reinforcing the bearish momentum.
If the price gets rejected again around the 145–146 region, the correction pattern may complete, opening up room for a drop toward the support zone at 142.343, or even deeper toward the channel bottom near 137.168.
In summary, the primary trend remains bearish – and the preferred strategy now is "sell on rally" when the price nears the upper resistance of the channel. Patience and watching for price action will be key.
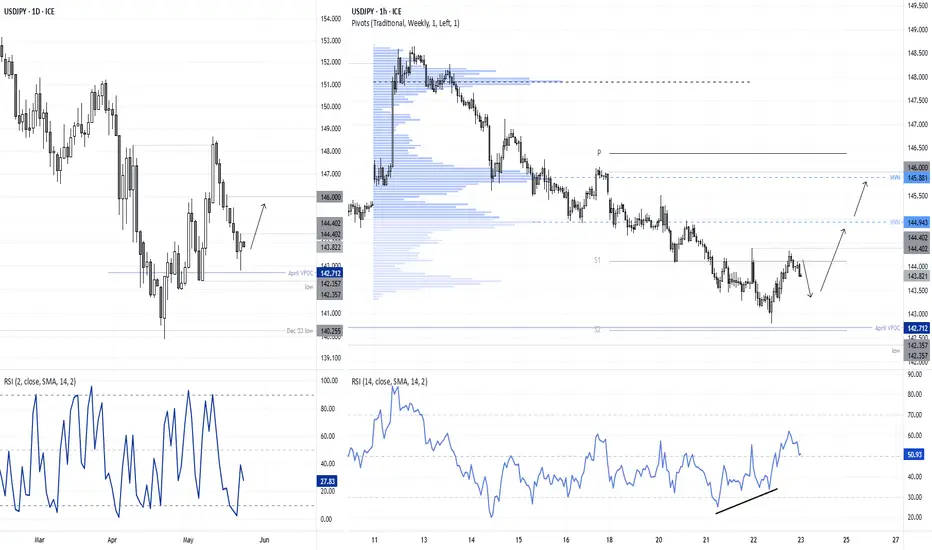
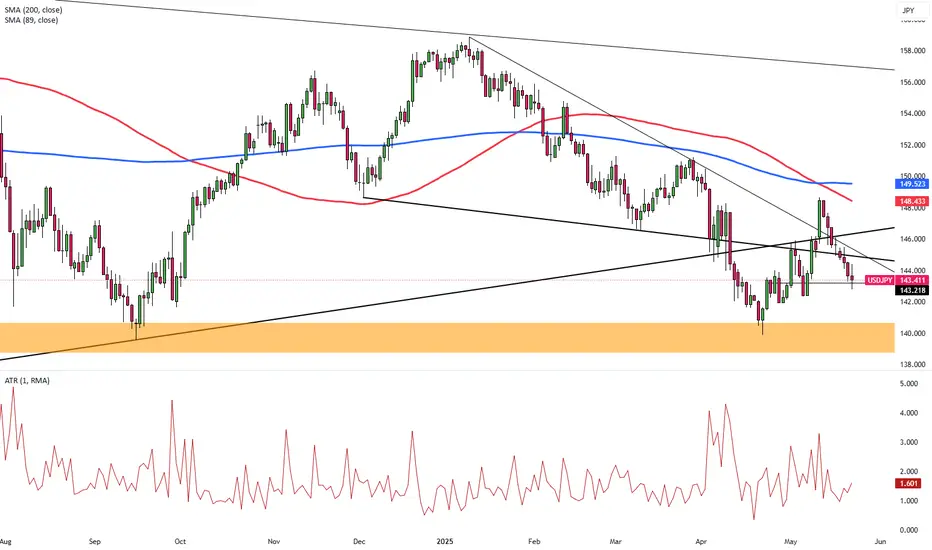
USD/JPY Rebounds from Support — Bulls Back in Play?USD/JPY looks like it’s found its feet. After tagging support near the April VPOC (142.71) and 6 May low (142.36), Thursday’s session printed the first bullish candle in over a week — a spinning top just above key support.
The daily RSI (2) bounced from its most oversold reading in a month, and the 1-hour chart shows bullish divergence on the RSI (14), now comfortably above 50.
Price has lifted from the monthly S2 and is circling S1. If USD/JPY can push through yesterday’s high (144.40), I’m looking toward 145, 145.86 and potentially the 146 handle, which aligns with the monthly pivot at 146.38.
** Please note that Japan's CPI data drops in ~25 mins **
Matt Simpson, Market Analyst at City Index and Forex.com
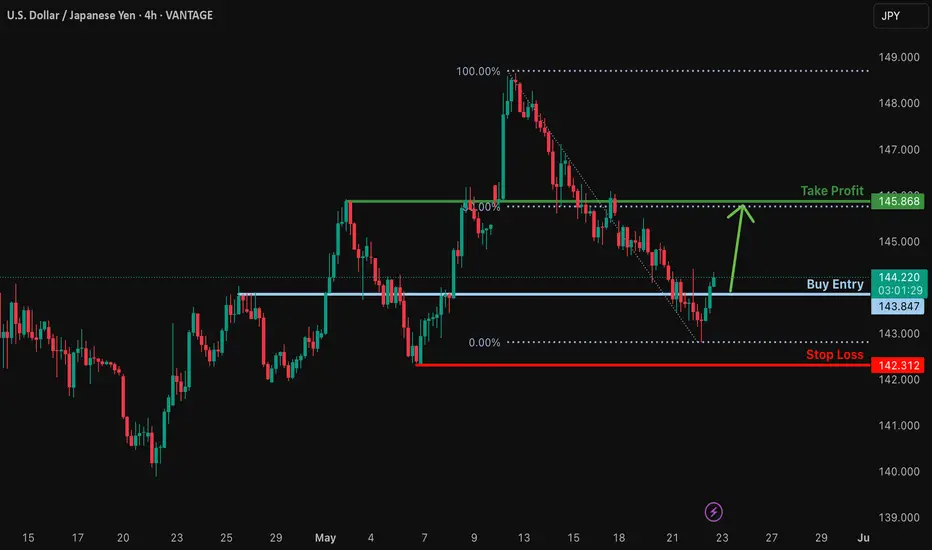
Potential bullish rise?USD/JPY is reacting off the support level which is a pullback support and could rise from this level to our take profit.
Entry: 143.84
Why we like it:
There is a pullback support level.
Stop loss: 142.31
Why we like it:
There is a pullback support level.
Take profit: 145.86
Why we like it:
There is a pullback resistance level that aligns with the 50% Fibonacci retracement.
Enjoying your TradingView experience? Review us!
Please be advised that the information presented on TradingView is provided to Vantage (‘Vantage Global Limited’, ‘we’) by a third-party provider (‘Everest Fortune Group’). Please be reminded that you are solely responsible for the trading decisions on your account. There is a very high degree of risk involved in trading. Any information and/or content is intended entirely for research, educational and informational purposes only and does not constitute investment or consultation advice or investment strategy. The information is not tailored to the investment needs of any specific person and therefore does not involve a consideration of any of the investment objectives, financial situation or needs of any viewer that may receive it. Kindly also note that past performance is not a reliable indicator of future results. Actual results may differ materially from those anticipated in forward-looking or past performance statements. We assume no liability as to the accuracy or completeness of any of the information and/or content provided herein and the Company cannot be held responsible for any omission, mistake nor for any loss or damage including without limitation to any loss of profit which may arise from reliance on any information supplied by Everest Fortune Group.
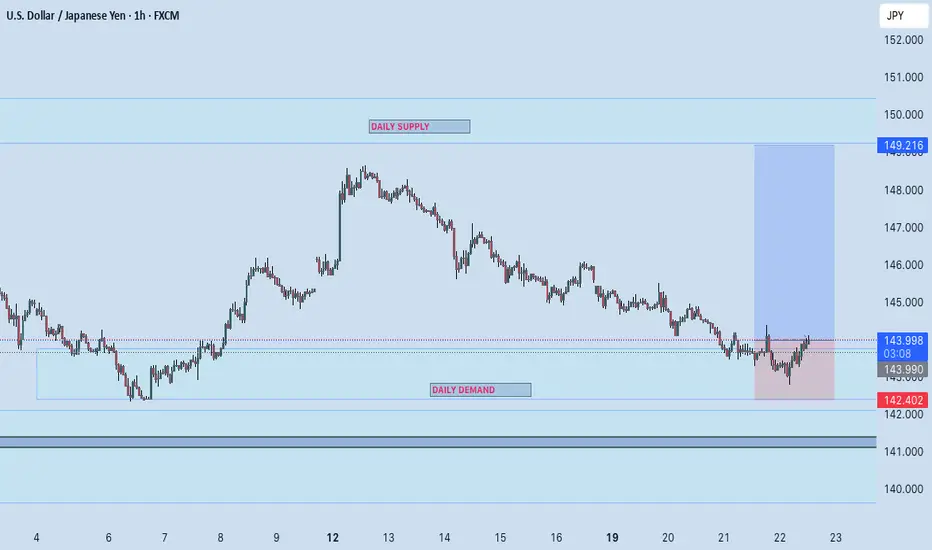
UPDATE ON USDJPY Buy Bias Analysis – May 2025Earlier this week, I maintained a bullish bias on USDJPY after the price reversed from the weekly demand zone at 139.901 on April 21, 2025, supported by bullish seasonality and strong institutional positioning.
However, during the first three days of this week, USDJPY pulled back to around 142.814, moving below the initial point of interest. This short-term bearish move tested sentiment, but price has now reached a daily demand zone, where a bullish indecision candle is currently forming.
This candle signals a potential shift in momentum, suggesting that the bulls may be regaining control. With the seasonal trend, institutional long positions, and a technical support zone aligning, the setup remains valid — only delayed.
The Yen's recent strength, driven by its safe-haven appeal, is likely to fade as the USD begins to assert dominance once again. This sets the stage for a possible continuation of the broader bullish move.
I maintain my buy bias on USDJPY, with a focus on price action confirmation at current levels.
FOLLOW ME FOR WEEKLY BIAS.
Analysis of USD/JPYDuring the European session, USD/JPY recovered its early losses and traded flat near 143.50. After three consecutive days of declines, the US dollar attracted buying interest on Thursday, pushing the pair higher. Against the backdrop of rising safe-haven demand for the Japanese yen and a generally weak US dollar, USD/JPY had fallen to a two-week low. The yen also benefited from upbeat machinery order data, which overshadowed recession concerns and boosted hopes for an economic recovery. This provided support for the Bank of Japan (BOJ) to further raise interest rates. Combined with sustained safe-haven buying, this has kept the yen strong.
In the market, there are no absolutes, and neither upward nor downward trends are set in stone. Therefore, the ability to judge the balance between market gains and losses is your key to success. Let money become our loyal servant.
JPY Hits 2-Week High as Dollar WeakensThe Japanese yen strengthened to around 143 per dollar on Thursday, its highest in over two weeks, as concerns over the U.S. fiscal outlook pressured the dollar. Fears that Trump’s proposed tax cuts could add over $3 trillion to U.S. debt weighed on investor confidence.
Japan’s Finance Minister Kato said he did not discuss currency levels with Treasury Secretary Bessent at the G7 summit.
Domestically, core machinery orders surged 13% in March, beating expectations of a 1.6% drop, while May PMI data showed continued weakness in both manufacturing and services.
USD/JPY H1 | Bearish downtrend to extend further?USD/JPY is rising towards an overlap resistance and could potentially reverse off this level to drop lower.
Sell entry is at 143.50 which is an overlap resistance.
Stop loss is at 144.50 which is a level that sits above the 23.6% Fibonacci retracement and a swing-high resistance.
Take profit is at 142.35 which is a swing-low support.
High Risk Investment Warning
Trading Forex/CFDs on margin carries a high level of risk and may not be suitable for all investors. Leverage can work against you.
Stratos Markets Limited (tradu.com ):
CFDs are complex instruments and come with a high risk of losing money rapidly due to leverage. 63% of retail investor accounts lose money when trading CFDs with this provider. You should consider whether you understand how CFDs work and whether you can afford to take the high risk of losing your money.
Stratos Europe Ltd (tradu.com ):
CFDs are complex instruments and come with a high risk of losing money rapidly due to leverage. 63% of retail investor accounts lose money when trading CFDs with this provider. You should consider whether you understand how CFDs work and whether you can afford to take the high risk of losing your money.
Stratos Global LLC (tradu.com ):
Losses can exceed deposits.
Please be advised that the information presented on TradingView is provided to Tradu (‘Company’, ‘we’) by a third-party provider (‘TFA Global Pte Ltd’). Please be reminded that you are solely responsible for the trading decisions on your account. There is a very high degree of risk involved in trading. Any information and/or content is intended entirely for research, educational and informational purposes only and does not constitute investment or consultation advice or investment strategy. The information is not tailored to the investment needs of any specific person and therefore does not involve a consideration of any of the investment objectives, financial situation or needs of any viewer that may receive it. Kindly also note that past performance is not a reliable indicator of future results. Actual results may differ materially from those anticipated in forward-looking or past performance statements. We assume no liability as to the accuracy or completeness of any of the information and/or content provided herein and the Company cannot be held responsible for any omission, mistake nor for any loss or damage including without limitation to any loss of profit which may arise from reliance on any information supplied by TFA Global Pte Ltd.
The speaker(s) is neither an employee, agent nor representative of Tradu and is therefore acting independently. The opinions given are their own, constitute general market commentary, and do not constitute the opinion or advice of Tradu or any form of personal or investment advice. Tradu neither endorses nor guarantees offerings of third-party speakers, nor is Tradu responsible for the content, veracity or opinions of third-party speakers, presenters or participants.

Fundamental Market Analysis for May 22, 2025 USDJPYEvents to pay attention to today:
15:30 EET. USD - Unemployment Claims
16:45 EET. USD - Services PMI
USDJPY:
The Japanese Yen (JPY) demonstrated resilience by rebounding from an early decline during the Asian trading session. This recovery was largely influenced by positive machinery orders data from Japan, which effectively quashed recession fears and significantly bolstered expectations of an economic recovery. This occurred in anticipation of the Bank of Japan (BoJ) potentially raising interest rates again in 2025, which would have been a positive development for the JPY. Furthermore, flight to safety is identified as a contributing factor to the strengthening of the yen.
The proposed tax bill introduced by US President Donald Trump has led to concerns regarding the financial stability of the US government. This, in addition to the resurgence of tensions between the US and China, is exerting downward pressure on global risk sentiment and prompting investors to seek refuge in traditional safe haven assets, including the yen. This, coupled with the prevailing US Dollar (USD) selling bias, has led to the USD/JPY pair reaching a two-week low, approaching the round figure of 143.00 on Thursday.
Trade recommendation: SELL 143.100, SL 143.700, TP 142.350
UJ Could Tumble Back To 140 If Bears Take Expanding RangeToday FX:USDJPY Sellers make a Breakout of the Rising Support of the Expanding Range it's been trading in since the Low that started the range back on April 22nd.
An Expanding Range is typically considered a Continuation Pattern suggesting that if Sellers can hold price under the Rising Support, we can suspect JPY to overcome USD in this pair pulling price down continuing the Downtrend it was in prior to entering the pattern.
Once the Breakout of Consolidation is Validated, a Breakout & Retest of the Rising Support could deliver potential Short Opportunities to take price down to the Low of the Range.
Fundamentally, there is a lot of worry about the fall out of Tariff Talks with important trade partners with the 90-Day grace period soon coming to an end, weakening labor market potentially signaling "Stagflation" and additionally, it is suspected that Trump's Tax Cut Bill could add $3 - $5 Trillion to the $36.2 Trillion debt the US is already suffering from, further harming the Dollar.
-https://tradingview.sweetlogin.com/news/reuters.com,2025:newsml_L1N3RT018:0-dollar-on-defensive-as-traders-eye-trump-tax-bill-g7-currency-talks/
-https://tradingview.sweetlogin.com/news/te_news:459470:0-dollar-extends-losses/
