UJ Could Tumble Back To 140 If Bears Take Expanding RangeToday FX:USDJPY Sellers make a Breakout of the Rising Support of the Expanding Range it's been trading in since the Low that started the range back on April 22nd.
An Expanding Range is typically considered a Continuation Pattern suggesting that if Sellers can hold price under the Rising Support, we can suspect JPY to overcome USD in this pair pulling price down continuing the Downtrend it was in prior to entering the pattern.
Once the Breakout of Consolidation is Validated, a Breakout & Retest of the Rising Support could deliver potential Short Opportunities to take price down to the Low of the Range.
Fundamentally, there is a lot of worry about the fall out of Tariff Talks with important trade partners with the 90-Day grace period soon coming to an end, weakening labor market potentially signaling "Stagflation" and additionally, it is suspected that Trump's Tax Cut Bill could add $3 - $5 Trillion to the $36.2 Trillion debt the US is already suffering from, further harming the Dollar.
-https://tradingview.sweetlogin.com/news/reuters.com,2025:newsml_L1N3RT018:0-dollar-on-defensive-as-traders-eye-trump-tax-bill-g7-currency-talks/
-https://tradingview.sweetlogin.com/news/te_news:459470:0-dollar-extends-losses/
USDJPY

USDJPY Long Setup: Triple Confluence Zone Locked InSmart money traders love one thing more than anything — confluence. This BTCUSD setup hits all the marks:
📈 Structure Breakdown:
Market breaks structure to the upside ✅
Impulsive bullish leg breaks prior high ✅
Pullback into 61.8% golden zone + OB ✅
Rejection wick = perfect entry confirmation ✅
This is a high-probability continuation setup after BTC made a clear bullish BOS (Break of Structure) on the M30 timeframe.
🟦 Order Block Zone:
OB Range:
Top: ~106,989
Bottom: ~106,759
This OB was the last down candle before the big bullish impulse that broke structure. Price returned to mitigate here, then instantly rejected = Smart Money entry confirmed 🔒
🧮 Fibonacci Levels:
61.8%: Sliced right into it
70.5% – 79%: Deeper liquidity zone just below
The entry wick taps right into the sweet OB/Fib confluence zone and launches 🚀. It’s giving sniper precision with a low drawdown entry.
🎯 Trade Parameters:
Entry: ~106,759
SL: Below the OB zone
TP: 108,022 (previous high)
That’s an RRR of around 3.5–4.0x — a clean asymmetric play, just the way smart money wants it.
🔍 Confirmation Factors:
Bullish BOS on M30
Price returns to OB zone + golden ratio
Clean rejection candle with demand absorption
No internal structure break = bullish narrative still valid
🧠 Key Lesson:
“When OB meets Fibonacci, don’t ask why. Load up — the market just told you why.”
Let setups like this come to you. No chasing, no emotions. Let the algo-driven footprints guide you to the money.
📈 Missed this one? Save it for your playbook — this is how high-probability trades are built.
Drop a 💰 if you caught the same move!
Mid-Week FOREX Forecast: Will The USD Remain Weak?In this video, we will update Sunday's forecasts mid-week, and look for valid setup for the rest of the week ahead. The following FX markets will be analyzed:
In this video, we will analyze the following FX Majors markets:
USD Index
EUR
GBP
AUD
NZD
CAD
CHF
JPY
The expected short term bearishness in the USD came, but will it continue for the rest of the week? Wait patiently for the market to tip its hand, and trade accordingly. Have a plan in place if the protected low at 99.172 holds or folds.
Enjoy!
May profits be upon you.
Leave any questions or comments in the comment section.
I appreciate any feedback from my viewers!
Like and/or subscribe if you want more accurate analysis.
Thank you so much!
Disclaimer:
I do not provide personal investment advice and I am not a qualified licensed investment advisor.
All information found here, including any ideas, opinions, views, predictions, forecasts, commentaries, suggestions, expressed or implied herein, are for informational, entertainment or educational purposes only and should not be construed as personal investment advice. While the information provided is believed to be accurate, it may include errors or inaccuracies.
I will not and cannot be held liable for any actions you take as a result of anything you read here.
Conduct your own due diligence, or consult a licensed financial advisor or broker before making any and all investment decisions. Any investments, trades, speculations, or decisions made on the basis of any information found on this channel, expressed or implied herein, are committed at your own risk, financial or otherwise.

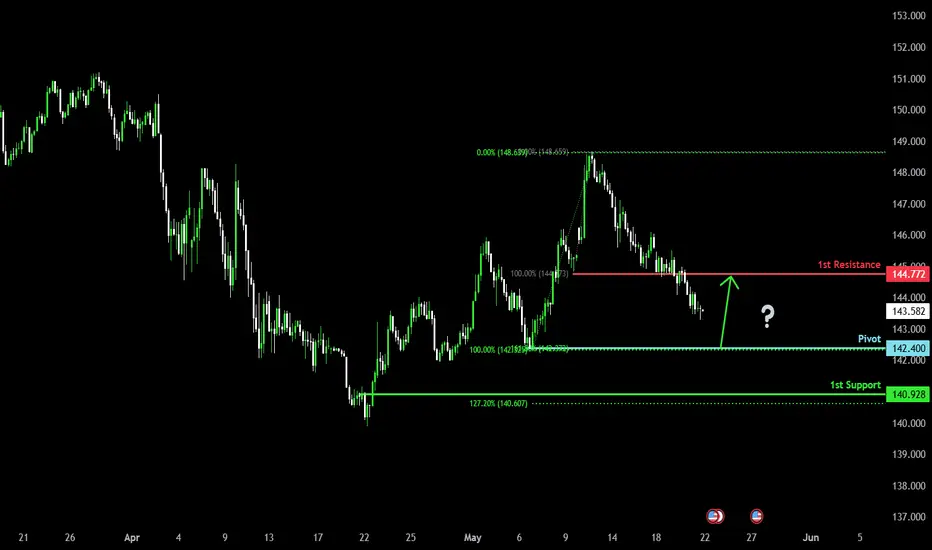
Falling towards pullback support?USDJPY is falling towards the pivot which is a pullback support and could bounce to the 1st resistance.
Pivot: 142.400
1st Support: 140.92
1st Resistance: 144.77
Risk Warning:
Trading Forex and CFDs carries a high level of risk to your capital and you should only trade with money you can afford to lose. Trading Forex and CFDs may not be suitable for all investors, so please ensure that you fully understand the risks involved and seek independent advice if necessary.
Disclaimer:
The above opinions given constitute general market commentary, and do not constitute the opinion or advice of IC Markets or any form of personal or investment advice.
Any opinions, news, research, analyses, prices, other information, or links to third-party sites contained on this website are provided on an "as-is" basis, are intended only to be informative, is not an advice nor a recommendation, nor research, or a record of our trading prices, or an offer of, or solicitation for a transaction in any financial instrument and thus should not be treated as such. The information provided does not involve any specific investment objectives, financial situation and needs of any specific person who may receive it. Please be aware, that past performance is not a reliable indicator of future performance and/or results. Past Performance or Forward-looking scenarios based upon the reasonable beliefs of the third-party provider are not a guarantee of future performance. Actual results may differ materially from those anticipated in forward-looking or past performance statements. IC Markets makes no representation or warranty and assumes no liability as to the accuracy or completeness of the information provided, nor any loss arising from any investment based on a recommendation, forecast or any information supplied by any third-party.
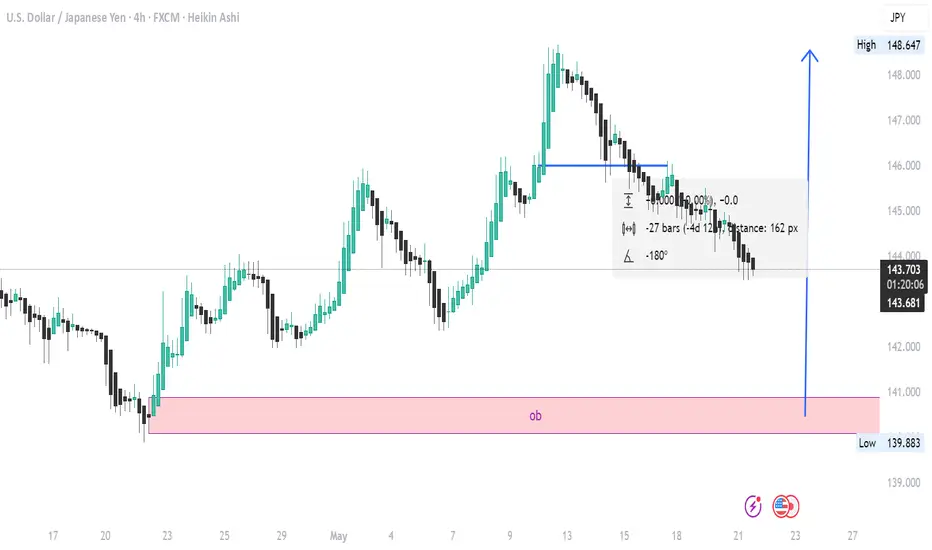
USDJPY BULLISH IDEA🧱 Key Observations
Order Block (OB) Marked (Demand Zone):
A clearly marked bullish order block (OB) zone is highlighted in pink around the 139.883 low.
This zone likely represents institutional buying interest.
It was the origin of a strong bullish move that broke prior structure.
Price Action:
After a series of higher highs and higher lows, price has retraced significantly.
It's approaching the order block area again, potentially for a retest or liquidity grab.
Heikin Ashi Candles:
Recent candles are bearish, showing momentum to the downside.
However, these candles typically lag in reversals, so price may soon shift if it hits the OB zone.
Projected Move:
A large blue upward arrow is drawn, suggesting an anticipated bullish reversal from the OB zone with a potential move back to 148.647 (recent high).
📊 Technical Implication
Bullish Bias if price holds within or just above the OB zone.
Watch for bullish reversal signals (engulfing patterns, divergence, or break of minor structure).
If price breaks below 139.883 decisively, the bullish setup may be invalidated.
📌 Strategy Idea (Not Financial Advice):
Entry Zone: 140.000–139.900 (inside OB)
Stop Loss: Below 139.800
Target: ~148.500
Risk/Reward: Favorable if OB holds
USDJPY Bearish in the short term.The USD/JPY exchange rate extended its recent downward trend during the European session, falling for the third consecutive trading day and marking the sixth decline in the past seven trading days. It hit a two-week low in the 143.45 area during the European morning session. Multiple factors have jointly driven the exchange rate lower, indicating that the sharp pullback from the monthly high of 148.65 reached last Monday may continue to extend. The Japanese yen is supported by market expectations that the Bank of Japan (BOJ) will raise interest rates again and has gained additional momentum from the rebound in risk-aversion demand. In the short term, USD/JPY maintains a downward trend, with technical indicators showing that bears are in control. 142.210 will be a key support level; a break below this level could accelerate the decline toward the 139.887 area.
In the market, there are no absolutes, and neither upward nor downward trends are set in stone. Therefore, the ability to judge the balance between market gains and losses is your key to success. Let money become our loyal servant.

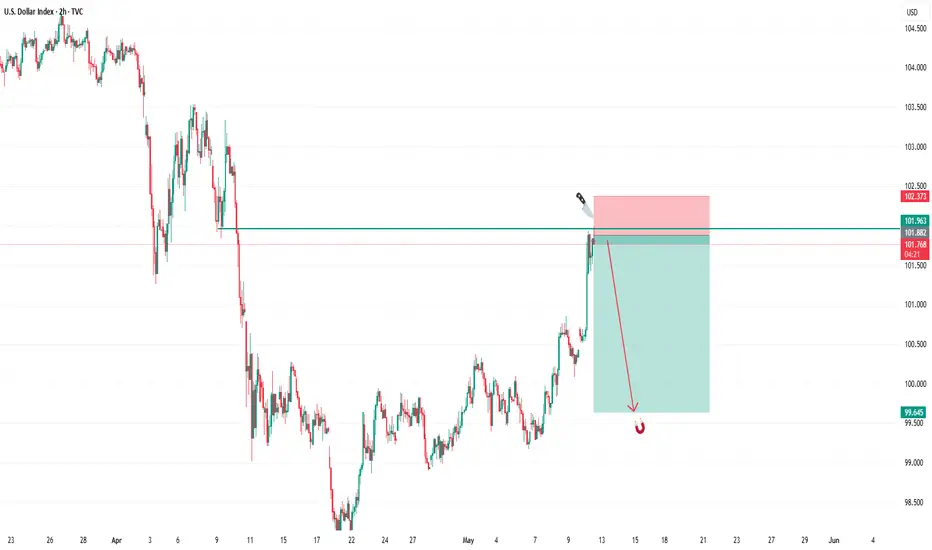
SELL USDIn todays session we are monitoring DXY for sells. After big move up we expect trend to continue. Our entry is at 101.82 and stops above 102.373. Targets are below 99.600 and lower to 95.00 . USD pairs will be dropping. Use proper risk management. Cheers to you all.
USD/JPY Dips FurtherUSD/JPY Dips Further
USD/JPY declined below 144.50 and is currently consolidating losses.
Important Takeaways for USD/JPY Analysis Today
- USD/JPY is trading in a bearish zone below the 146.10 and 144.90 levels.
- There is a short-term bearish trend line forming with resistance at 144.25 on the hourly chart at FXOpen.
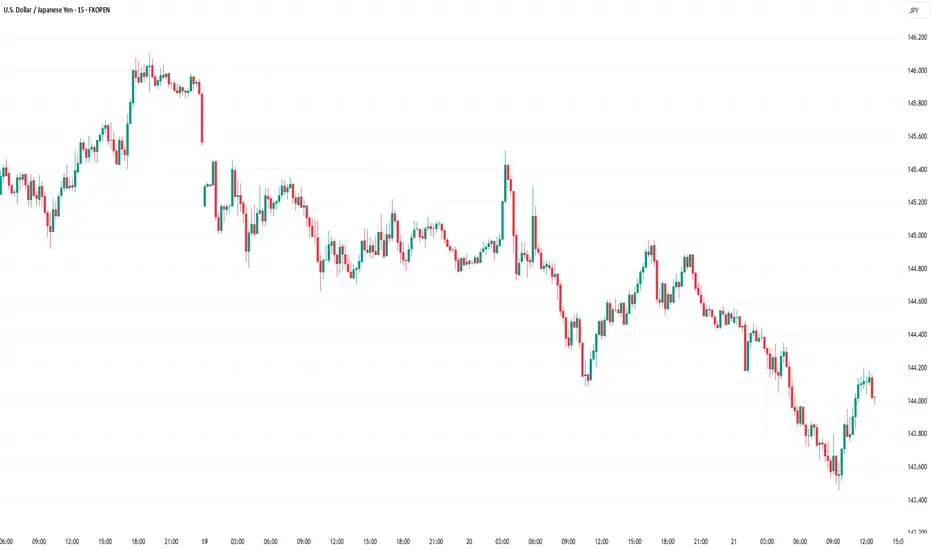
USD/JPY Technical Analysis
On the hourly chart of USD/JPY at FXOpen, the pair started a steady decline from well above the 146.00 zone. The US Dollar gained bearish momentum below the 145.00 support against the Japanese Yen.
The pair even settled below the 144.50 level and the 50-hour simple moving average. There was a spike below 144.00 and the pair traded as low as 143.72. It is now consolidating losses with a bearish angle. Immediate resistance on the USD/JPY chart is near the 23.6% Fib retracement level of the recent decline from the 146.10 swing high to the 143.42 low at 144.25.
There is also a short-term bearish trend line forming with resistance at 144.25. The first major resistance is near the 144.90 zone and the 50% Fib retracement level of the recent decline from the 146.10 swing high to the 143.42 low.
If there is a close above the 144.90 level and the hourly RSI moves above 50, the pair could rise toward 145.50. The next major resistance is near 146.10, above which the pair could test 147.50 in the coming days.
On the downside, the first major support is near 143.70. The next major support is near the 143.20 level. If there is a close below 143.20, the pair could decline steadily. In the stated case, the pair might drop toward the 142.00 support.
This article represents the opinion of the Companies operating under the FXOpen brand only. It is not to be construed as an offer, solicitation, or recommendation with respect to products and services provided by the Companies operating under the FXOpen brand, nor is it to be considered financial advice.
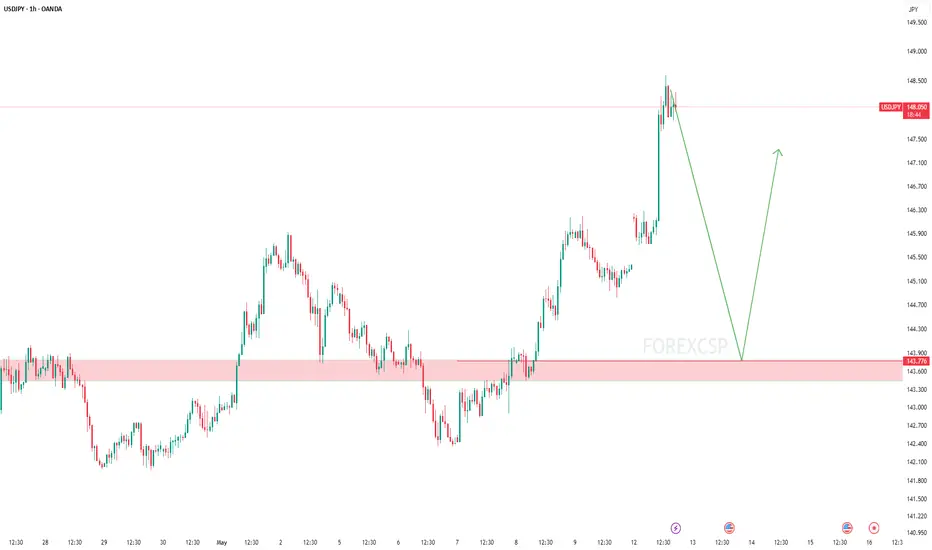
USDJPY TRADE PLAN – MAY 21 BIG BREAKOUT AHEAD?USDJPY TRADE PLAN – MAY 21 | FED HAWKISH BUT YEN STAYS WEAK – BIG BREAKOUT AHEAD?
USDJPY is entering a critical technical zone as the market weighs the Fed’s persistent hawkish stance against Japan’s passive approach to the Yen’s depreciation. After a strong rally, we are seeing a potential exhaustion with key levels in play.
🌍 MACRO CONTEXT:
FED remains hawkish: Officials continue to support higher-for-longer interest rates to tame inflation → USD remains firm.
Bank of Japan silence: No signs of FX intervention or rate policy shift, causing ongoing weakness in JPY.
Risk sentiment neutral: Risk-off flows are muted; USDJPY remains trapped in a wide range – awaiting macro catalysts.
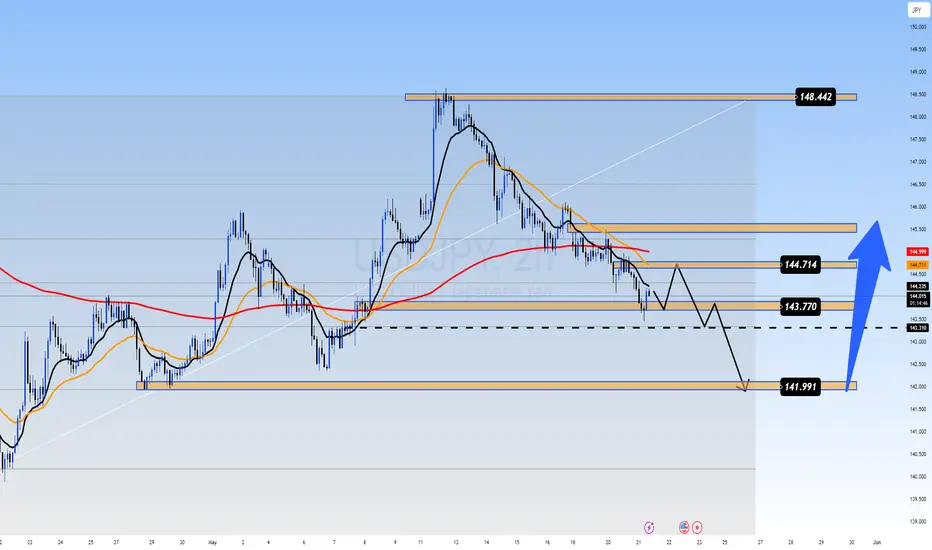
📊 TECHNICAL OUTLOOK (H2 CHART):
Price is now correcting within a falling channel.
Price broke below the MA200 and rising trendline, now retesting a key support zone at 143.77.
The current range 141.99 – 144.71 is critical – a breakout from either end may dictate the next medium-term direction.
🎯 TRADE SETUPS FOR TODAY:
✅ SCENARIO A – SELL THE RALLY (PRIMARY BIAS):
If price rejects 144.71:
SELL ZONE: 144.70 – 144.71
SL: 145.10
TP: 143.77 → 143.30 → 142.50 → 141.99
→ Key resistance area – price may trigger strong seller interest.
✅ SCENARIO B – SELL ON BREAKDOWN:
If price breaks 143.77 and retests:
SELL ZONE: 143.60 – 143.70 (post-breakdown entry)
SL: 144.10
TP: 142.50 → 142.00 → 141.99
✅ SCENARIO C – SHORT-TERM BUY (LESS FAVORABLE):
If price reacts positively at 141.99 with bullish confirmation:
BUY ZONE: 141.90 – 141.99
SL: 141.50
TP: 142.50 → 143.00 → 143.77
→ Only take this setup if strong reversal signals appear.
🔑 KEY LEVELS TO WATCH:
Resistance: 144.71 – 145.00 – 148.44
Support: 143.77 – 143.30 – 141.99 – 141.20
📌 FINAL THOUGHTS:
USDJPY remains in a volatile consolidation zone, pressured by a hawkish Fed but lacking JPY strength. Watch for PMI data and Fed comments this week for directional cues. Until then, respect the current range and trade with discipline.
📣 Bias favors SELL from 144.71 unless buyers reclaim full control – trade the reaction, not the prediction!
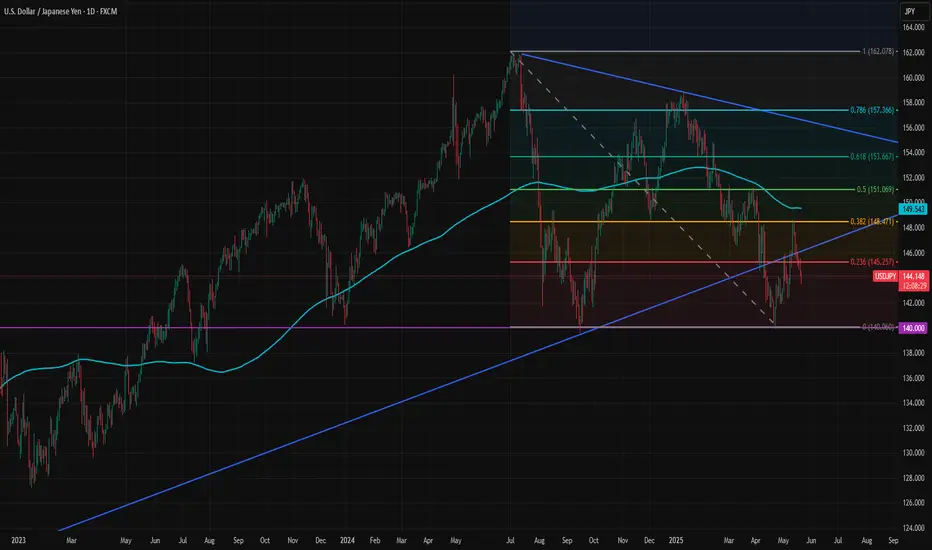
Bearish Pressure on USDJPY Likely to Continue With Higher YieldsUSDJPY was rejected at the 38.2% retracement level. Rising yields may continue to exert downward pressure until the 140 support level is tested. The true direction for USDJPY will likely become clearer after that test.
Similar to USDJPY, EURJPY has also formed a bearish technical outlook. You can check our earlier post on EURJPY here:
Unless EURUSD rises sharply, the downward pressure on both USDJPY and EURJPY is likely to persist.
USDJPY Analysis🚀 We entered the buy trade from the bottom level (check the pinned idea)
Thanks to our trailing stop strategy, we locked in full profits ✅
For those who missed it — a new buy zone is now marked on the chart!
Be patient and don’t trade emotionally ✋
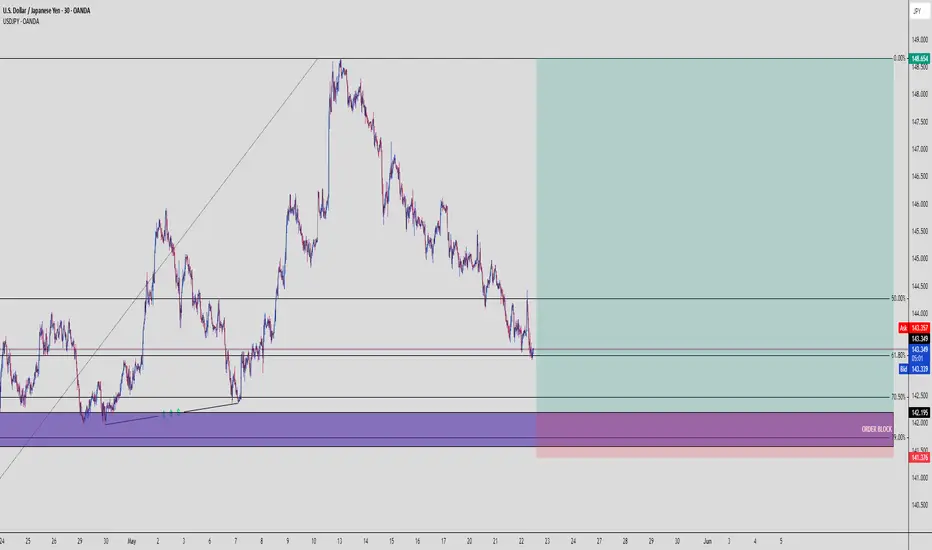
USDJPY Tap and Dump – Perfect Lower Timeframe ReversalSmart Money Scalpers, it’s time to eat 🍽️
USDJPY just played into a beautiful supply zone rejection on the 30-minute chart, with clean confluence from structure, trendlines, and OB reaction. Let’s break it down like a pro:
🧠 Market Structure Narrative:
🔻 Strong bearish momentum
🔹 Price created a clear lower low
🔹 Pullback into a premium zone = sniper short entry setup
You’re looking at textbook bearish order flow, with price rejecting hard from the 143.805 zone, which served as a high-risk institutional POI (Point of Interest).
🟥 Supply Zone / OB Zone:
📌 OB Range:
Top: 143.805
Bottom: 143.639
This red zone triggered the last bearish impulse and was just tapped and rejected with precision.
The reaction candle wick shows clear rejection = institutions likely mitigating and initiating shorts.
📐 Trendline Confluence:
You’ve got a perfect descending channel running down with clean touches on both trendlines.
Price bounced off the upper line → trendline + OB = double whammy setup 💥
🎯 Entry Plan:
Entry: 143.512
SL: 143.805 (above OB)
TP: 142.358 (next liquidity pocket)
This gives a juicy RRR of around 3.9–4x, depending on your exact fill.
🎯 Why This Works:
Price reacted to a clear OB
Inside a descending channel
Weak bullish push = no conviction
Favorable RRR = asymmetrical edge
Perfect combo of SMC + structure + execution = sniper-grade entry 🔫
🧠 Key Lesson:
“Let price come to you. Smart Money doesn’t chase — it traps and snaps.”
This is a trap sprung with surgical precision. Execution was key — and you nailed it.
🗣️ If this setup hit your radar too, drop a “🎯” in the comments
📌 Save this — these are the trades that build your bankroll over time.

There is too much uncertainty.The USD/JPY exchange rate lingered near 144.50 during the European session, remaining under pressure. Although the U.S. Dollar Index (DXY) found temporary support near 100.10, its overall trend remains uncertain following Moody’s downgrade of the U.S. sovereign credit rating. Market sentiment is currently tilted toward cautious bearishness, with traders concerned about U.S. debt issues and uncertainties in trade policies—sentiments reflected in the dollar’s weakness. Meanwhile, the progress of U.S.-Japan trade negotiations has added to market uncertainty.
Technical Outlook:
Short-Term: If the pair stabilizes above the 143.74 support level and rebounds above 145, it may challenge the 146.19 resistance level in the near term. A decisive breakout above 146.19 could trigger a new upward trend, targeting 147.95 and 148.64.
Long-Term: A genuine confirmation of a bullish regime would require breaking above the 150 psychological level, which hinges on fundamental catalysts such as the Federal Reserve delaying rate cuts or the Bank of Japan shifting to a more accommodative stance.
Key Drivers to Monitor:
U.S. Treasury yield dynamics and Fed policy expectations.
Developments in U.S.-Japan trade talks and risk sentiment shifts.
Volatility in global equity markets and safe-haven flows.
Market participants are advised to exercise caution amid heightened uncertainty, with tight stop-losses recommended for directional trades.
In the market, there are no absolutes, and neither upward nor downward trends are set in stone. Therefore, the ability to judge the balance between market gains and losses is your key to success. Let money become our loyal servant.
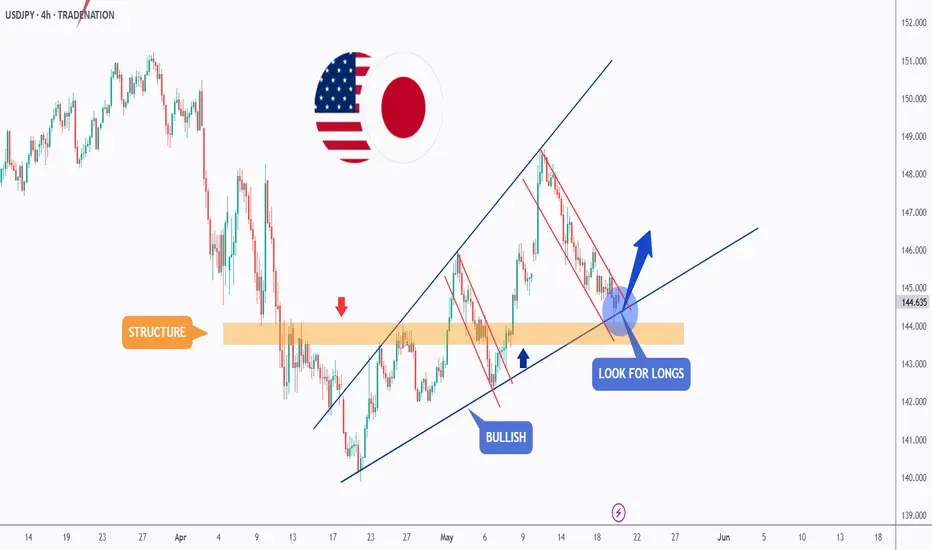
USDJPY - New Impulse Soon!Hello TradingView Family / Fellow Traders. This is Richard, also known as theSignalyst.
📈USDJPY has been overall bullish trading within the rising broadening wedge pattern marked in blue and it is currently hovering around the lower bound of it.
Moreover, the orange zone is a strong structure and support.
🏹 Thus, the highlighted blue circle is a strong area to look for buy setups as it is the intersection of structure and lower blue trendline acting as a non-horizontal support.
📚 As per my trading style:
As #USDJPY is around the blue circle zone, I will be looking for bullish reversal setups (like a double bottom pattern, trendline break , and so on...)
📈The bullish impulse will begin after a break above the last minor high and upper red trendline.
📚 Always follow your trading plan regarding entry, risk management, and trade management.
Good luck!
All Strategies Are Good; If Managed Properly!
~Rich
Disclosure: I am part of Trade Nation's Influencer program and receive a monthly fee for using their TradingView charts in my analysis.
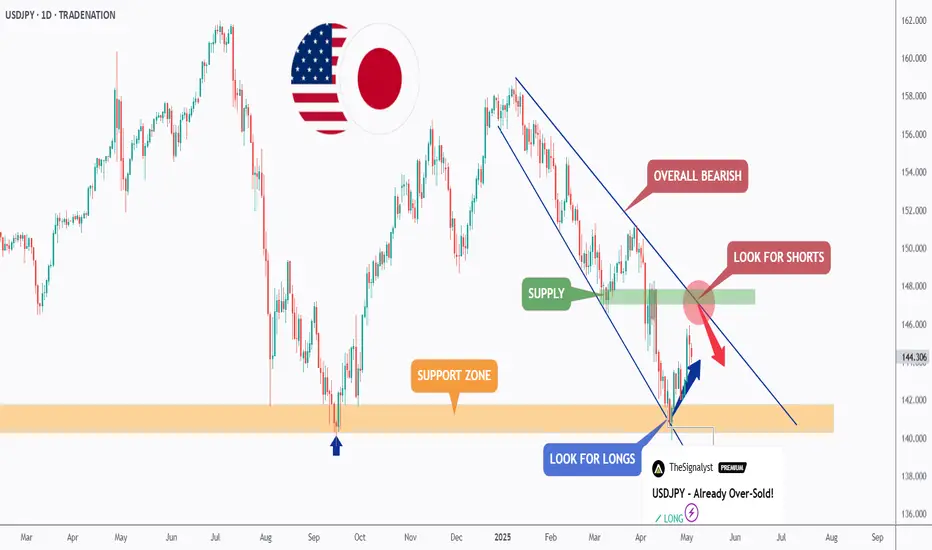
USDJPY - Long Done, Soon Short!Hello TradingView Family / Fellow Traders. This is Richard, also known as theSignalyst.
📈As per our last USDJPY analysis, it rejected the orange support zone and has been trading higher.
What's next? As USDJPY approaches the upper blue trendline, we will be looking for shorts.
🏹 The highlighted red circle is a strong area to look for sell setups as it is the intersection of the upper blue trendline and green supply zone.
📚 As per my trading style:
As #USDJPY retests the red circle zone, I will be looking for bearish reversal setups (like a double top pattern, trendline break , and so on...)
Meanwhile, USDJPY would remain bullish medium-term and a bullish continuation towards the red circle is expected.
📚 Always follow your trading plan regarding entry, risk management, and trade management.
Good luck!
All Strategies Are Good; If Managed Properly!
~Rich
Disclosure: I am part of Trade Nation's Influencer program and receive a monthly fee for using their TradingView charts in my analysis.
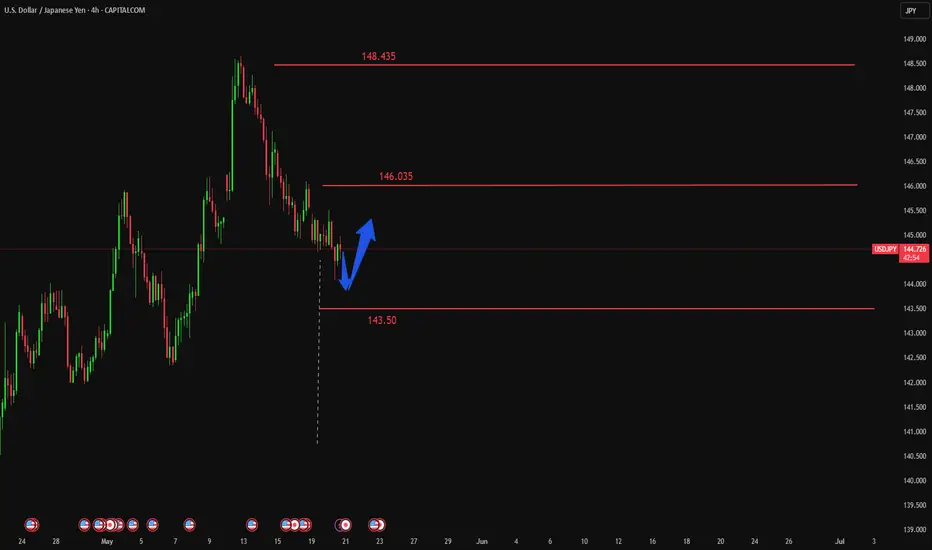
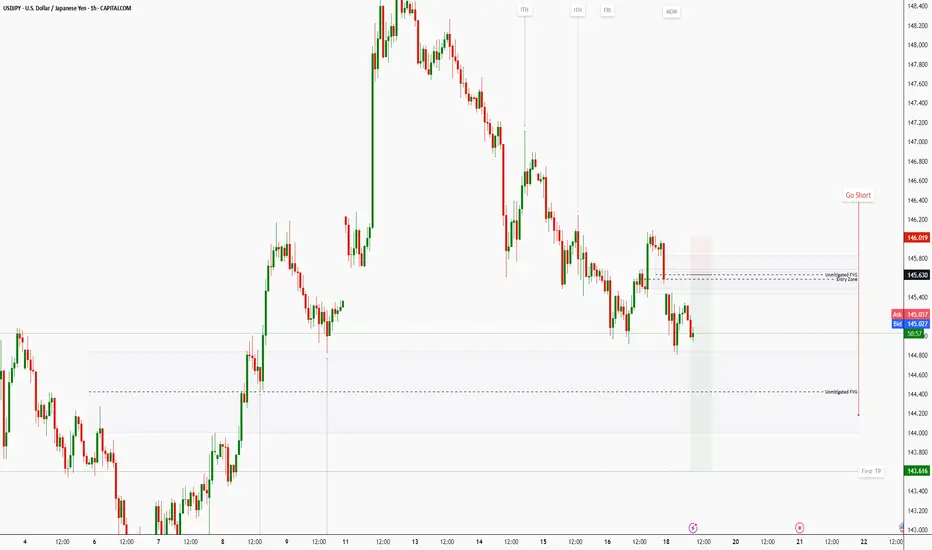
USDJPY Outlook: Weekly Bearish Bias Despite Temporary RebalanceGreetings Traders,
It's the start of a new trading week, and our focus is on the Gopher — CAPITALCOM:USDJPY .
Weekly Overview: Temporary Rebalance, Bearish Tone Intact
On the weekly chart, USDJPY pushed higher to rebalance a Fair Value Gap (FVG) between 149.30 and 148.26. Following this, price was swiftly rejected, forming a shooting star candlestick — a classic sign of potential bearish continuation.
However, for this bearish outlook to remain valid, 146.250 must hold as resistance. A sustained break above this level could invalidate the current bias and signal the possibility of further upside.
Daily Chart: Downside Pressure Builds
Looking at the daily timeframe, we see a sequence of down-close candles, indicating consistent selling pressure. I expect price to continue pushing lower, targeting the FVG below, with a potential sweep of sell-side liquidity resting under recent lows.
Trading Plan: Bearish Setup
Unless disrupted by high-impact fundamentals, I’ll be favouring short positions this week. My planned setup is as follows:
Entry: On confirmation within the 145.63 zone
Stop Loss: Above 145.97
Target Zones: Around 144.430
I’ll monitor price reaction closely at key levels to manage the trade accordingly.
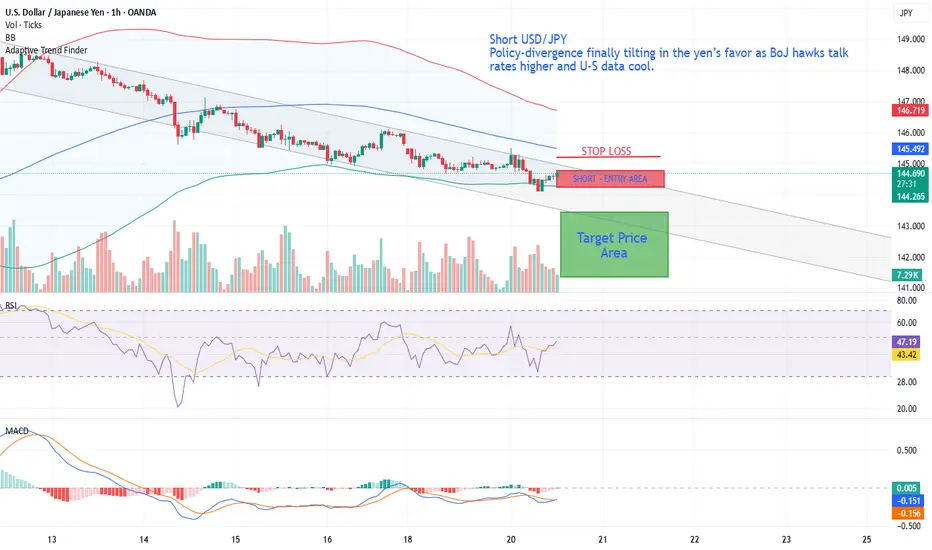
Short USD/JPYShort USD/JPY – policy-divergence finally tilting in the yen’s favor as BoJ hawks talk rates higher and U-S data cool.
• BoJ hawks signaling further 2025 hikes while Fed easing bets build → policy-divergence flips JPY-positive.
• Break & close below 38.2 % retracement and 200-SMA (H4) turns momentum south; hourly / daily RSI roll-over.
• Geopolitics easing removes safe-haven bid for USD, but not for JPY (BoJ still seen hiking).
• Bearish trigger deepens if 144.30 confluence (200-SMA H4 + 50 % Fib) gives way → air-pocket into 141s.
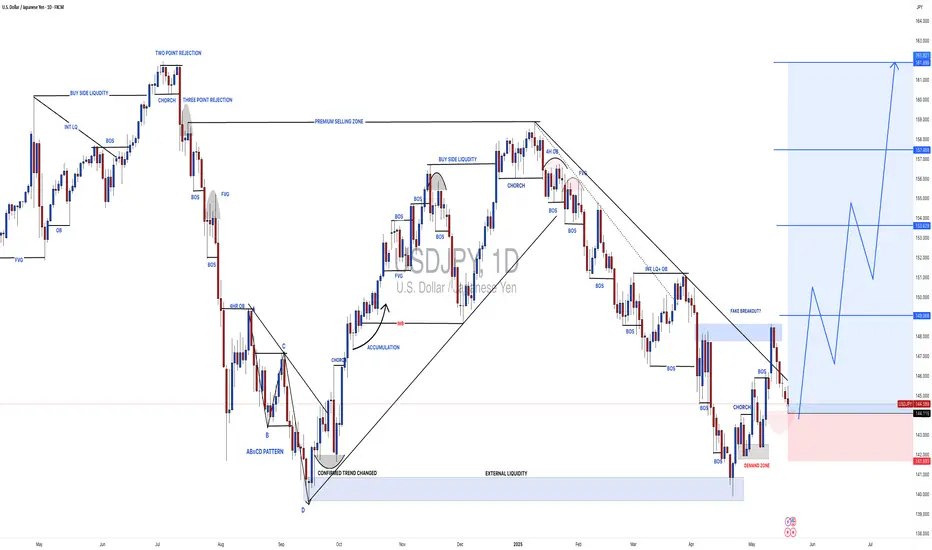
USDJPY:Is it a beginning of major bullish trend? Read CaptionThe price of USDJPY has shown a mixed volume, making it difficult to determine the trend. However, if we analyse the data, we can see that USD is gaining strength in the coming time. This could be due to the strong news coming in this week, which may divert the USDJPY towards the 150 price region. There are four potential targets that price could hit and surpass. Please use this analysis solely for educational purposes, as it does not provide any guarantees.
Good luck and trade safely.
Thanks for your support! 😊
If you’d like to help us out, here are a few things you can do:
- Like our ideas
- Comment on our ideas
- Share our ideas
Team Setupsfx_
❤️
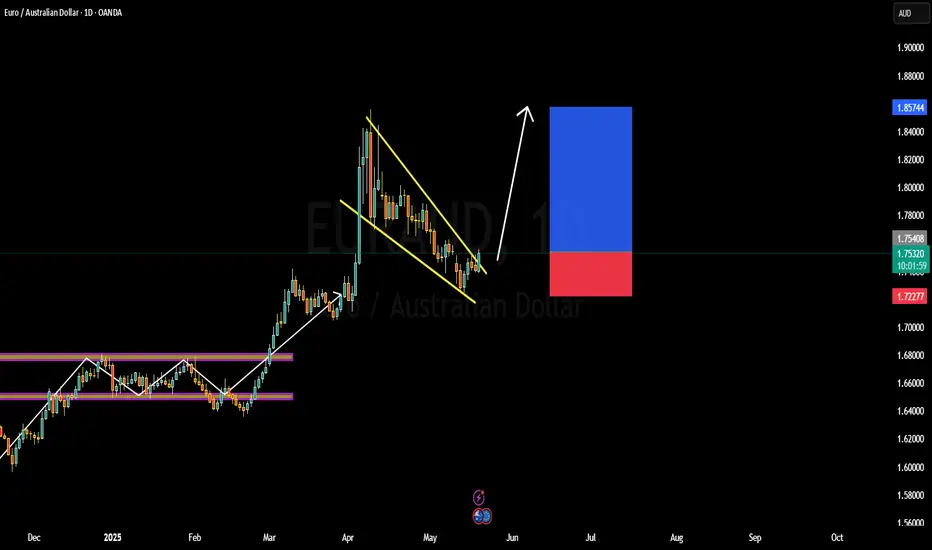
EURAUD BULLISH OR BEARISH DETAILED ANALYSISEURAUD is currently presenting a textbook bullish setup with a well-defined falling wedge formation on the daily chart. After a strong impulsive rally in April, price has been consolidating within this wedge, forming consistent lower highs and lower lows—typical of a corrective pattern. Now, with price testing the upper trendline of the wedge, we are positioned for a potential breakout, supported by increasing bullish momentum and clean structure. With the current price around 1.75, the next leg higher toward the 1.85 resistance zone is well on the radar.
From a fundamental perspective, the euro is gaining strength on the back of improving Eurozone macro data, with recent PMI figures showing resilience and inflation staying moderately sticky—making the ECB cautious about aggressive rate cuts. Meanwhile, the Australian dollar continues to face headwinds amid declining commodity prices and weakening consumer sentiment. The Reserve Bank of Australia remains relatively dovish, especially as wage growth plateaus and inflation expectations cool. This EURAUD divergence sets the stage for a broader move in favor of the euro.
Technically, the breakout from this wedge structure would signify the continuation of the prior bullish trend, and given the size of the previous impulsive move, a breakout target of 1.85 is both conservative and well-aligned with market structure. The bullish divergence forming on oscillators such as RSI and MACD also confirms the slowing momentum in the downward move. A clean break and close above 1.7550 would be the trigger point for long positions, with invalidation below 1.7220.
This is a high-probability breakout setup with strong confluence across technical and fundamental indicators. With euro strength coming into play and AUD fundamentals remaining weak, I’m favoring the long side here. A move toward 1.85 is well-supported, and a break above the wedge could trigger significant upside in the coming sessions. This is a setup worth watching closely.
USDJPY Expected Growth! BUY!
My dear friends,
USDJPY looks like it will make a good move, and here are the details:
The market is trading on 144.56 pivot level.
Bias - Bearish
Technical Indicators: Supper Trend generates a clear short signal while Pivot Point HL is currently determining the overall Bearish trend of the market.
Goal - 145.11
About Used Indicators:
Pivot points are a great way to identify areas of support and resistance, but they work best when combined with other kinds of technical analysis
Disclosure: I am part of Trade Nation's Influencer program and receive a monthly fee for using their TradingView charts in my analysis.
———————————
WISH YOU ALL LUCK
Yen Steadies on US Credit DowngradeThe Japanese yen held firm near 144 per dollar, marking its fourth straight session of gains, bolstered by a weaker US dollar in the wake of Moody’s downgrade of the US credit rating. The move, prompted by fiscal concerns and rising deficits, dented dollar confidence globally.
Despite this, Japan’s own economic data weighed on sentiment, with GDP shrinking by 0.2% in Q1, its first contraction in a year and worse than anticipated. Investors are also closely watching the upcoming Japanese trade data with concerns about the impact of potential new US tariffs. A third round of US-Japan trade talks is set to begin in Washington by the end of the week, led by Japan’s chief negotiator Ryosei Akazawa.
USD/JPY faces immediate resistance at 148.60, with higher levels at 149.80 and 151.20. Key support is seen at 139.70, followed by 137.00 and 135.00.

Hanzo / USDJPY 15m Path ( Confirmed Breakout Zones )🔥 USD/JPY – 15 Min Scalping Analysis (Bearish Setup)
Bias: Waiting For Break Out
Time Frame: 15 Min
Entry Type: Confirmed Entry After Break Out
👌Bullish After Break Out : 144.550
👌Bearish After Break Out : 144.050
☄️ Hanzo Protocol: Dual-Direction Entry Intel
➕ Zone Activated: Strategic Reaction from Refined Liquidity Layer
Marked volatility from a high-precision supply/demand zone. System detects potential for both long and short operations.
🩸 Momentum Signature Detected:
Displacement candle confirms directional intent — AI pattern scan active.
— If upward: Bullish momentum burst.
— If downward: Aggressive bearish rejection.
💯 Market Zone: Transition Phase
Asset in premium-to-discount (or vice versa) range — valid for both reversal and continuation trades. Execute with precision.

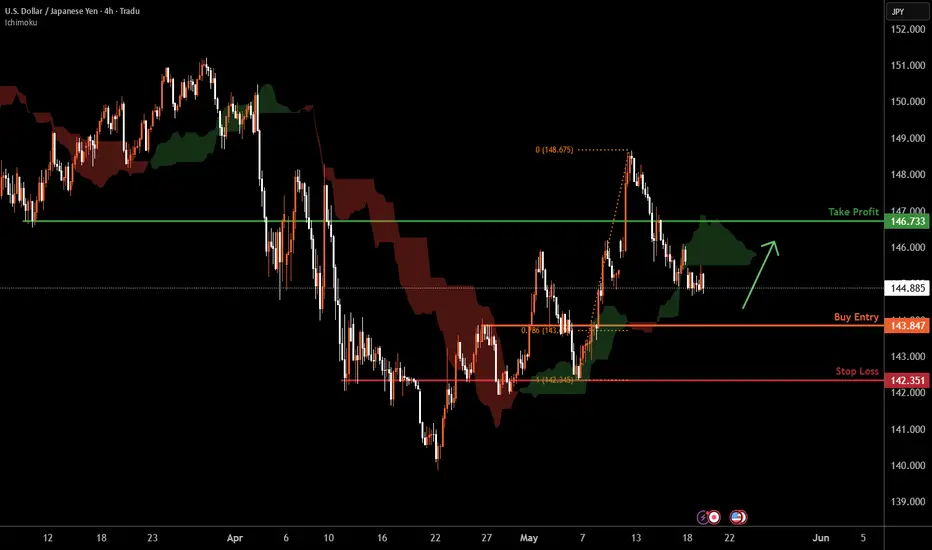
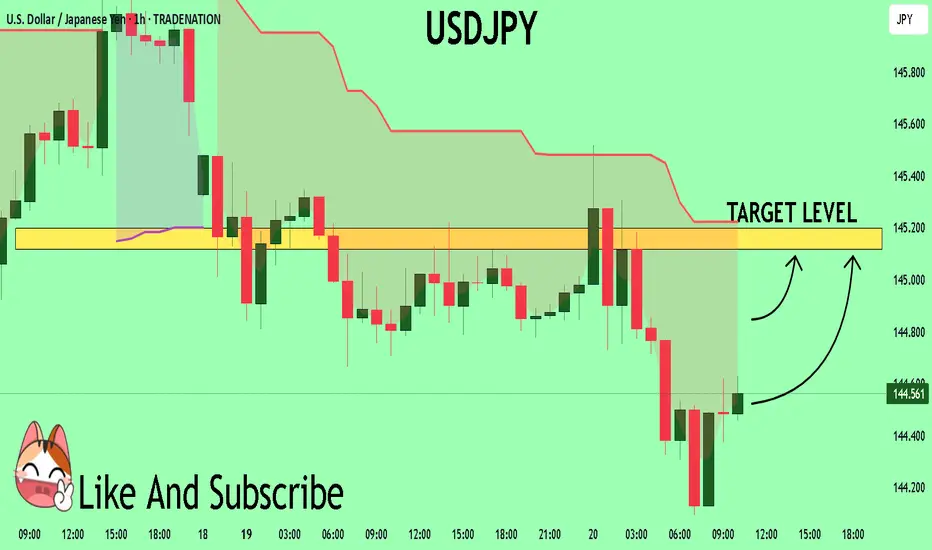
USDJPY H4 | Bullish Bounce Based on the H4 chart analysis, the price is falling toward our buy entry level at 143.84, a pullback support that aligns with the 61.8 Fibonacci retracement.
Our take profit is set at 1146.73, a pullback resistance.
The stop loss is placed at 142.35, an overlap support.
High Risk Investment Warning
Trading Forex/CFDs on margin carries a high level of risk and may not be suitable for all investors. Leverage can work against you.
Stratos Markets Limited (tradu.com):
CFDs are complex instruments and come with a high risk of losing money rapidly due to leverage. 63% of retail investor accounts lose money when trading CFDs with this provider. You should consider whether you understand how CFDs work and whether you can afford to take the high risk of losing your money.
Stratos Europe Ltd (tradu.com):
CFDs are complex instruments and come with a high risk of losing money rapidly due to leverage. 63% of retail investor accounts lose money when trading CFDs with this provider. You should consider whether you understand how CFDs work and whether you can afford to take the high risk of losing your money.
Stratos Global LLC (tradu.com):
Losses can exceed deposits.
Please be advised that the information presented on TradingView is provided to Tradu (‘Company’, ‘we’) by a third-party provider (‘TFA Global Pte Ltd’). Please be reminded that you are solely responsible for the trading decisions on your account. There is a very high degree of risk involved in trading. Any information and/or content is intended entirely for research, educational and informational purposes only and does not constitute investment or consultation advice or investment strategy. The information is not tailored to the investment needs of any specific person and therefore does not involve a consideration of any of the investment objectives, financial situation or needs of any viewer that may receive it. Kindly also note that past performance is not a reliable indicator of future results. Actual results may differ materially from those anticipated in forward-looking or past performance statements. We assume no liability as to the accuracy or completeness of any of the information and/or content provided herein and the Company cannot be held responsible for any omission, mistake nor for any loss or damage including without limitation to any loss of profit which may arise from reliance on any information supplied by TFA Global Pte Ltd.
The speaker(s) is neither an employee, agent nor representative of Tradu and is therefore acting independently. The opinions given are their own, constitute general market commentary, and do not constitute the opinion or advice of Tradu or any form of personal or investment advice. Tradu neither endorses nor guarantees offerings of third-party speakers, nor is Tradu responsible for the content, veracity or opinions of third-party speakers, presenters or participants.