USDJPY Will Go Up! Buy!
Take a look at our analysis for USDJPY.
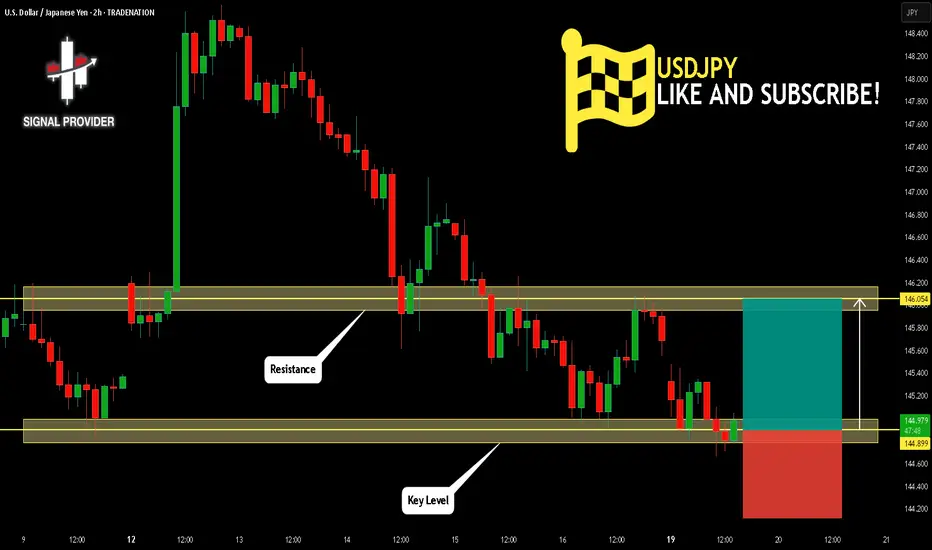
Time Frame: 2h
Current Trend: Bullish
Sentiment: Oversold (based on 7-period RSI)
Forecast: Bullish
The market is testing a major horizontal structure 144.899.
Taking into consideration the structure & trend analysis, I believe that the market will reach 146.054 level soon.
P.S
Please, note that an oversold/overbought condition can last for a long time, and therefore being oversold/overbought doesn't mean a price rally will come soon, or at all.
Disclosure: I am part of Trade Nation's Influencer program and receive a monthly fee for using their TradingView charts in my analysis.
Like and subscribe and comment my ideas if you enjoy them!
USDJPY
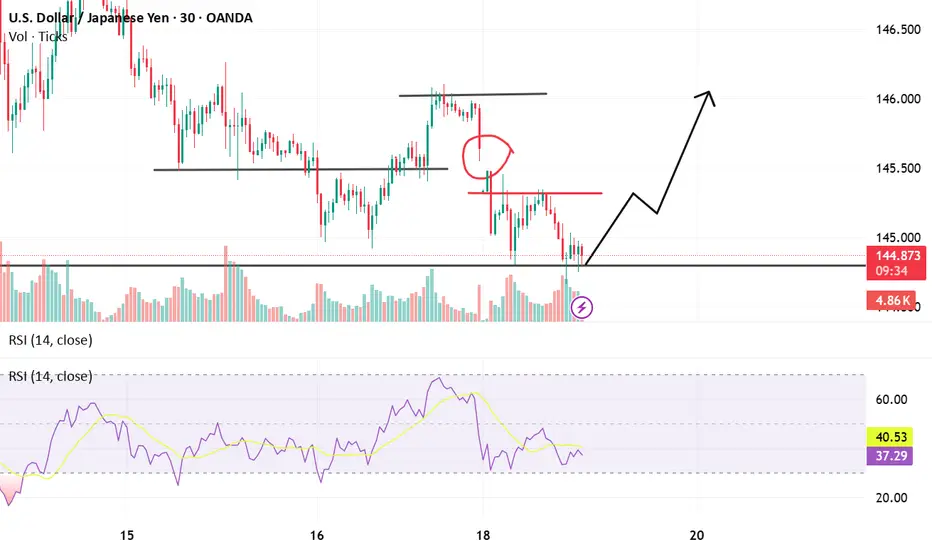
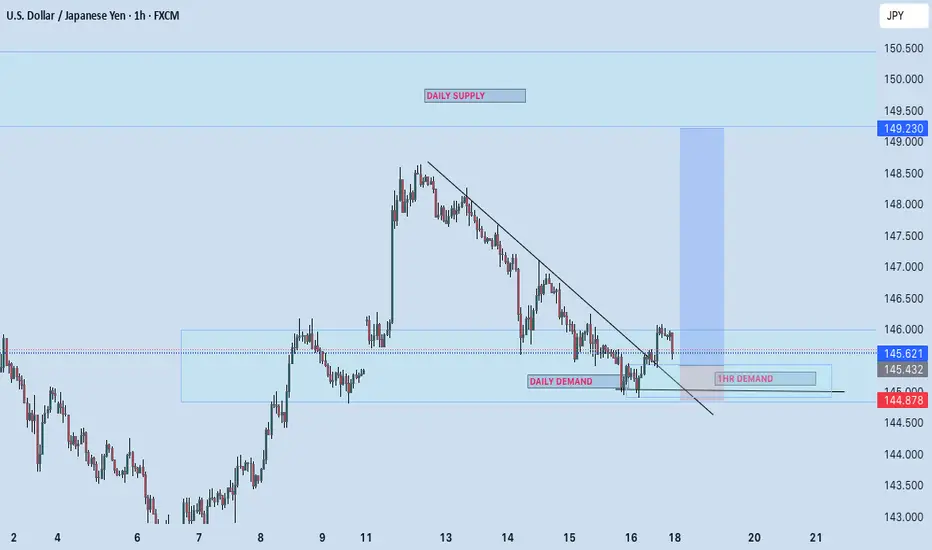
USDJPY Technicals Price reacting near a key horizontal support level just below 145.00, where a visible bounce is attempting to form. This level has been tested multiple times, establishing it as a reliable demand zone, and price is now trying to stabilize after a sharp drop from the 146.20s. The recent move downward followed a failed bullish breakout attempt near a local resistance (highlighted with a red circle), which then turned into a supply zone around 145.70–145.80. That area has since capped further upside, resulting in a sell-off.
At current levels, there's a combination of technical signals suggesting a potential reversal or at least a short-term bounce. First, price has reached a structurally important area where previous buying interest was observed. Additionally, the Relative Strength Index (RSI) on the 30-minute chart shows values around 38–40, indicating the market is entering oversold territory without being extremely extended, which often aligns with corrective moves or base formations.
Volume analysis also supports the reversal idea. The recent bearish candles approaching the 145.00 support zone show decreasing bearish volume, followed by a slight uptick in buying pressure (as shown by the magenta lightning bolt icon), hinting at potential absorption of selling pressure and the beginning of buyer interest. This could mark the end of the down leg and the start of a higher low structure.
The projected path drawn on the chart suggests a bullish recovery scenario where price reclaims the mid-145s, retests prior minor resistance levels, and attempts to push toward the 146.00 handle again. However, this move is only valid if price holds above the current support. A breakdown below 144.90 would invalidate this idea and may lead to deeper downside.
In summary, the setup favors a bullish reversal off support, aided by RSI recovering from oversold conditions, a slowdown in bearish momentum, and historical support alignment. That said, price action confirmation (like bullish engulfing or a strong reclaim candle) is necessary to initiate a long position with tighter risk below the support base.
Fundamental Market Analysis for May 19, 2025 USDJPYThe USD/JPY pair attracted new sellers on Monday and fell to a one-week low of around 144.800 during the Asian session. Furthermore, the current economic climate suggests that the path of least resistance for spot prices remains to the downside, which supports the prospects for a continuation of the recent corrective decline from the nearly six-week high reached last Monday.
It is widely anticipated that the Bank of Japan (BoJ) will raise interest rates again in 2025, a development that is expected to continue providing support to the Japanese Yen (JPY). Furthermore, the unexpected downgrade of the US government's credit rating is discouraging investors from taking risks and is instead favouring traditional safe-haven assets, including the Japanese Yen. On Friday, Moody's downgraded America's main sovereign credit rating by one notch, to 'Aa1', citing concerns over the country's rising debt.
Meanwhile, investors seem convinced that the Federal Reserve (Fed) will continue to cut rates amid signs of weakening inflation and the likelihood that the US economy will see several quarters of sluggish growth. At the start of the new week, the US Dollar remains depressed and exerts additional downward pressure on the USD/JPY pair. However, the lack of follow-through selling below the psychological 145.00 mark is forcing bears to exercise caution before positioning themselves for deeper losses.
On Monday, the US will not release any market-moving economic data, so the dollar will be influenced by speeches by influential FOMC members. Furthermore, an improvement in risk sentiment is likely to result in increased demand for the Japanese Yen, thereby providing some momentum to the USD/JPY pair. However, the diverging policy expectations of the BoJ and the FOMC confirm the negative outlook for the near term. Consequently, any recovery attempt could be perceived as a strategic opportunity for divestment, and is likely to be constrained.
Trade recommendation: SELL 144.700, SL 145.500, TP 143.800
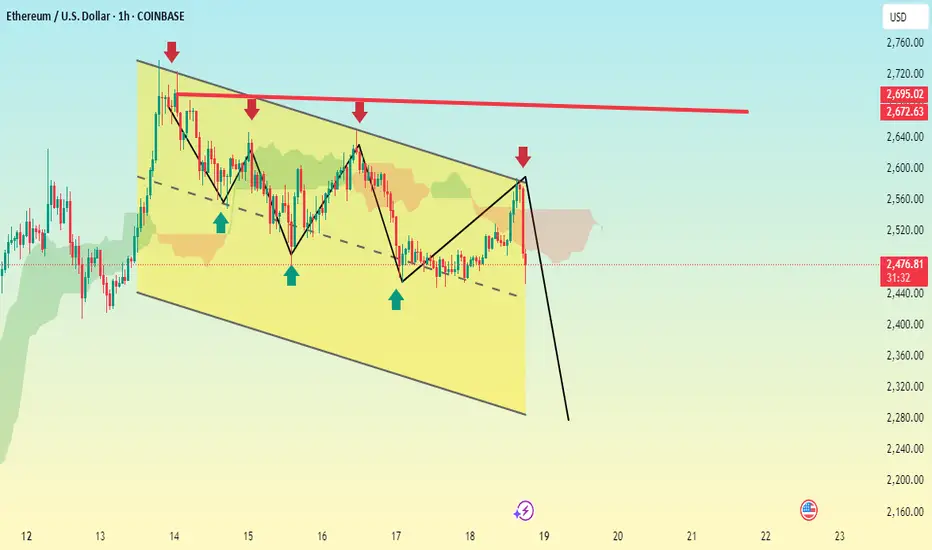
ETHEREUM BEARISH ZONEBased on the chart we provided, which shows a descending channel and a bearish pattern on Ethereum (ETH/USD) on the 1-hour timeframe, it seems like you're anticipating a breakdown from the channel support. The chart also shows a projected drop with a strong bearish move marked by a thick black arrow.
Here are some potential Take Profit (TP) levels based on technical support zones and the chart structure:
Suggested Sell TPs (short position):
1. TP1: $2,420 — Just above the recent swing low, potential initial support.
2. TP2: $2,360 — Mid-range of the previous low and psychological level.
3. TP3: $2,300 — Near the bottom of the descending channel and a likely target if breakdown confirms.
4. TP4: $2,240–$2,200 — Extended TP if momentum is strong and the broader market supports the move.
Always remember:
Use proper risk management.
Monitor volume and market sentiment around the breakout.
Consider setting a stop loss just above the recent swing high (around $2,565–$2,580).
Bullish bounce off pullback support?USD/JPY is falling towards the pivot and could bounce to the 78.6% Fibonacci resistance.
Pivot: 143.80
1st Support: 140.52
1st Resistance: 148.62
Risk Warning:
Trading Forex and CFDs carries a high level of risk to your capital and you should only trade with money you can afford to lose. Trading Forex and CFDs may not be suitable for all investors, so please ensure that you fully understand the risks involved and seek independent advice if necessary.
Disclaimer:
The above opinions given constitute general market commentary, and do not constitute the opinion or advice of IC Markets or any form of personal or investment advice.
Any opinions, news, research, analyses, prices, other information, or links to third-party sites contained on this website are provided on an "as-is" basis, are intended only to be informative, is not an advice nor a recommendation, nor research, or a record of our trading prices, or an offer of, or solicitation for a transaction in any financial instrument and thus should not be treated as such. The information provided does not involve any specific investment objectives, financial situation and needs of any specific person who may receive it. Please be aware, that past performance is not a reliable indicator of future performance and/or results. Past Performance or Forward-looking scenarios based upon the reasonable beliefs of the third-party provider are not a guarantee of future performance. Actual results may differ materially from those anticipated in forward-looking or past performance statements. IC Markets makes no representation or warranty and assumes no liability as to the accuracy or completeness of the information provided, nor any loss arising from any investment based on a recommendation, forecast or any information supplied by any third-party.

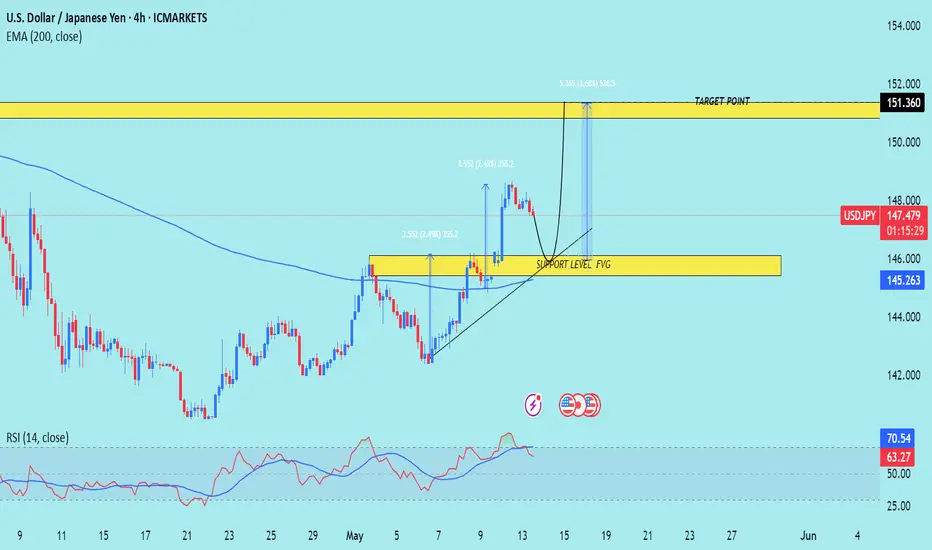
USD/JPY) support level back up Read The ChaptianSMC Trading point update
Technical analysis of USD/JPY on the 4-hour timeframe suggests a bullish setup with the following key insights:
Analysis Overview:
1. Current Price: 147.492
2. Support Zone: Around 145.263 to 146.000
Marked as "Support Level / FVG" (Fair Value Gap), this is the potential demand zone where the price may retrace before bouncing.
3. Trendline: An ascending trendline is supporting the bullish structure.
4. EMA 200: Price is trading above the 200 EMA (145.263), which is generally a bullish signal.
5. RSI Indicator:
RSI is near overbought levels (currently at 63.46 and 70.56), suggesting strong bullish momentum but a potential pullback.
6. Target Zone: 151.360
Highlighted as the "Target Point" – this is the resistance area where price might face selling pressure.
Mr SMC Trading point
Trade Idea:
Entry: Buy on retracement into the support zone (around 145.5–146.0).
Stop Loss: Below the support zone or EMA (around 144.800 or as per risk tolerance).
Take Profit: Near the target zone around 151.360.
Risk-to-Reward: Favorable, approximately 1:2.5 to 1:3 depending on the entry.
Conclusion:
The idea is based on price respecting support, fair value gap (FVG), bullish structure, and a target based on recent price projections. If the price respects the support and bullish trendline, the bullish continuation towards 151.360 is a valid expectation.
Pales support boost 🚀 analysis follow)
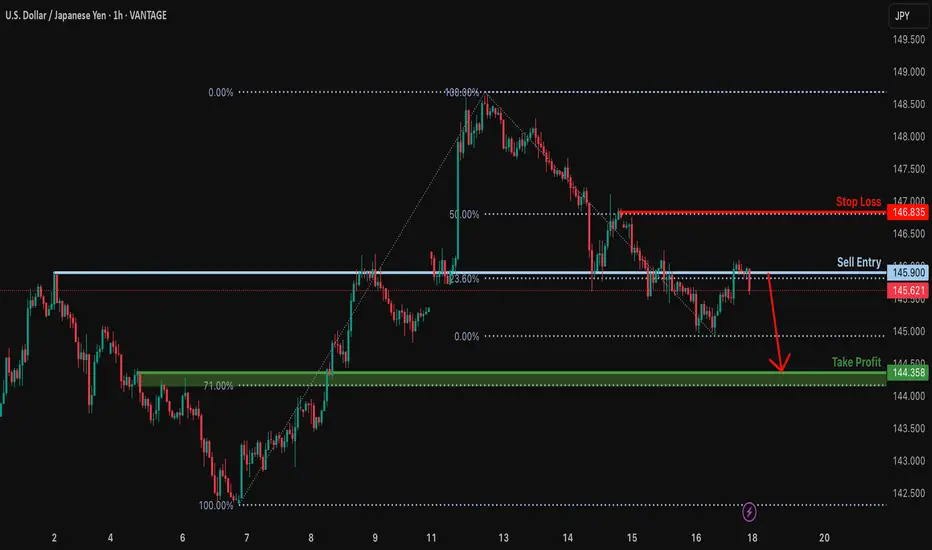
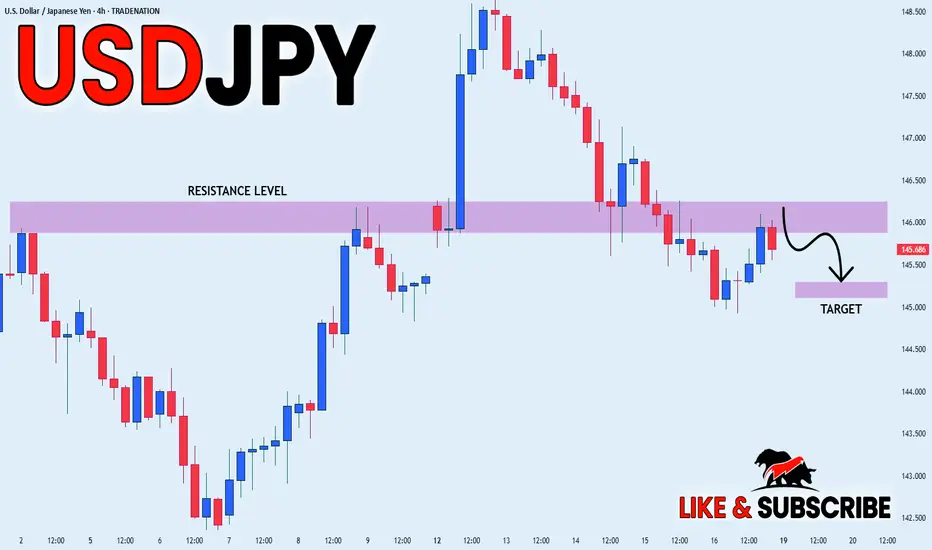
Potential bearish drop?USD/JPY is reacting off the resistance level which is an overlap resistance that lines up with the 23.6% Fibonacci retracement and could drop from this level to our take profit.
Entry: 145.90
Why we like it:
There is an overlap resistance level that lines up with the 23.6% Fibonacci retracement.
Stop loss: 146.83
Why we like it:
There is a pullback resistance level that aligns with the 50% Fibonacci retracement.
Take profit: 144.35
Why we like it:
There is a pullback support level that is slightly above the 71% Fibonacci retracement.
Enjoying your TradingView experience? Review us!
Please be advised that the information presented on TradingView is provided to Vantage (‘Vantage Global Limited’, ‘we’) by a third-party provider (‘Everest Fortune Group’). Please be reminded that you are solely responsible for the trading decisions on your account. There is a very high degree of risk involved in trading. Any information and/or content is intended entirely for research, educational and informational purposes only and does not constitute investment or consultation advice or investment strategy. The information is not tailored to the investment needs of any specific person and therefore does not involve a consideration of any of the investment objectives, financial situation or needs of any viewer that may receive it. Kindly also note that past performance is not a reliable indicator of future results. Actual results may differ materially from those anticipated in forward-looking or past performance statements. We assume no liability as to the accuracy or completeness of any of the information and/or content provided herein and the Company cannot be held responsible for any omission, mistake nor for any loss or damage including without limitation to any loss of profit which may arise from reliance on any information supplied by Everest Fortune Group.
BTCUSD 1H TIMEFRAME BULISH ZONEThe chart you've shared for BTC/USD (1H timeframe) indicates a bullish outlook based on the following elements:
Ascending Channels: Price moved within two rising channels, suggesting a bullish momentum.
Support Zone: Marked by arrows, previous bounces suggest strong support near 102,200–102,300.
Breakout and Pullback: Price appears to be forming a higher low, potentially preparing for the next upward leg.
Target Area: Marked around 105,630 (TP target).
Summary:
Entry (Buy Zone): Around 103,200–103,300.
Stop Loss (SL): Below 102,200 (conservative stop).
Take Profit (TP): 105,630 (as marked on chart).
Risk-to-Reward Ratio: Approximately 1:2 or better.

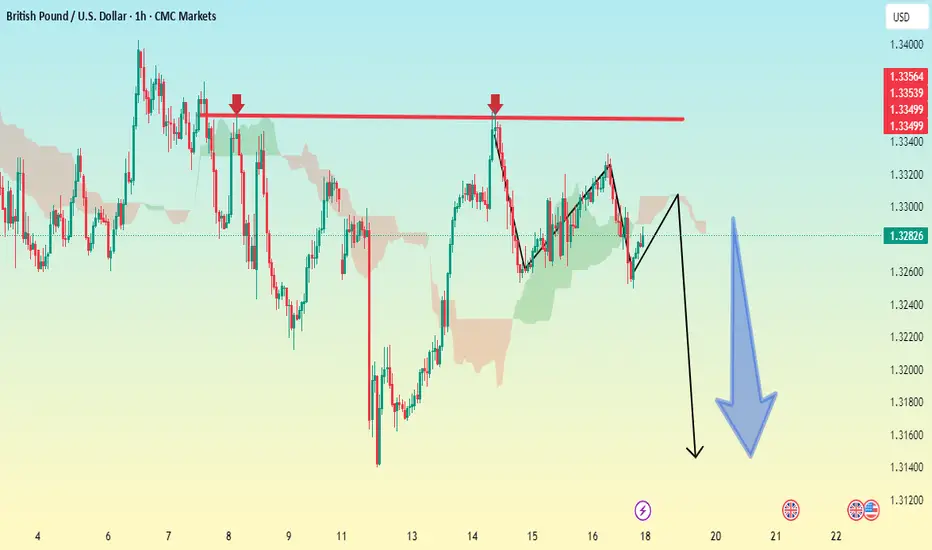
GBP/USD 1HOUR BEARISH I'm providing here (GBP/USD, 1-hour timeframe)
Pattern Observation:
The price tested a resistance zone around 1.33400 – 1.33550 multiple times (triple top).
A potential bearish move is forecasted, as indicated by the drawn black and blue arrows.
Ichimoku Cloud shows bearish pressure (price is under the cloud).
Suggested Trade Setup:
Trade Type: Sell (Short)
Entry Point:
Around current price: 1.32800–1.32900
Take Profit (TP) Levels:
TP1: 1.32000 (recent support area)
TP2: 1.31580 (target marked on the chart)
TP3: 1.30800 (next key support zone if momentum continues)
Stop Loss (SL):
Above the resistance zone: 1.33550–1.33600
This protects the trade if price breaks above the established resistance.
Risk Management Tips:
Risk no more than 1–2% of your trading capital.
Adjust lot size based on SL distance and your risk tolerance.
Monitor for major news events near the 21–23 May period as marked on your chart.
BUY USDJPY
USDJPY Buy Bias Analysis – May 2025
I'm bullish on USDJPY following the strong reversal from the weekly demand zone at 139.901 touched on April 21, 2025. The pair has shown consistent bullish sentiment since April 22, confirming institutional interest and price strength.
Seasonality supports this move, with historical patterns favoring USD strength during this period.
From COT (Commitment of Traders) perspective , commercial institutions are heavily long USDJPY, further reinforcing the bullish outlook. Their positioning often reflects informed, long-term sentiment.
Moreover, recent flows into the japanese Yen as a safe haven appear to be unwinding. With the USD regaining momentum, a massive sell-off in the Yen is likely, providing strong upside pressure on USDJPY.
In conclusion, with technical support, seasonal tailwinds, and institutional backing, I maintain a strong buy bias on USDJPY .
FOLLOW ME FOR WEEKLY BIAS
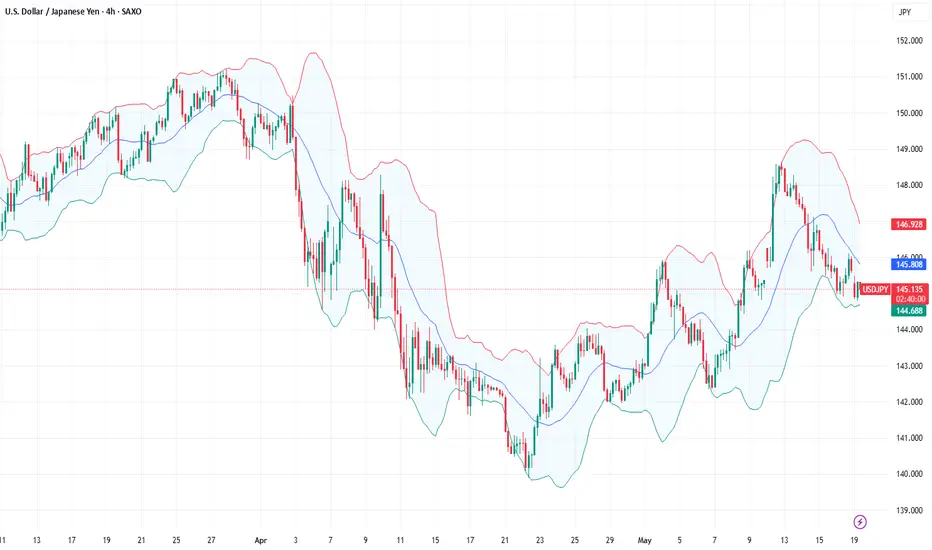
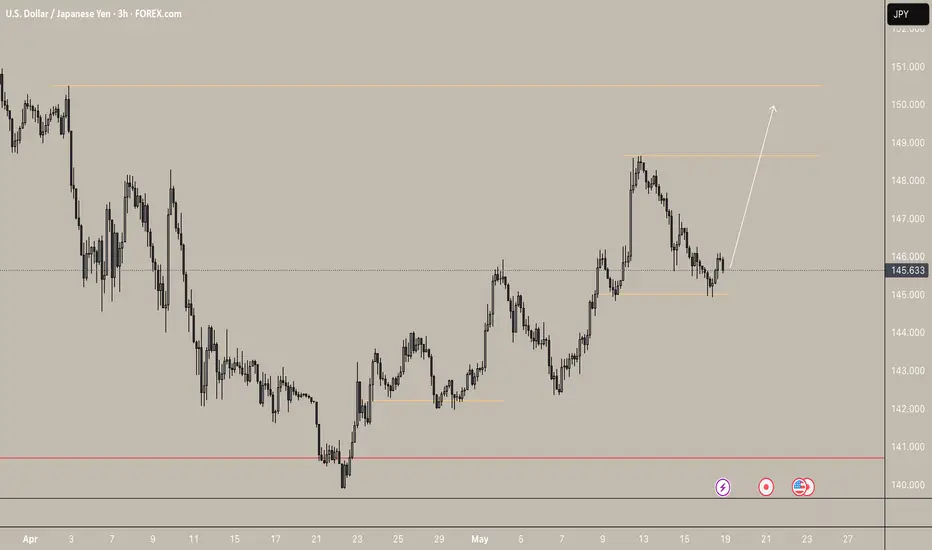
USDJPY - Trendline Support to Determine Next Big MoveThe USD/JPY pair has been trading within a well-defined upward trajectory, currently testing key levels around 145.68. The diagonal trendline visible on the chart serves as a critical support level that has consistently propelled the pair higher since mid-April. Should the price respect this trendline in the coming sessions, we could see a temporary pullback before potentially rallying toward the resistance zone around 148.50, highlighted by the upper purple rectangle. However, traders should closely monitor any breaks below this trendline as it would signal a significant shift in momentum and possibly indicate a deeper correction. The pair appears to be consolidating after the recent pullback from May highs, with the trendline interaction likely determining the next directional move.
Disclosure: I am part of Trade Nation's Influencer program and receive a monthly fee for using their TradingView charts in my analysis.

USDJPY Bullish Breakout Setup – Retest at Key Demand ZoneUSDJPY is respecting a clean bullish structure after rebounding from the 140.100 base. Price made a higher high near 148.650, followed by a pullback into the previous demand zone around 145.000.
Technical Breakdown:
Market Structure: Higher highs and higher lows indicate a strong uptrend.
Demand Zone: Clean reaction from the 145.000 zone, which previously acted as resistance-turned-support.
Target Zones:
First TP: 147.900 (previous swing high)
Final TP: 150.600 (key resistance level)
Invalidation Level : Close below 144.800 could invalidate this bullish scenario.
If price sustains above 145.000, the bullish trend is likely to continue.
As always, manage risk carefully.
Like & Follow for more clean, high-timeframe breakdowns!
USD_JPY RISKY SHORT|
✅USD_JPY made a bearish
Breakout of the key horizontal
Level of 146.133 which is a
Resistance now and the pair
Is now making a pullback
But as we are bearish biased
We will be expecting a move
Down after the pair retests
The new resistance
SHORT🔥
✅Like and subscribe to never miss a new idea!✅
Disclosure: I am part of Trade Nation's Influencer program and receive a monthly fee for using their TradingView charts in my analysis.
USDJPY and GBPJPY Analysis todayHello traders, this is a complete multiple timeframe analysis of this pair. We see could find significant trading opportunities as per analysis upon price action confirmation we may take this trade. Smash the like button if you find value in this analysis and drop a comment if you have any questions or let me know which pair to cover in my next analysis.

Yen Strengthens Despite Japan’s Q1 ContractionThe Japanese yen strengthened toward 145 per dollar, extending its rally for a fourth straight day, despite Japan’s economy shrinking by 0.2% in the first quarter, worse than forecasts. While the Bank of Japan acknowledged the risks posed by U.S. trade policies, it remains confident that rising wages and prices will support eventual policy normalization. Investors are closely watching U.S.-Japan trade negotiations, with Japan insisting that any deal must include the auto sector and that the 25% U.S. tariff on Japanese cars be removed.
Resistance is noted at 148.60, with further barriers at 149.80 and 151.20. Major support levels lie at 139.70, 137.00, and 135.00.
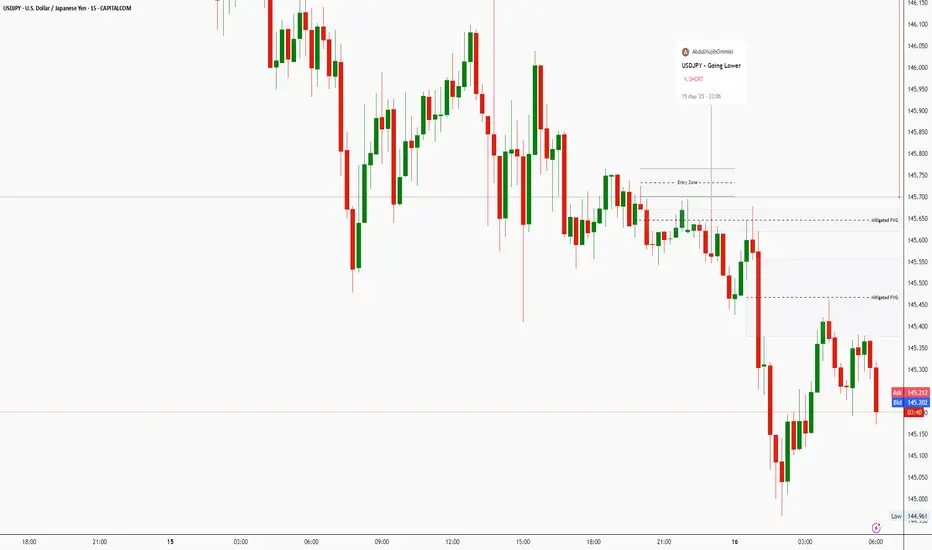
USDJPY Repriced for a Better Short OpportunityIn my initial trade shared during the Asian session, USDJPY swept the sell-side liquidity and formed a clear Fair Value Gap (FVG). Price action has now provided a refined entry point for a continuation short setup.
The recent liquidity sweep, followed by displacement, suggests that the market may aim for the recent low — with the potential to push even further if bearish momentum continues. My short position is now aligned with this structure, and I’ll be watching closely for signs of continuation or rejection near key support levels.
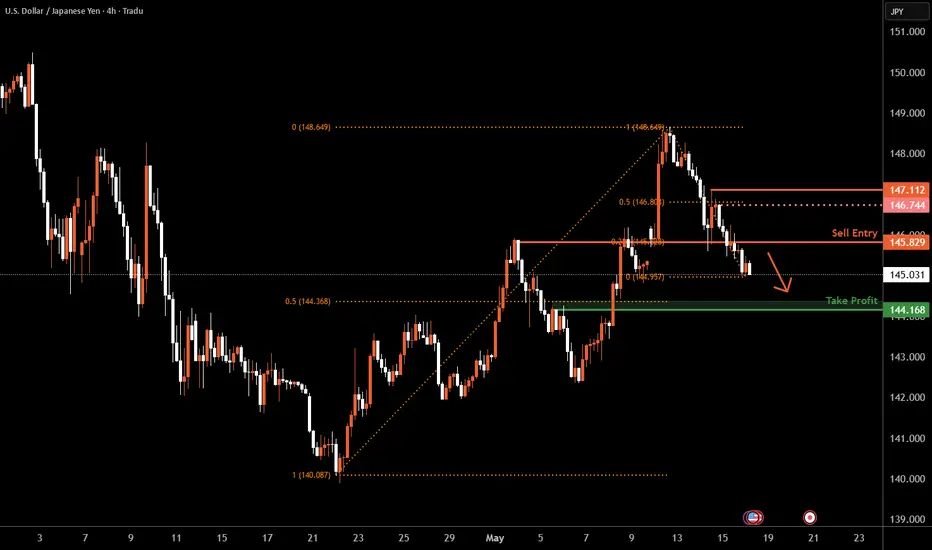
USD/JPY H4 | Overlap resistance at 23.6% Fibonacci retracementUSD/JPY is rising towards an overlap resistance and could potentially reverse off this level to drop lower.
Sell entry is at 145.82 which is an overlap resistance that aligns with the 23.6% Fibonacci retracement.
Stop loss is at 147.11 which is a level that sits above the 50.0% Fibonacci retracement and a swing-high resistance.
Take profit is at 144.16 which is a pullback support that aligns with the 50.0% Fibonacci retracement.
High Risk Investment Warning
Trading Forex/CFDs on margin carries a high level of risk and may not be suitable for all investors. Leverage can work against you.
Stratos Markets Limited (tradu.com):
CFDs are complex instruments and come with a high risk of losing money rapidly due to leverage. 63% of retail investor accounts lose money when trading CFDs with this provider. You should consider whether you understand how CFDs work and whether you can afford to take the high risk of losing your money.
Stratos Europe Ltd (tradu.com):
CFDs are complex instruments and come with a high risk of losing money rapidly due to leverage. 63% of retail investor accounts lose money when trading CFDs with this provider. You should consider whether you understand how CFDs work and whether you can afford to take the high risk of losing your money.
Stratos Global LLC (tradu.com):
Losses can exceed deposits.
Please be advised that the information presented on TradingView is provided to Tradu (‘Company’, ‘we’) by a third-party provider (‘TFA Global Pte Ltd’). Please be reminded that you are solely responsible for the trading decisions on your account. There is a very high degree of risk involved in trading. Any information and/or content is intended entirely for research, educational and informational purposes only and does not constitute investment or consultation advice or investment strategy. The information is not tailored to the investment needs of any specific person and therefore does not involve a consideration of any of the investment objectives, financial situation or needs of any viewer that may receive it. Kindly also note that past performance is not a reliable indicator of future results. Actual results may differ materially from those anticipated in forward-looking or past performance statements. We assume no liability as to the accuracy or completeness of any of the information and/or content provided herein and the Company cannot be held responsible for any omission, mistake nor for any loss or damage including without limitation to any loss of profit which may arise from reliance on any information supplied by TFA Global Pte Ltd.
The speaker(s) is neither an employee, agent nor representative of Tradu and is therefore acting independently. The opinions given are their own, constitute general market commentary, and do not constitute the opinion or advice of Tradu or any form of personal or investment advice. Tradu neither endorses nor guarantees offerings of third-party speakers, nor is Tradu responsible for the content, veracity or opinions of third-party speakers, presenters or participants.
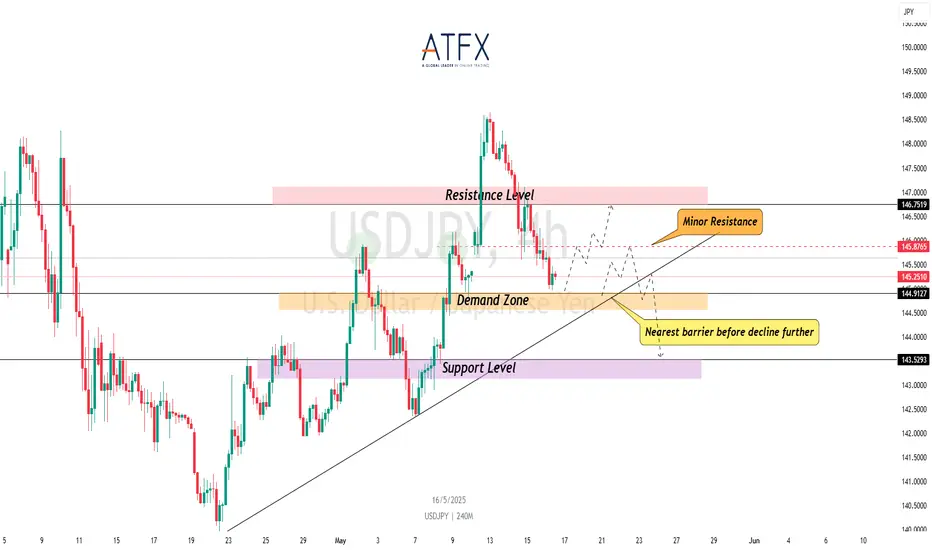
Bearish USD/JPY — Yen Strength FavoredCMCMARKETS:USDJPY Bearish Factors (USD Negative / JPY Positive):
Hawkish BoJ Expectations:
Despite Japan’s weaker Q1 GDP, BoJ officials—particularly Deputy Governor Uchida—have signalled openness to resuming rate hikes in 2025. A Reuters survey suggests a potential 25bps hike before year-end. This divergence from the Fed’s stance supports JPY strength.
Dovish Fed Outlook Intensifies:
Weak U.S. April PPI and retail sales figures reinforce expectations for multiple rate cuts this year. Falling Treasury yields and soft inflation readings weigh heavily on the dollar.
Resistance : 146.75 , 145.87
Support : 144.91 , 143.52
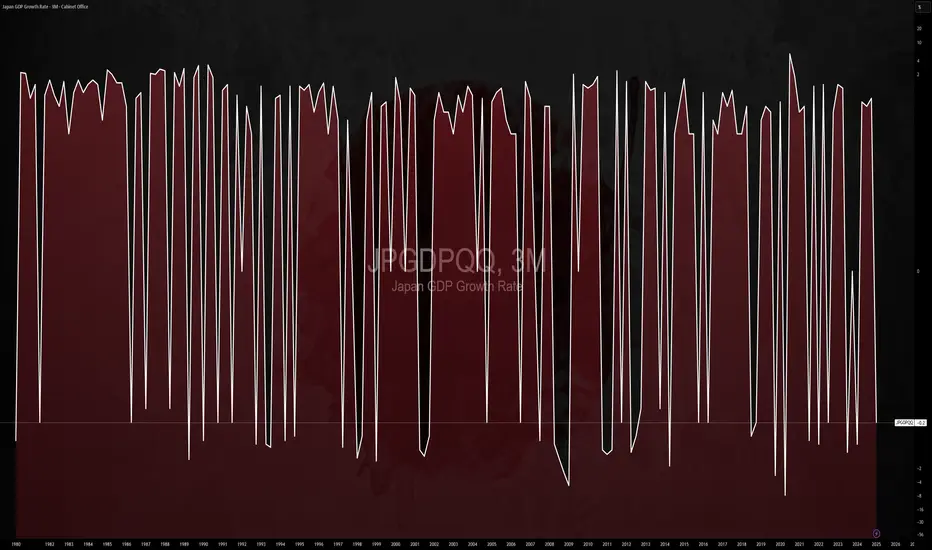
$JPGDBQQ -Japan's GDP Shrinks More than Expected (Q1/2025)$JPGDBQQ
Q1/2025
source: Cabinet Office, Japan
- Japan's GDP shrank 0.2% qoq in Q1 of 2025, compared with forecasts of a 0.1% fall and after a 0.6% growth in Q4, flash data showed.
It was the first GDP contraction in a year, amid worries over the impact of US trade policy under President Donald Trump.
On an annualized basis, the economy contracted 0.7%, worse than consensus of a 0.2% drop and a reversal from an upwardly revised 2.4% gain in Q4.
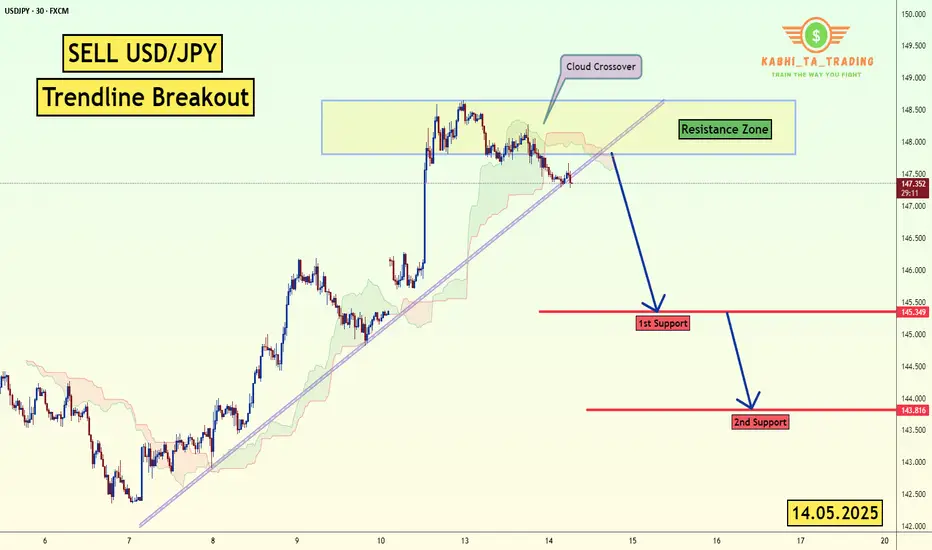
USD/JPY - Trendline Breakout (14.05.2025)The USD/JPY Pair on the M30 timeframe presents a Potential Selling Opportunity due to a recent Formation of a Trendline Breakout Pattern. This suggests a shift in momentum towards the downside in the coming hours.
Possible Short Trade:
Entry: Consider Entering A Short Position around Trendline Of The Pattern.
Target Levels:
1st Support – 145.34
2nd Support – 143.81
🎁 Please hit the like button and
🎁 Leave a comment to support for My Post !
Your likes and comments are incredibly motivating and will encourage me to share more analysis with you.
Best Regards, KABHI_TA_TRADING
Thank you.
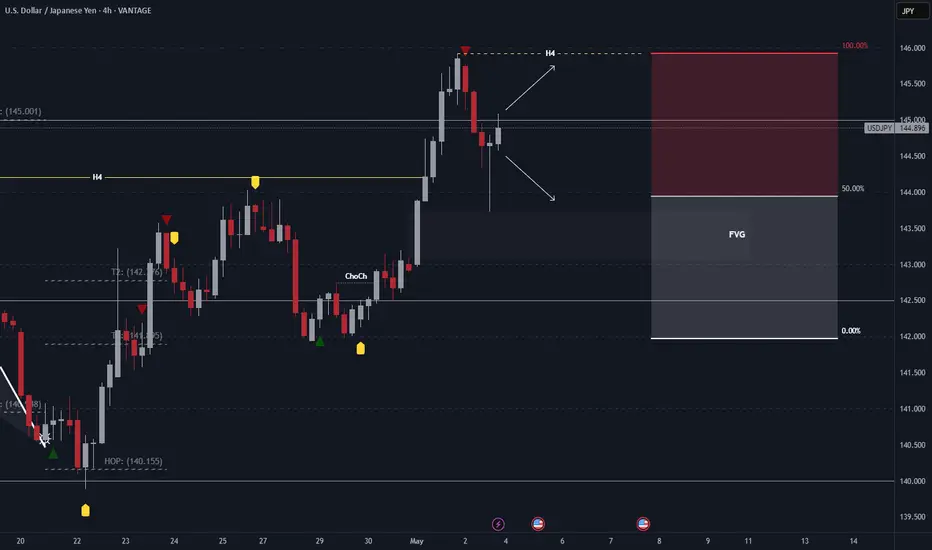
USDJPY: FVG Then Bullish Overflow?It has been a significant week for USD/JPY. Following a break of structure (BOS) on the 4-hour timeframe, price moved away from equilibrium, leaving behind a Fair Value Gap (FVG). As the new week begins, we may observe a false move designed to induce traders into premature short positions before a potential bullish reversal—or vice versa. Additionally, given the recent BOS, price may temporarily stall to facilitate order accumulation. Next week will be pivotal in determining the pair’s next direction.
Watch out for the key levels
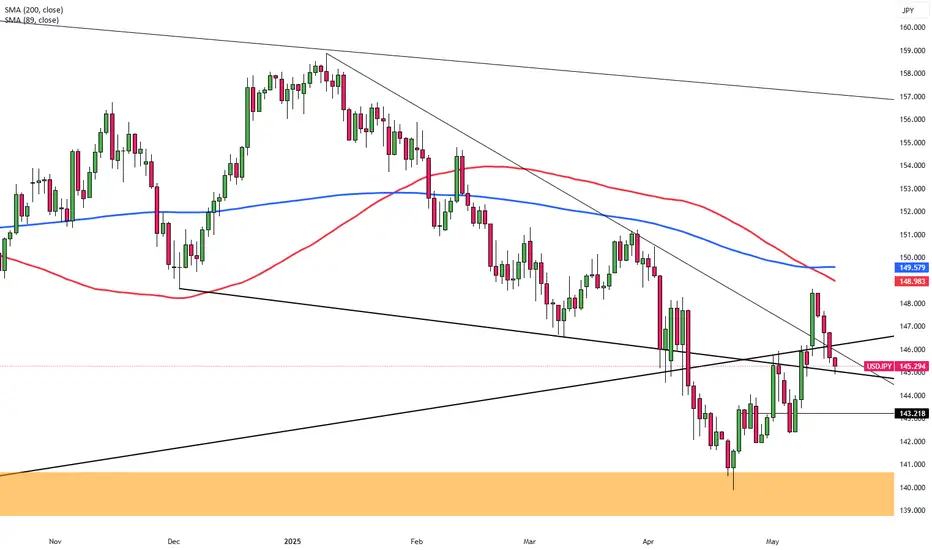
USOIL Temporary Drop seems inevitableYesterday's analysis perfectly predicted today's market movement. The USD/JPY rebounded from the low of 140.00, recovered from the downtrend channel, and then encountered resistance and pulled back at 148.65. Sellers are currently testing the support level of 146. If this level is broken, it may decline further to the round - number levels of 145.00 and 143.50. If 146 holds, buyers will attempt to break through the resistance level of 148.65 and further aim for the 200 - day moving average at 149.60.
Today, the released U.S. retail sales and PPI inflation data will provide clues about the consumer situation and the wholesale inflation landscape. The market expects that after a 1.5% increase in March, U.S. retail sales will be flat at 0% in April. Meanwhile, the PPI is projected to rise 0.2% after a 0.4% decline in March. The USD/JPY rebounded from the low of 140.00, recovered from the downtrend channel, and then encountered resistance and pulled back at 148.65. Sellers are currently testing the support level of 146. If this level is broken, it may decline further to the round - number levels of 145.00 and 143.50.
Federal Reserve Chair Powell will also give a speech, likely reiterating the Fed's stance that it will not be hasty to cut interest rates again until the impact of Trump's tariffs on the economy becomes clearer.
you are currently struggling with losses, or are unsure which of the numerous trading strategies to follow, at this moment, you can choose to observe the operations within our channel.

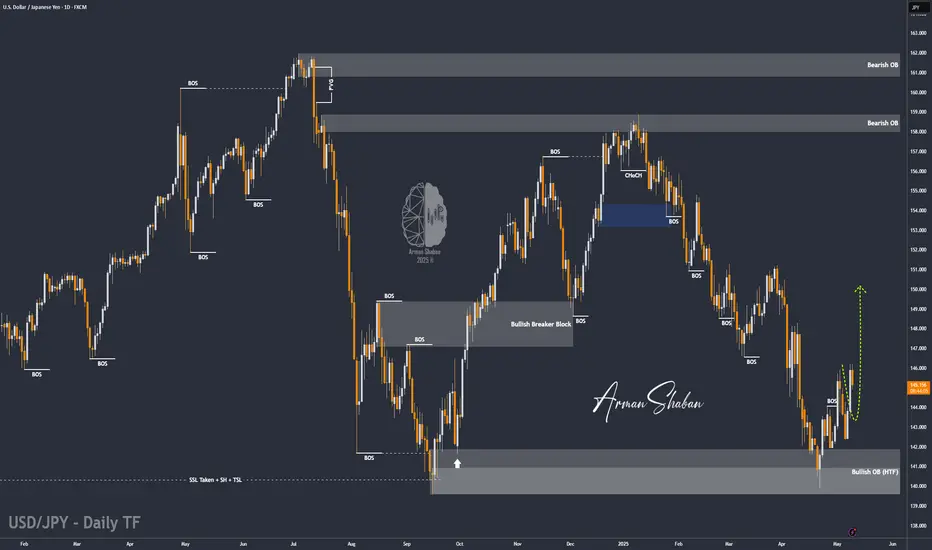
USD/JPY : More Bullish Move Ahead ? (READ THE CAPTION)By analyzing the USD/JPY chart on the daily timeframe, we can see that the price moved exactly as expected — first correcting down to the 142.5 area, and then rallying strongly to hit the 146.2 target. Currently, this pair is trading around 145.2, and if the price can hold above 145, we can still expect further upside movement on USDJPY. The next potential targets are 148.7 and 150 respectively. This analysis will be updated. The total return of this analysis so far has been over 720 pips!
Please support me with your likes and comments to motivate me to share more analysis with you and share your opinion about the possible trend of this chart with me !
Best Regards , Arman Shaban