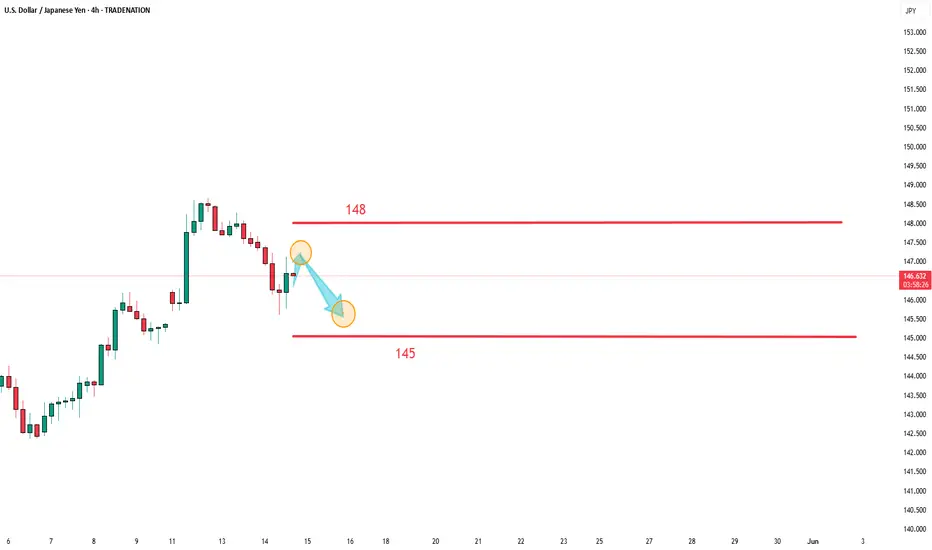
USOIL Temporary Drop seems inevitableYesterday's analysis perfectly predicted today's market movement. The USD/JPY rebounded from the low of 140.00, recovered from the downtrend channel, and then encountered resistance and pulled back at 148.65. Sellers are currently testing the support level of 146. If this level is broken, it may decline further to the round - number levels of 145.00 and 143.50. If 146 holds, buyers will attempt to break through the resistance level of 148.65 and further aim for the 200 - day moving average at 149.60.
Today, the released U.S. retail sales and PPI inflation data will provide clues about the consumer situation and the wholesale inflation landscape. The market expects that after a 1.5% increase in March, U.S. retail sales will be flat at 0% in April. Meanwhile, the PPI is projected to rise 0.2% after a 0.4% decline in March. The USD/JPY rebounded from the low of 140.00, recovered from the downtrend channel, and then encountered resistance and pulled back at 148.65. Sellers are currently testing the support level of 146. If this level is broken, it may decline further to the round - number levels of 145.00 and 143.50.
Federal Reserve Chair Powell will also give a speech, likely reiterating the Fed's stance that it will not be hasty to cut interest rates again until the impact of Trump's tariffs on the economy becomes clearer.
you are currently struggling with losses, or are unsure which of the numerous trading strategies to follow, at this moment, you can choose to observe the operations within our channel.
USDJPY

USD/JPY : More Bullish Move Ahead ? (READ THE CAPTION)By analyzing the USD/JPY chart on the daily timeframe, we can see that the price moved exactly as expected — first correcting down to the 142.5 area, and then rallying strongly to hit the 146.2 target. Currently, this pair is trading around 145.2, and if the price can hold above 145, we can still expect further upside movement on USDJPY. The next potential targets are 148.7 and 150 respectively. This analysis will be updated. The total return of this analysis so far has been over 720 pips!
Please support me with your likes and comments to motivate me to share more analysis with you and share your opinion about the possible trend of this chart with me !
Best Regards , Arman Shaban
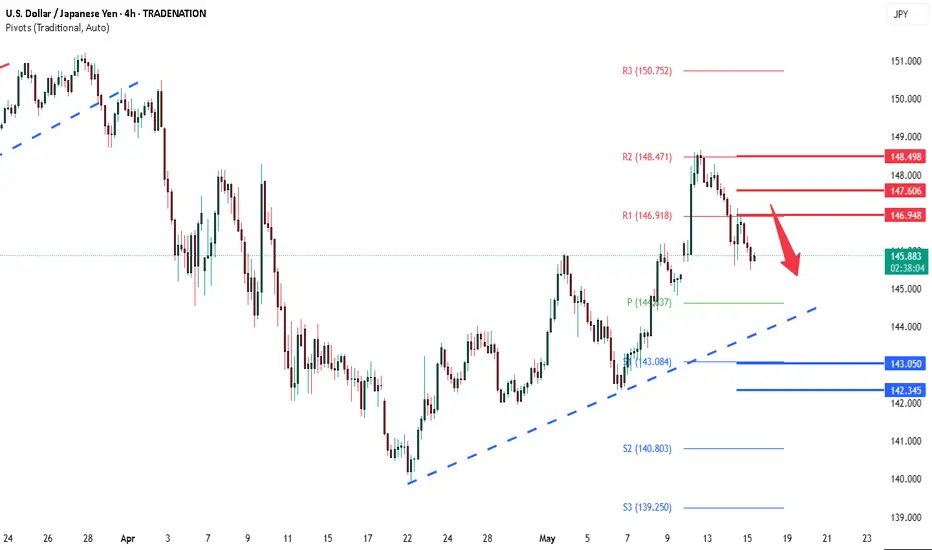
USDJPY INTRADAY downtrend continuation below 147.00USD/JPY remains in a bearish trend, as the longer-term downtrend continues to dominate market sentiment.
The key level to watch is 147.00, which marks the recent swing high and a strong resistance area. If the pair rises toward this level and gets rejected, it could resume its downward move toward support at 144.60, with further downside targets at 143.00 and 142.35 over time.
However, if the price breaks above 147.00 and posts a daily close above it, this would challenge the bearish outlook. In that case, the pair may continue higher, aiming for 147.60 and then possibly 148.50.
Conclusion:
The trend for USD/JPY is still bearish. A rejection at 147.00 could lead to more downside. But if the pair breaks and closes above 147.00, it may shift to a bullish move in the short term. Traders should watch how the price reacts around the 147.00 level for clues on the next direction.
This communication is for informational purposes only and should not be viewed as any form of recommendation as to a particular course of action or as investment advice. It is not intended as an offer or solicitation for the purchase or sale of any financial instrument or as an official confirmation of any transaction. Opinions, estimates and assumptions expressed herein are made as of the date of this communication and are subject to change without notice. This communication has been prepared based upon information, including market prices, data and other information, believed to be reliable; however, Trade Nation does not warrant its completeness or accuracy. All market prices and market data contained in or attached to this communication are indicative and subject to change without notice.
USDJPY and GBPJPY Further drop?Hello traders, this is a complete multiple timeframe analysis of this pair. We see could find significant trading opportunities as per analysis upon price action confirmation we may take this trade. Smash the like button if you find value in this analysis and drop a comment if you have any questions or let me know which pair to cover in my next analysis.

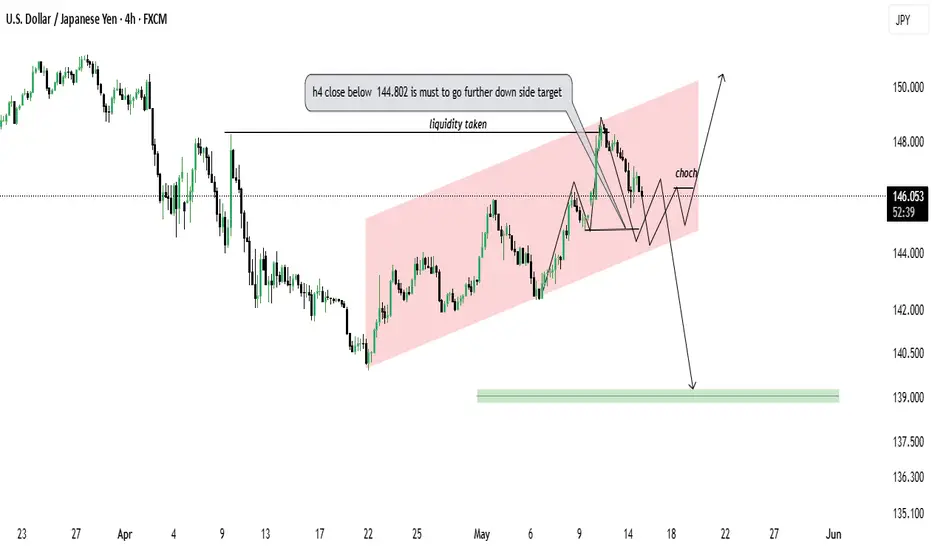
USD/JPY 4H Chart Analysis – Potential Breakdown or Reversal
**USD/JPY 4H Chart Analysis – Potential Breakdown or Reversal**
**Technical Summary:**
The chart shows USD/JPY trading within a rising channel, with recent price action indicating a possible bearish shift. Liquidity above a recent high has been taken, followed by a **change of character (CHoCH)** suggesting potential bearish intent.
**Key Highlights:**
* **Liquidity Grab:** Price swept prior highs, likely triggering buy-side liquidity.
* **CHoCH Identified:** Structure broke to the downside, indicating a bearish shift in market sentiment.
* **Critical Level:** A **4H close below 144.802** is crucial for confirmation of further downside movement.
* **Channel Support:** Price is currently testing the lower boundary of the ascending channel.
* **Scenarios:**
* **Bullish Case:** If the price respects the channel and pushes higher, targets near **150.000** could come into play.
* **Bearish Case:** A confirmed breakdown below **144.802** opens the path toward the **139.000 demand zone**.
**Outlook:**
* Monitor for 4H candle close below 144.802 for bearish confirmation.
* Alternatively, bullish continuation is valid if support holds and structure shifts upward again.
**Disclaimer:** This analysis is for educational purposes only. Always conduct your own research before making trading decisions.
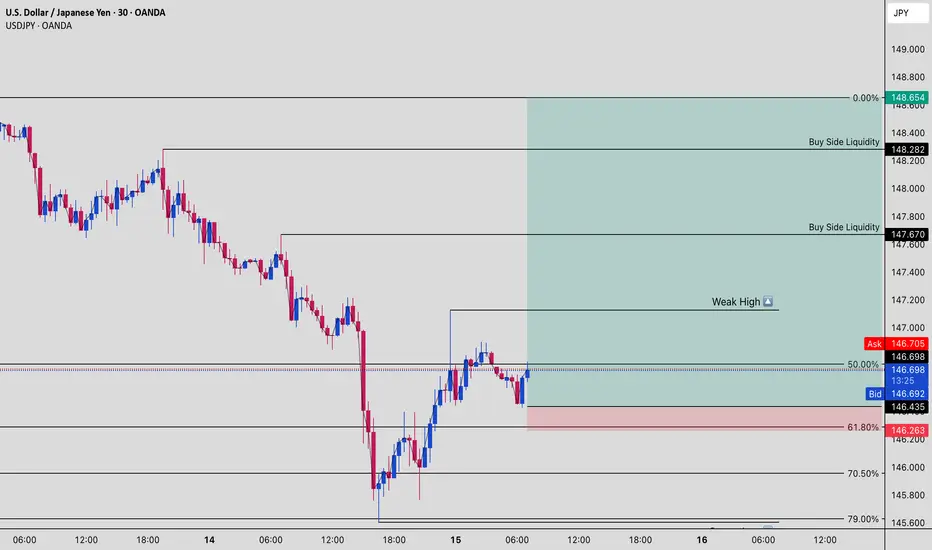
USDJPY Setup: Weak Highs, Smart Money Buys Liquidity!!📊 USDJPY is showing signs of a Smart Money reversal from the discount zone.
This 30-minute chart reveals institutional intentions hiding in plain sight — with clear signs of engineered liquidity grabs and the potential for a strong bullish continuation.
🧠 What’s Happening on the Chart:
✅ Price has swept sell-side liquidity below the recent lows
✅ Retraced cleanly to the 61.8% Fibonacci level at 146.26, a classic Smart Money entry zone
✅ The current price is hovering around the 50% retracement, forming a potential higher low structure
📈 Bullish Confluence:
Price is rebounding from a discount zone (golden ratio: 61.8% Fib)
There’s a clearly defined "weak high" marked around 147.00 — Smart Money typically targets these areas
Above that, there are two stacked buy-side liquidity levels:
147.670
148.282
Final target? The liquidity pool near 148.654 — a clean magnet for price
🎯 Trade Idea:
Long Bias from 146.26–146.43 zone (Smart Money re-entry)
Targets:
TP1: 147.00 (Weak High)
TP2: 147.670 (Buy Side Liquidity)
TP3: 148.282 – 148.654 (Full Liquidity Sweep)
Invalidation: Clean break below 146.20 with strong bearish volume
📌 Why This Setup Works:
This setup uses Smart Money Concepts (SMC):
Weak Highs often signal institutional targets
Fair Value Gap (FVG) + Fib confluence adds strong bullish probability
Retail shorts get trapped, thinking the rally was a pullback — while institutions accumulate at discount
🧠 Pro Tip:
Watch for confirmation with a bullish engulfing candle or break of short-term structure before full entry.
Front-running the Smart Money leads to losses. Let them move first.
💬 Comment "USDJPY MOVE" if you're planning to trade this setup
💾 Save this chart for later — this is how the big players trade FX.
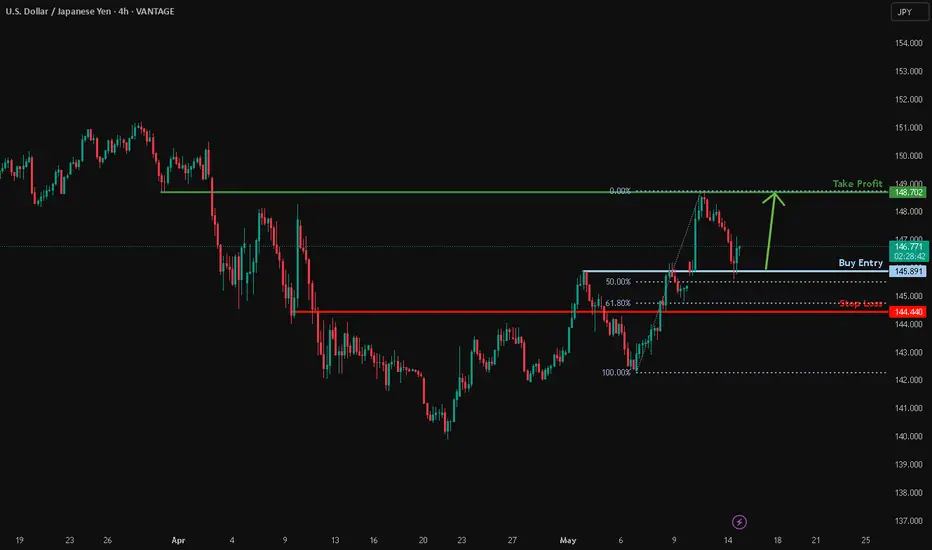
Potential bullish bounce?USD/JPY has bounced off the support level which is a pullback support that is slightly above the 50% Fibonacci retracement and could rise from this level to our take profit.
Entry: 145.89
Why we like it:
There is a pullback support level which is a pullback support that is slightly above the 50% Fibonacci retracement.
Stop loss: 144.44
Why we like it:
There is a pullback support level that is slightly below the 61.8% Fibonacci retracement.
Take profit: 148.70
Why we like it:
There is a pullback resistance level.
Enjoying your TradingView experience? Review us!
Please be advised that the information presented on TradingView is provided to Vantage (‘Vantage Global Limited’, ‘we’) by a third-party provider (‘Everest Fortune Group’). Please be reminded that you are solely responsible for the trading decisions on your account. There is a very high degree of risk involved in trading. Any information and/or content is intended entirely for research, educational and informational purposes only and does not constitute investment or consultation advice or investment strategy. The information is not tailored to the investment needs of any specific person and therefore does not involve a consideration of any of the investment objectives, financial situation or needs of any viewer that may receive it. Kindly also note that past performance is not a reliable indicator of future results. Actual results may differ materially from those anticipated in forward-looking or past performance statements. We assume no liability as to the accuracy or completeness of any of the information and/or content provided herein and the Company cannot be held responsible for any omission, mistake nor for any loss or damage including without limitation to any loss of profit which may arise from reliance on any information supplied by Everest Fortune Group.
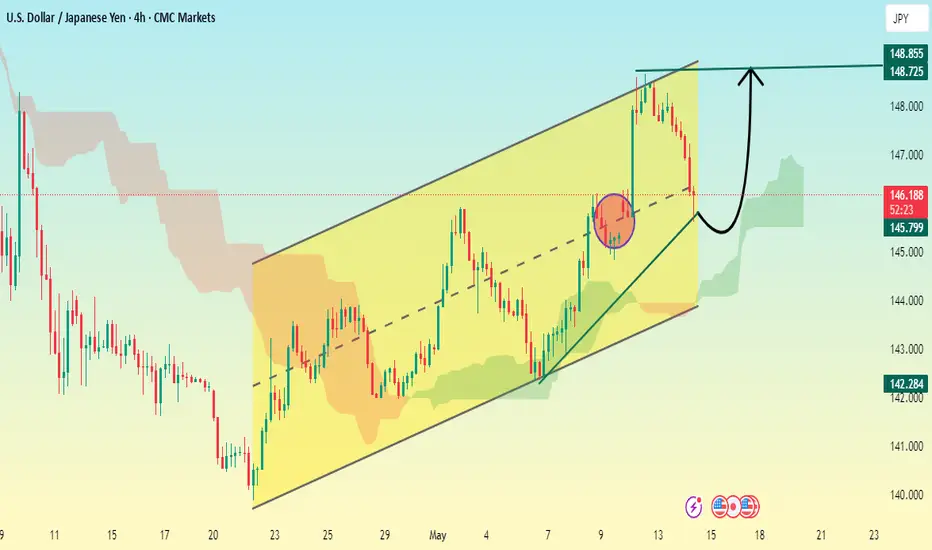
USDJPY 4H BULLISH ZONEBased on the USD/JPY 4-hour chart we provided, the market is currently in an ascending channel. A recent dip from the upper boundary of the channel suggests a possible retracement before a bounce back up. The chart indicates a bullish continuation pattern with a projected move toward the top of the channel and a marked target around 148.725–148.855.
Suggested Buy Trade Setup:
Entry Zone (Buy Limit):
Near the mid-channel or support trendline: 145.50–145.80
Take Profit Levels (TPs):
1. TP1: 147.00 – conservative target (near recent highs)
2. TP2: 148.00 – key resistance and psychological level
3. TP3: 148.725 – top of the channel
4. TP4: 148.855 – potential breakout level or final target
Stop Loss (SL):
Below channel support: 144.80–145.00, depending on risk appetite
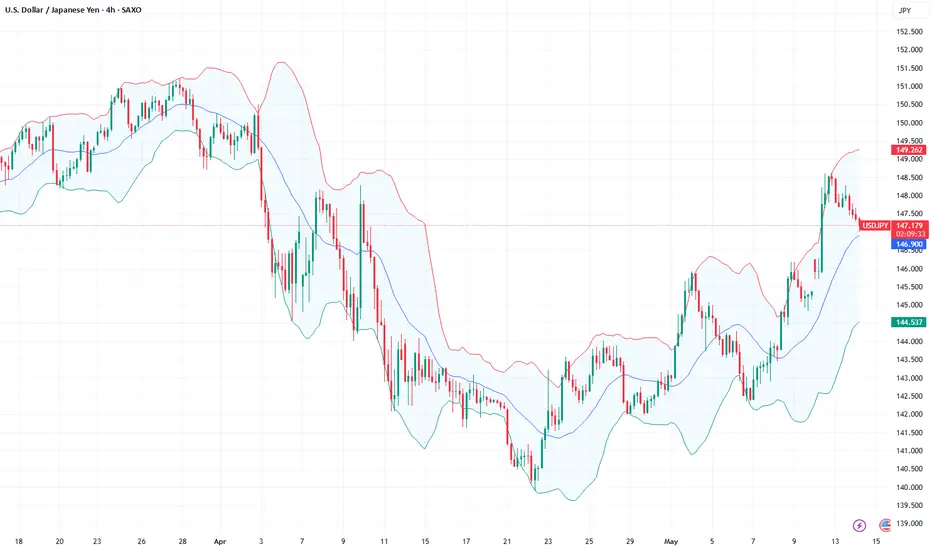
USDJPY: Bearish Trend ContinuesThe exchange rate of the US dollar against the Japanese yen continues its downward trend, further retreating from the 148.65 area (the highest level since April 3) touched earlier this week. During the European trading session, driven by multiple factors, the exchange rate dropped below 146.00. The daily chart of the US dollar against the Japanese yen shows that the exchange rate is in a downward channel. Currently, the price is retesting the important support area of 145.230, which has served as a resistance level on many occasions before. From the perspective of the Bollinger Bands indicator, the exchange rate has declined from the upper band (147.848) and is currently hovering near the middle band, indicating that the short - term downward pressure still exists.
you are currently struggling with losses, or are unsure which of the numerous trading strategies to follow, at this moment, you can choose to observe the operations within our channel.
$USDJPY buy order USD/JPY trading setup in the 4-hour timeframe 📈 | Overlap of FVG, Breaker Block, and Fibonacci 0.618 with strong bullish potential up to 151.218 🚀
FX:USDJPY buy limit @146.993
tp:
@148.881
@150.000
@151.212
stop: @145.810

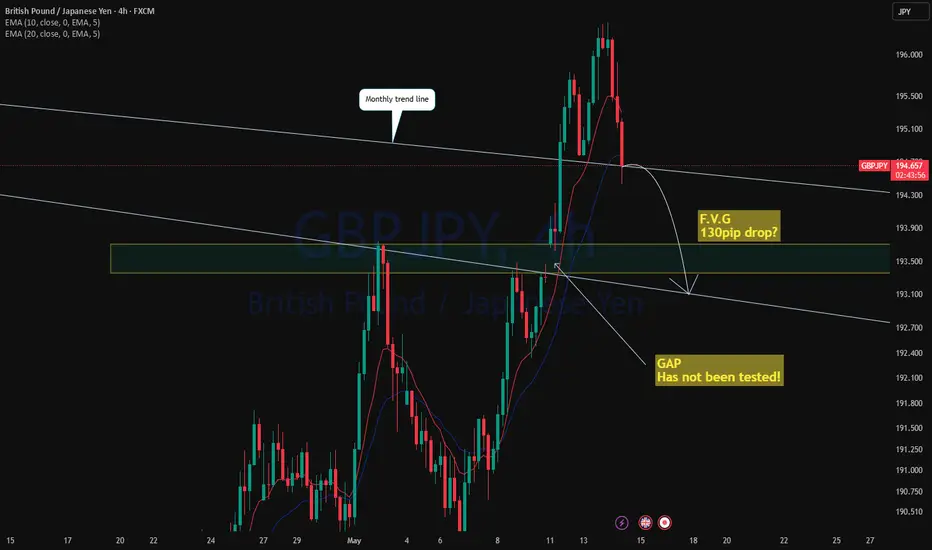
GBPJPY breaking the F.V.G?GBPJPY after breakout of the monthly long term trend line has got rejected for potential retest of the support. As the market has left a gap untested at 193.50 level, there is a high probability for the price to drop and retest and fill that gap. Currently price is approaching a fair value gap.
As first trade closed in profit, looking for another sell entry at 1h candle close!
XAUUSD Analysis todayHello traders, this is a complete multiple timeframe analysis of this pair. We see could find significant trading opportunities as per analysis upon price action confirmation we may take this trade. Smash the like button if you find value in this analysis and drop a comment if you have any questions or let me know which pair to cover in my next analysis.

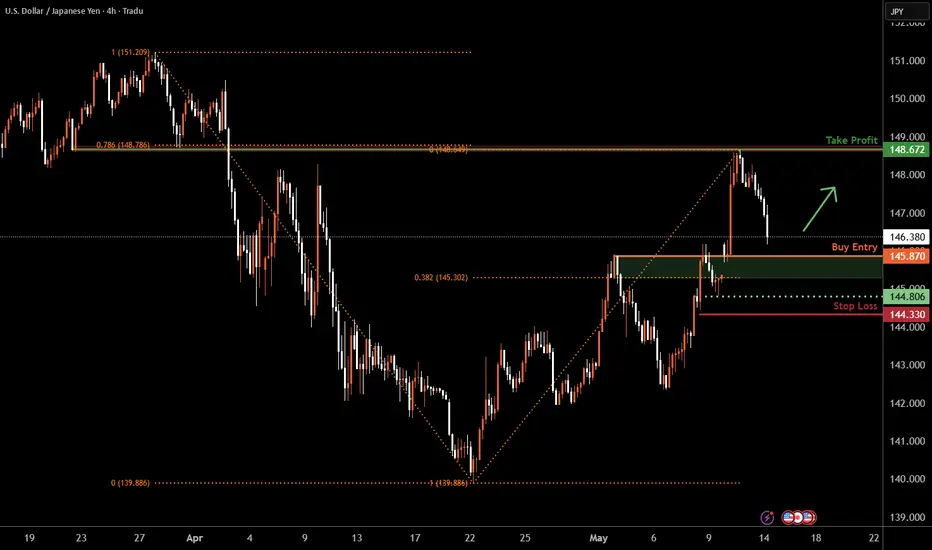
USD/JPY H4 | Potential bullish bounce off an overlap supportUSD/JPY is falling towards an overlap support and could potentially bounce off this level to climb higher.
Buy entry is at 145.87 which is an overlap support that aligns close the 38.2% Fibonacci retracement.
Stop loss is at 144.33 which is a level that lies underneath an overlap support.
Take profit is at 148.67 which is an overlap resistance that aligns with the 78.6% Fibonacci retracement.
High Risk Investment Warning
Trading Forex/CFDs on margin carries a high level of risk and may not be suitable for all investors. Leverage can work against you.
Stratos Markets Limited (tradu.com):
CFDs are complex instruments and come with a high risk of losing money rapidly due to leverage. 63% of retail investor accounts lose money when trading CFDs with this provider. You should consider whether you understand how CFDs work and whether you can afford to take the high risk of losing your money.
Stratos Europe Ltd (tradu.com):
CFDs are complex instruments and come with a high risk of losing money rapidly due to leverage. 63% of retail investor accounts lose money when trading CFDs with this provider. You should consider whether you understand how CFDs work and whether you can afford to take the high risk of losing your money.
Stratos Global LLC (tradu.com):
Losses can exceed deposits.
Please be advised that the information presented on TradingView is provided to Tradu (‘Company’, ‘we’) by a third-party provider (‘TFA Global Pte Ltd’). Please be reminded that you are solely responsible for the trading decisions on your account. There is a very high degree of risk involved in trading. Any information and/or content is intended entirely for research, educational and informational purposes only and does not constitute investment or consultation advice or investment strategy. The information is not tailored to the investment needs of any specific person and therefore does not involve a consideration of any of the investment objectives, financial situation or needs of any viewer that may receive it. Kindly also note that past performance is not a reliable indicator of future results. Actual results may differ materially from those anticipated in forward-looking or past performance statements. We assume no liability as to the accuracy or completeness of any of the information and/or content provided herein and the Company cannot be held responsible for any omission, mistake nor for any loss or damage including without limitation to any loss of profit which may arise from reliance on any information supplied by TFA Global Pte Ltd.
The speaker(s) is neither an employee, agent nor representative of Tradu and is therefore acting independently. The opinions given are their own, constitute general market commentary, and do not constitute the opinion or advice of Tradu or any form of personal or investment advice. Tradu neither endorses nor guarantees offerings of third-party speakers, nor is Tradu responsible for the content, veracity or opinions of third-party speakers, presenters or participants.
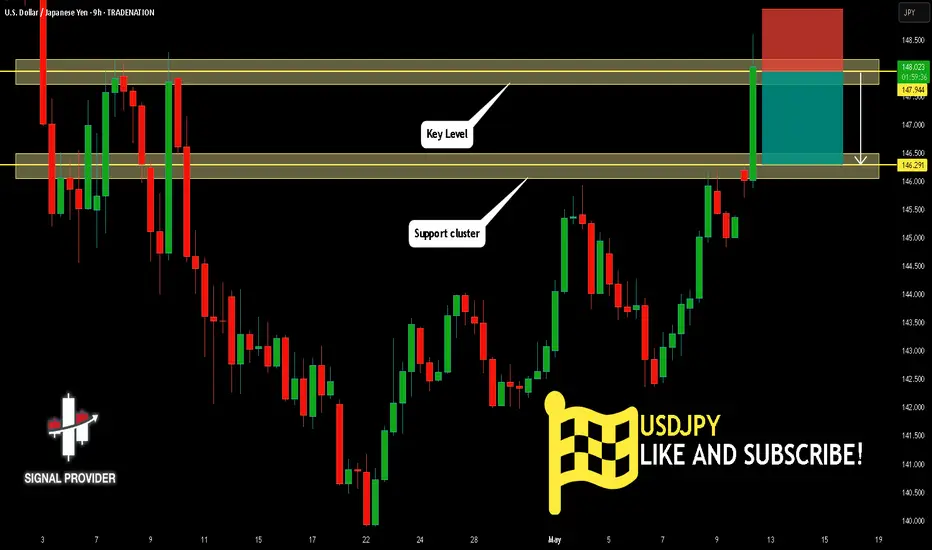
USDJPY Will Fall! Sell!
Please, check our technical outlook for USDJPY.
Time Frame: 9h
Current Trend: Bearish
Sentiment: Overbought (based on 7-period RSI)
Forecast: Bearish
The price is testing a key resistance 147.944.
Taking into consideration the current market trend & overbought RSI, chances will be high to see a bearish movement to the downside at least to 146.291 level.
P.S
The term oversold refers to a condition where an asset has traded lower in price and has the potential for a price bounce.
Overbought refers to market scenarios where the instrument is traded considerably higher than its fair value. Overvaluation is caused by market sentiments when there is positive news.
Disclosure: I am part of Trade Nation's Influencer program and receive a monthly fee for using their TradingView charts in my analysis.
Like and subscribe and comment my ideas if you enjoy them!
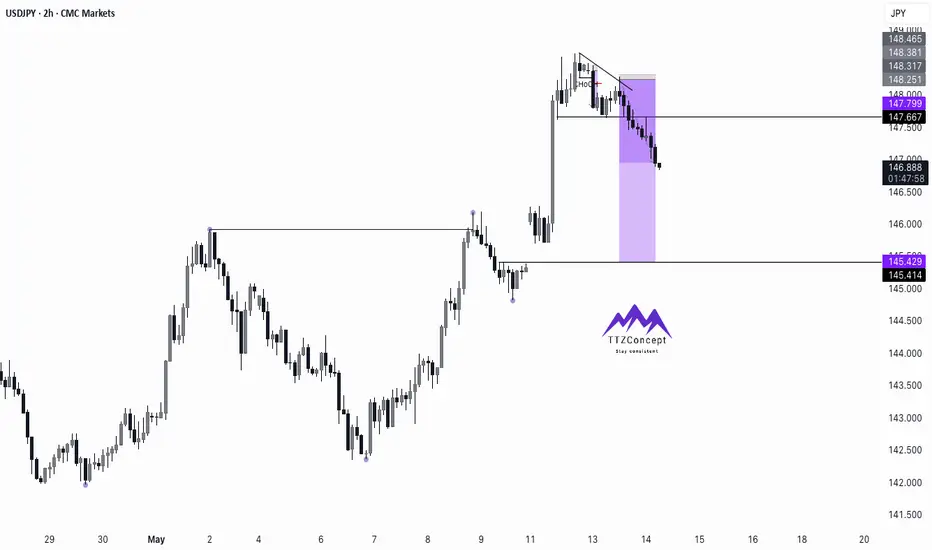
USDJPY SHORT📉 TRADE IDEA – SHORT USD/JPY
🗓️ May 14, 2025
🔻 Position: Short
📍 Entry: 148.164
🎯 Target: 145.414
🛑 Stop Loss: [Set based on your risk — e.g., 148.189
Reasoning:
Rejection from resistance zone above 148
Bearish structure forming on the 4H and daily charts
Possible shift in sentiment around JPY with BoJ pressure mounting
USD weakening as Fed rate expectations tilt dovish
📉 Targeting a drop toward key support at 145.414 — a clean level on the daily chart.
This is a short- to medium-term swing trade based on technicals + macro shifts.
Risk managed, watching upcoming Fed & BoJ commentary closely.
📊 Let the trade play out.
USDJPY EXPECTATIONJust looking at the market you can clearly see what is happening, we are currently on short for usdjpy and our expectation target.

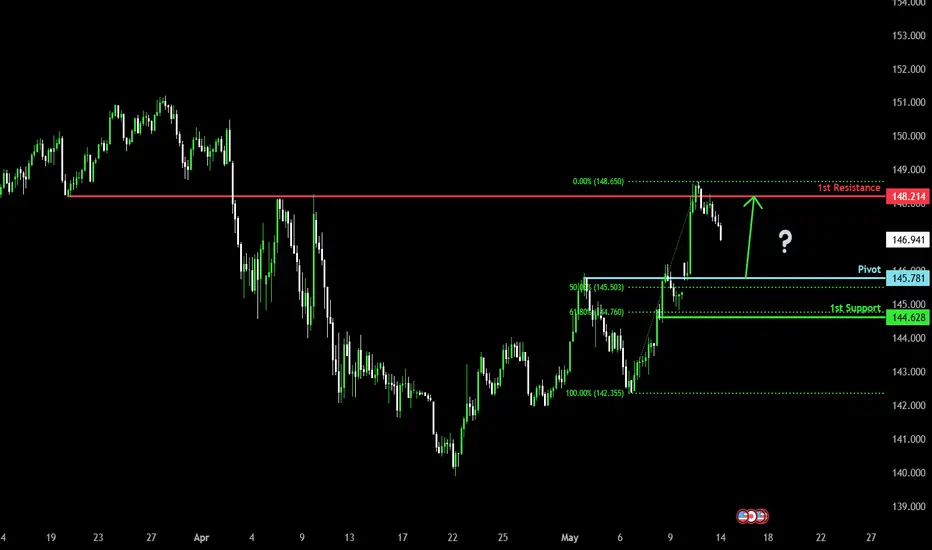
Bullish bounce off pullback support?USD/JPY is falling towards the pivot, which is a pullback support and could bounce to the 1st resistance identified as an overlap resistance.
Pivot: 145.78
1st Support: 144.62
1st Resistance: 148.21
Risk Warning:
Trading Forex and CFDs carries a high level of risk to your capital and you should only trade with money you can afford to lose. Trading Forex and CFDs may not be suitable for all investors, so please ensure that you fully understand the risks involved and seek independent advice if necessary.
Disclaimer:
The above opinions given constitute general market commentary, and do not constitute the opinion or advice of IC Markets or any form of personal or investment advice.
Any opinions, news, research, analyses, prices, other information, or links to third-party sites contained on this website are provided on an "as-is" basis, are intended only to be informative, is not an advice nor a recommendation, nor research, or a record of our trading prices, or an offer of, or solicitation for a transaction in any financial instrument and thus should not be treated as such. The information provided does not involve any specific investment objectives, financial situation and needs of any specific person who may receive it. Please be aware, that past performance is not a reliable indicator of future performance and/or results. Past Performance or Forward-looking scenarios based upon the reasonable beliefs of the third-party provider are not a guarantee of future performance. Actual results may differ materially from those anticipated in forward-looking or past performance statements. IC Markets makes no representation or warranty and assumes no liability as to the accuracy or completeness of the information provided, nor any loss arising from any investment based on a recommendation, forecast or any information supplied by any third-party.
Fundamental Market Analysis for May 14, 2025 USDJPYUSDJPY:
The Japanese Yen (JPY) continues to strengthen against its US counterpart for the second consecutive day on Wednesday and reacted weakly to the Producer Price Index (PPI), which was largely unchanged. Aggressive comments from Bank of Japan (BoJ) Deputy Governor Shin'ichi Uchida on Tuesday keep the door open for further policy normalisation and continue to serve as a tailwind for the Japanese Yen. The US Dollar (USD), on the other hand, continues to be threatened by weaker US consumer inflation data released on Tuesday, which raised the odds that the Federal Reserve (Fed) will cut interest rates at least twice this year. This is seen as another factor putting downward pressure on the USD/JPY pair.
Meanwhile, optimism about a 90-day tariff truce between the US and China continues to keep the market upbeat. This may deter traders from aggressively bullish bets on the safe-haven yen. Nevertheless, the diverging policy expectations between the BoJ and the Fed indicate that the path of least resistance for the low-yielding Yen lies to the upside and support the prospects of further downside for the USD/JPY pair. In the absence of any market-relevant economic data from the US, traders will focus on speeches from influential FOMC members. In addition, broader risk sentiment may give the currency pair some momentum.
Trading recommendation: SELL 147.10, SL 147.30, TP 146.10
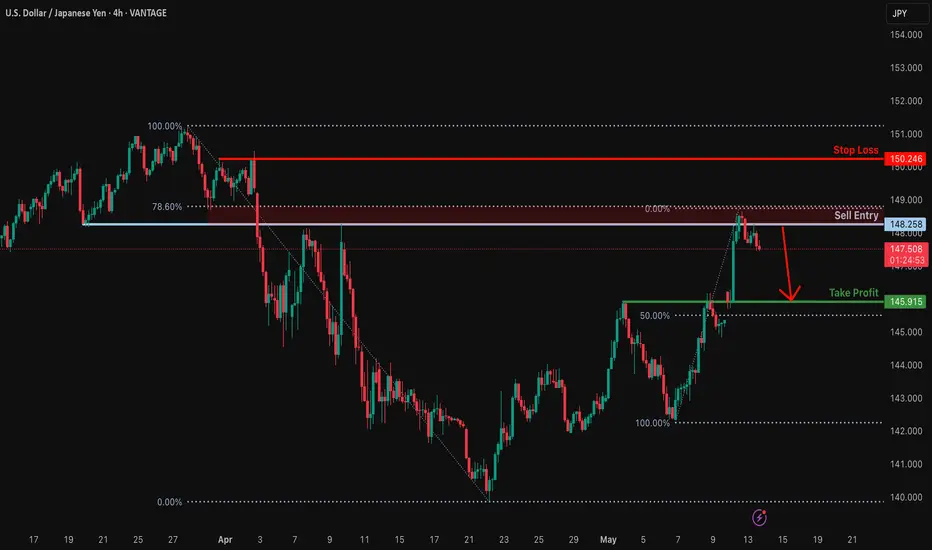
Potential bearish drop?USD/JPY has rejected off the resistance level which is an overlap resistance that is slightly below the 78.6% Fibonacci retracement and could drop from this level to our take profit.
Entry: 148.25
Why we like it:
There is an overlap resistance level that is slightly below the 78.6% Fibonacci retracement.
Stop loss: 150.24
Why we like it:
There is a pullback resistance level.
Take profit: 145.91
Why we like it:
There is a pullback support level that is slightly above the 50% Fibonacci retracement.
Enjoying your TradingView experience? Review us!
lease be advised that the information presented on TradingView is provided to Vantage (‘Vantage Global Limited’, ‘we’) by a third-party provider (‘Everest Fortune Group’). Please be reminded that you are solely responsible for the trading decisions on your account. There is a very high degree of risk involved in trading. Any information and/or content is intended entirely for research, educational and informational purposes only and does not constitute investment or consultation advice or investment strategy. The information is not tailored to the investment needs of any specific person and therefore does not involve a consideration of any of the investment objectives, financial situation or needs of any viewer that may receive it. Kindly also note that past performance is not a reliable indicator of future results. Actual results may differ materially from those anticipated in forward-looking or past performance statements. We assume no liability as to the accuracy or completeness of any of the information and/or content provided herein and the Company cannot be held responsible for any omission, mistake nor for any loss or damage including without limitation to any loss of profit which may arise from reliance on any information supplied by Everest Fortune Group.
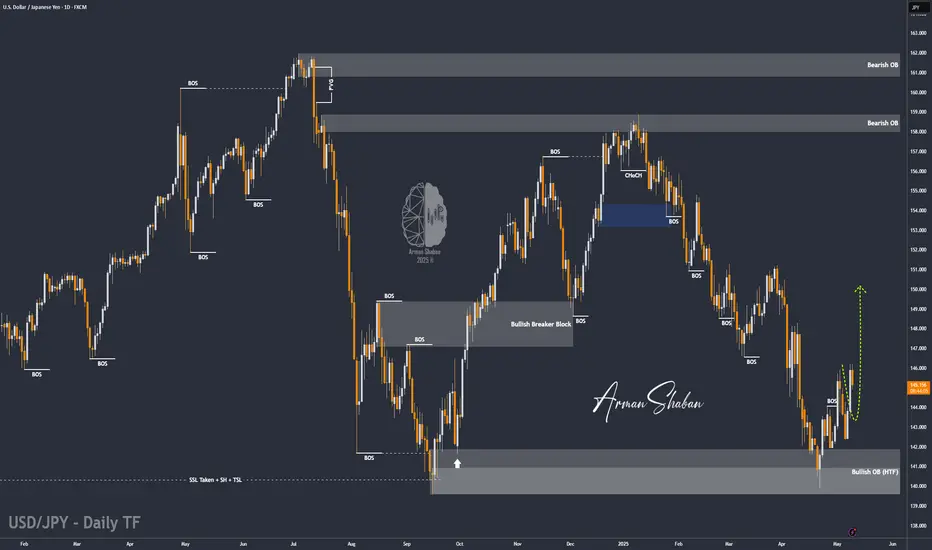
USD/JPY) Bullish reversal analysis Read The ChaptianSMC Trading point update
Technical Analysis USD/JPY suggests a bullish outlook based on the following key technical components:
1. Buying Zone: The chart identifies a green rectangular area labeled "BUYING ZONE" just above the 200 EMA (blue line at 144.079). This implies that price retracement into this zone could be an opportunity to go long (buy).
2. Support & Resistance:
Support Level: Clearly marked around 143.00, showing a previous demand area.
Resistance Level: Around the 145.800–146.000 region, price previously rejected here.
3. Bullish Pattern: The curved arrow suggests the formation of a bullish continuation pattern (possibly a cup & handle or flag), with the expectation of a breakout toward the upside.
4. Target Point: The target is projected at 148.153, implying a potential move of approximately 291.7 pips from the buying zone—suggesting a favorable risk-reward ratio.
5. RSI Indicator: The RSI (Relative Strength Index) is currently around 55, not in the overbought zone, indicating more room for upside movement.
Mr SMC Trading point
Summary of Idea:
Strategy: Buy near 145.00–145.20 (Buying Zone).
Stop Loss: Just below the 200 EMA or the lower bound of the green zone.
Take Profit: Near the 148.153 target.
Confirmation: Wait for bullish confirmation/candlestick reversal in the buying zone.
Pelas support boost 🚀 analysis follow)

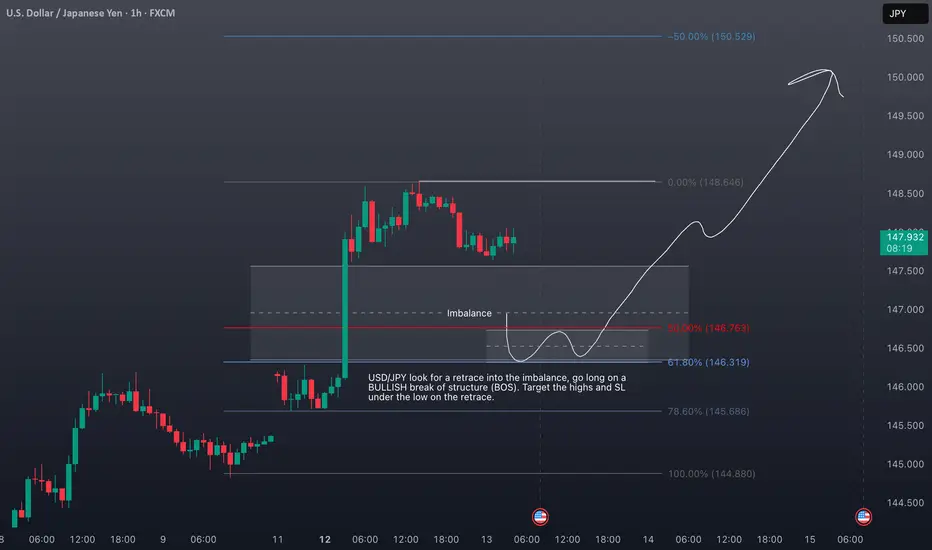
USDJPY Trade Plan: Long from Imbalance Zone on Bullish BOSUSDJPY Trade Idea & Analysis
Chart Context:
The 1H USDJPY chart shows a strong bullish impulse, followed by a consolidation and a potential retracement into a clear imbalance zone (highlighted between the 50% and 61.8% Fibonacci retracement levels, around 146.76–146.32). The market structure remains bullish, with higher highs and higher lows.
Market Fundamentals & Sentiment (as of May 2025):
USD Strength: The US dollar remains supported by persistent inflation and the Fed’s hawkish stance, with markets pricing in the possibility of further rate hikes or a prolonged period of higher rates.
JPY Weakness: The Bank of Japan continues its ultra-loose monetary policy, with no immediate signs of tightening. This divergence keeps upward pressure on USDJPY.
Risk Sentiment: Global risk appetite is stable, favoring carry trades and supporting USDJPY upside.
Trade Plan:
Look for a retrace into the imbalance zone (146.76–146.32). Enter long on a confirmed bullish break of structure (BOS) on lower timeframes. Target the recent swing highs (148.65 and above), with a stop loss below the retracement low.
Not financial advice.
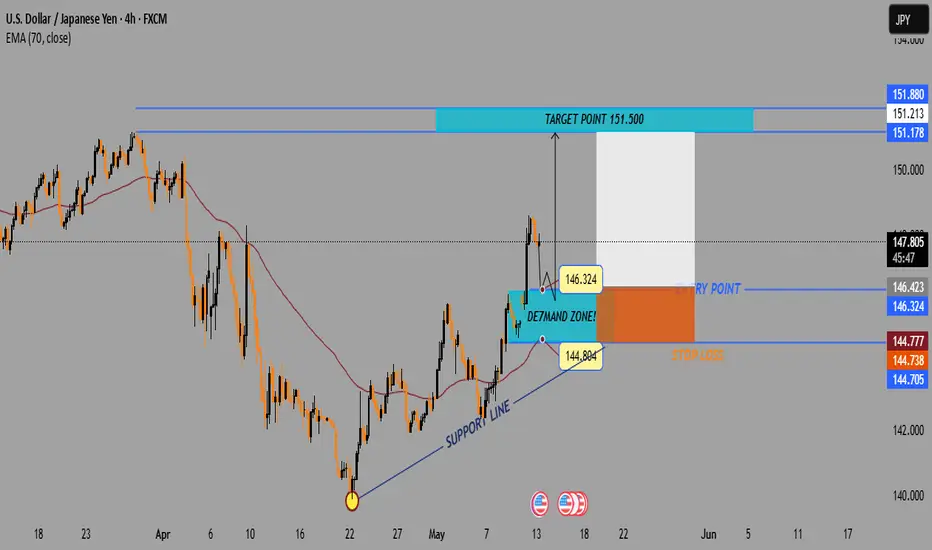
USD/JPY Bullish Setup – Demand Zone Buy Opportunity Toward 151.5🔍 Chart Overview (4H Timeframe):
Currency Pair: USD/JPY
Trend: 📈 Uptrend
EMA 70: 🔴 (144.776) – Price is trading above it = Bullish Bias
---
🟦 Demand Zone
📌 Zone: 144.804 – 146.324
💡 What it means: Strong buying interest expected here
🟢 Support line + EMA = Confluence zone!
---
✅ Entry Point:
📍 Between: 146.324 – 146.423
🎯 Best area for long (buy) position
📊 Wait for a pullback to this area before entering
---
❌ Stop Loss:
📉 Below demand zone
🔻 Range: 144.705 – 144.776
🛡️ Helps protect against unexpected drop
---
🎯 Target Point:
📈 151.500
🟩 Big reward area
🔥 Previous resistance zone = Ideal profit-taking point
---
🧭 Summary:
✅ Entry: 146.324
❌ Stop: 144.776
🎯 Target: 151.500
Risk-to-Reward: Excellent!
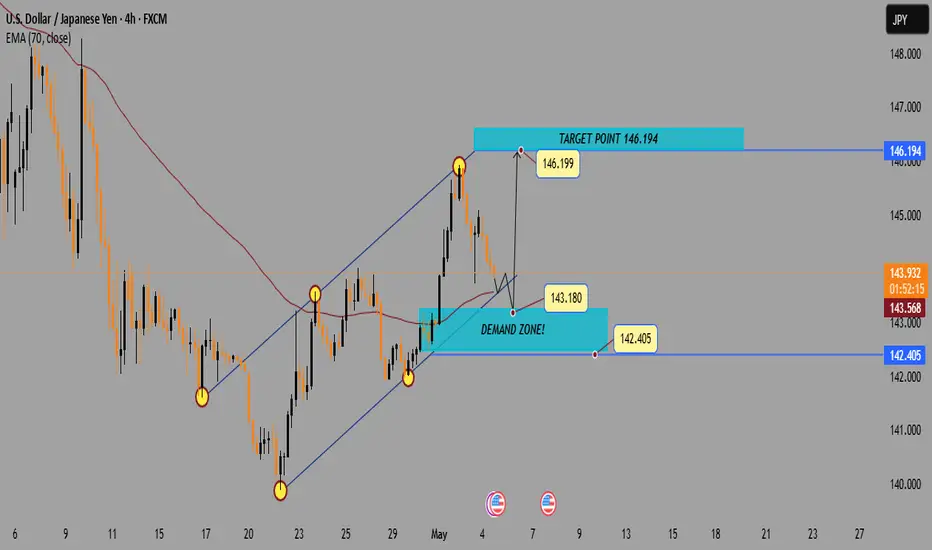
USD/JPY 4H Analysis: Demand Zone Re-Test Before Bullish Continua1. Trend Channel
🔼 Uptrend: The pair is moving inside an ascending channel.
▪️ Support: Lower boundary of the channel.
▪️ Resistance: Upper boundary of the channel.
2. Recent Price Action
🔴 Pullback: After reaching the top at 146.199, price is retracing.
📉 Price is now heading toward the Demand Zone.
3. Demand Zone
🟦 Demand Zone (142.405 – 143.180):
This zone could act as a strong support
Buyers might step in here
Watch for bullish patterns or rejections around this area
4. EMA 70
📏 EMA 70 (143.568) is slightly below current price (143.949) — this may offer temporary support/resistance.
5. Target
🎯 Target Point: 146.194
If price bounces from demand zone, this is the next bullish target.
Possible Scenario
1. 🔽 Price dips into the Demand Zone
2. 🟢 Bullish bounce → Confirm with candlestick signals
3. 🚀 Upside move targeting 146.194