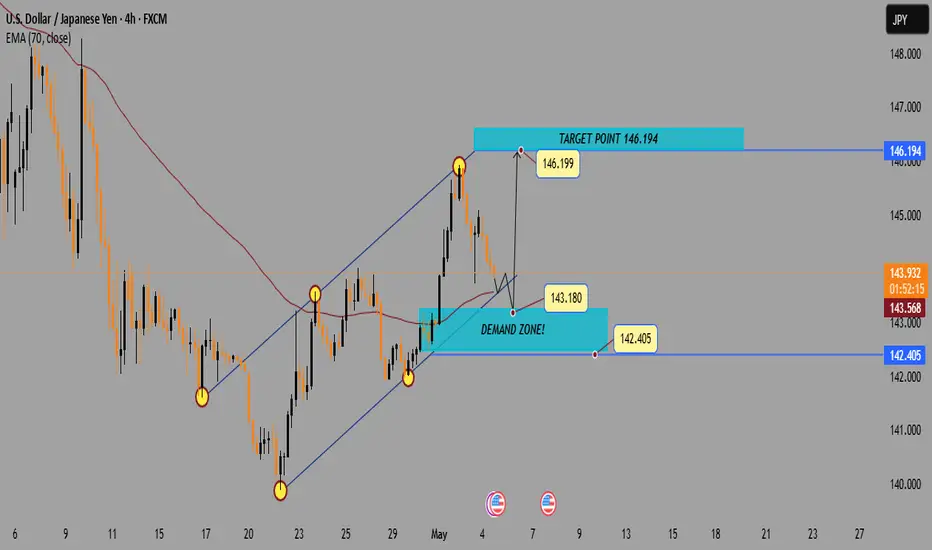
USD/JPY 4H Analysis: Demand Zone Re-Test Before Bullish Continua1. Trend Channel
🔼 Uptrend: The pair is moving inside an ascending channel.
▪️ Support: Lower boundary of the channel.
▪️ Resistance: Upper boundary of the channel.
2. Recent Price Action
🔴 Pullback: After reaching the top at 146.199, price is retracing.
📉 Price is now heading toward the Demand Zone.
3. Demand Zone
🟦 Demand Zone (142.405 – 143.180):
This zone could act as a strong support
Buyers might step in here
Watch for bullish patterns or rejections around this area
4. EMA 70
📏 EMA 70 (143.568) is slightly below current price (143.949) — this may offer temporary support/resistance.
5. Target
🎯 Target Point: 146.194
If price bounces from demand zone, this is the next bullish target.
Possible Scenario
1. 🔽 Price dips into the Demand Zone
2. 🟢 Bullish bounce → Confirm with candlestick signals
3. 🚀 Upside move targeting 146.194
USDJPY
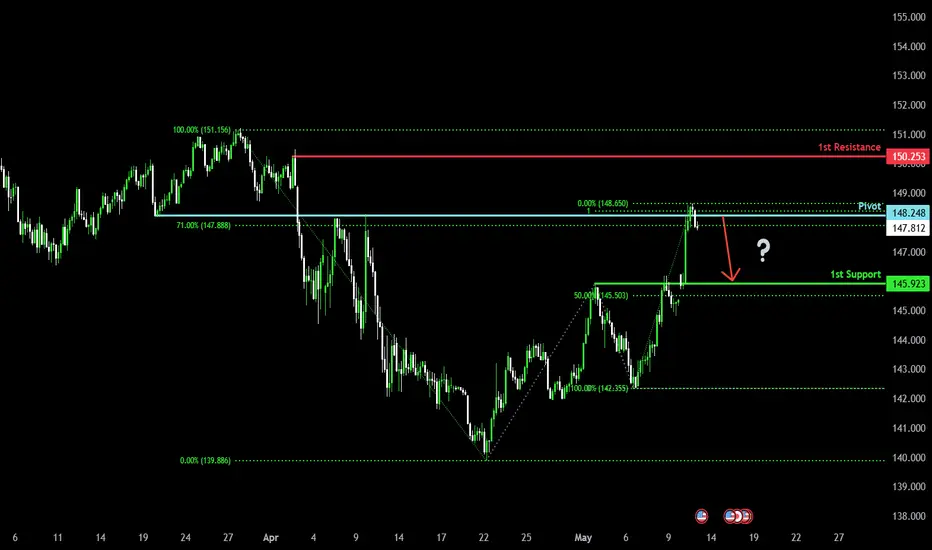
Bearish reversal off overlap resistance?USD/JPY has reacted off the pivot and could drop to the pullback support.
Pivot: 148.24
1st Support: 145.92
1st Resistance: 150.25
Risk Warning:
Trading Forex and CFDs carries a high level of risk to your capital and you should only trade with money you can afford to lose. Trading Forex and CFDs may not be suitable for all investors, so please ensure that you fully understand the risks involved and seek independent advice if necessary.
Disclaimer:
The above opinions given constitute general market commentary, and do not constitute the opinion or advice of IC Markets or any form of personal or investment advice.
Any opinions, news, research, analyses, prices, other information, or links to third-party sites contained on this website are provided on an "as-is" basis, are intended only to be informative, is not an advice nor a recommendation, nor research, or a record of our trading prices, or an offer of, or solicitation for a transaction in any financial instrument and thus should not be treated as such. The information provided does not involve any specific investment objectives, financial situation and needs of any specific person who may receive it. Please be aware, that past performance is not a reliable indicator of future performance and/or results. Past Performance or Forward-looking scenarios based upon the reasonable beliefs of the third-party provider are not a guarantee of future performance. Actual results may differ materially from those anticipated in forward-looking or past performance statements. IC Markets makes no representation or warranty and assumes no liability as to the accuracy or completeness of the information provided, nor any loss arising from any investment based on a recommendation, forecast or any information supplied by any third-party.
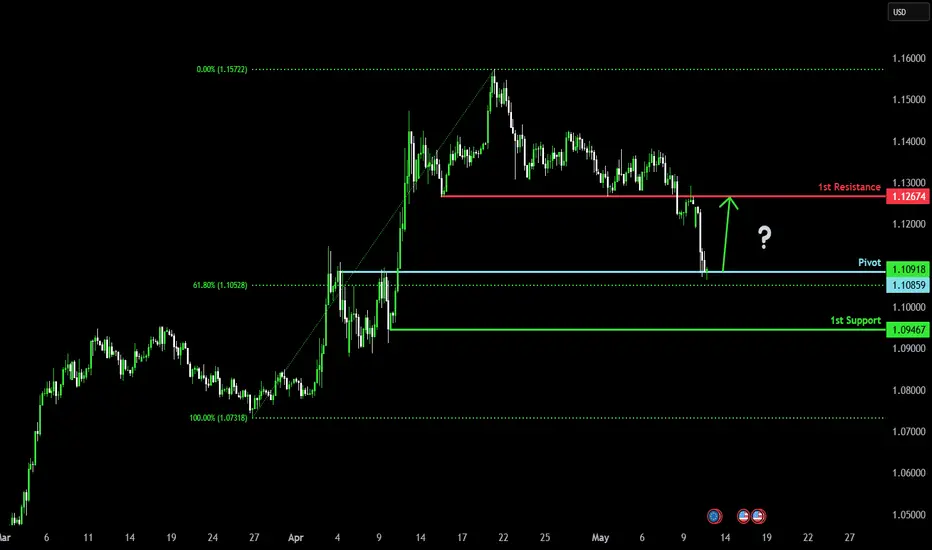
Bullish bounce?The Fiber (EUR/USD) is reacting off the pivot and could bounce to the 1st resistance.
Pivot: 1.1085
1st Support: 1.0946
1st Resistance: 1.1267
Risk Warning:
Trading Forex and CFDs carries a high level of risk to your capital and you should only trade with money you can afford to lose. Trading Forex and CFDs may not be suitable for all investors, so please ensure that you fully understand the risks involved and seek independent advice if necessary.
Disclaimer:
The above opinions given constitute general market commentary, and do not constitute the opinion or advice of IC Markets or any form of personal or investment advice.
Any opinions, news, research, analyses, prices, other information, or links to third-party sites contained on this website are provided on an "as-is" basis, are intended only to be informative, is not an advice nor a recommendation, nor research, or a record of our trading prices, or an offer of, or solicitation for a transaction in any financial instrument and thus should not be treated as such. The information provided does not involve any specific investment objectives, financial situation and needs of any specific person who may receive it. Please be aware, that past performance is not a reliable indicator of future performance and/or results. Past Performance or Forward-looking scenarios based upon the reasonable beliefs of the third-party provider are not a guarantee of future performance. Actual results may differ materially from those anticipated in forward-looking or past performance statements. IC Markets makes no representation or warranty and assumes no liability as to the accuracy or completeness of the information provided, nor any loss arising from any investment based on a recommendation, forecast or any information supplied by any third-party.
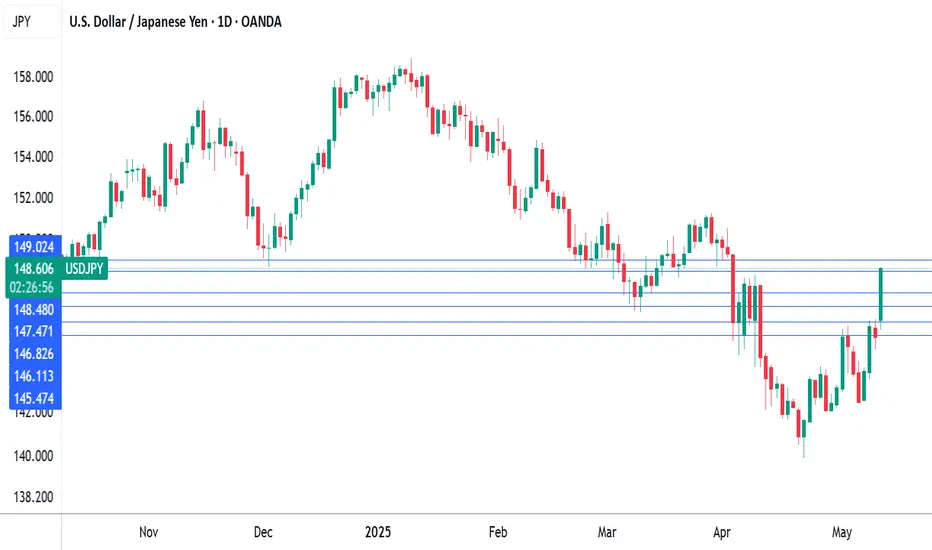
Japanese yen tumbles to five-week low on US-China tariff dealThe Japanese yen has started the week with sharp losses. USD/JPY is trading at 148.18, up 1.9% on the day. Earlier, the yen strengthened to 148.59, its strongest level since April 3.
The US and China have reached an agreement to slash tariffs on each other's products for 90 days. This would be a major de-escalation in the bruising tariff war between the world's two largest economies. Under the agreement, the US and China will slash tariffs by 115%, leaving US tariffs on China at 30% and China's tariffs on the US at 10%.
The tariff agreement has boosted risk appetite, sending global stock markets higher. The deal has weighed on safe-haven assets like the yen, which is sharply lower on Monday. Gold, another safe-haven, has plunged 3.1% today.
In Japan, household spending and wage growth were down in March. Household spending decelerated to 0.4% m/m, down sharply from 3.5% in February. Average Cash Earnings declined to 2.1% y/y, down from a downwardly revised 2.7% a month earlier. There was more bad news as service-sentiment for April eased, reflecting concern over US tariffs.
These numbers support the case for the Bank of Japan to continue its wait-and-see stance before raising interest rates. The BoJ wants to see inflation remain sustainable at 2%, which will require higher wage growth and stronger consumer spending.
Over the weekend, a host of Fed members made public statements. New York Fed President John Williams and Fed Governor Adriana Kugler both noted that current rate policy was in an appropriate place and suggested patience was needed. This message echoed Fed Chair Powell's remarks at last week's FOMC meeting, when he said the Fed would take a wait-and-see attitude due to the uncertainty over US tariffs.
USD/JPY has pushed above resistance at 146.83 and 147.48 and is testing resistance at 148.47. Above, there is resistance at 149.04
146.11 and 145.36 are the next support levels
you are currently struggling with losses, or are unsure which ofThe MACD indicator shows that the DIFF line has formed a golden cross with the DEA line, and the red histogram has continuously expanded, indicating that the upward trend has been established. At the same time, the RSI indicator has rebounded from the oversold area to the level of 59.777, suggesting that there is still room for the exchange rate to rise. It is worth noting that the CCI indicator has broken through the 200 level, implying that there is a possibility of a short-term technical correction.
In terms of volatility analysis, the Bollinger Bands have widened. The upper band is at 147.845 and the lower band is at 139.942, indicating that market volatility is increasing. Currently, the exchange rate is moving within an upward-sloping triangular consolidation pattern. 150 constitutes an important resistance level in the near term, while 146 forms a key support level. In the short term, if the exchange rate can effectively hold above the 148 mark, it will further confirm the continuation of the upward trend.
you are currently struggling with losses, or are unsure which of the numerous trading strategies to follow, at this moment, you can choose to observe the operations within our channel.

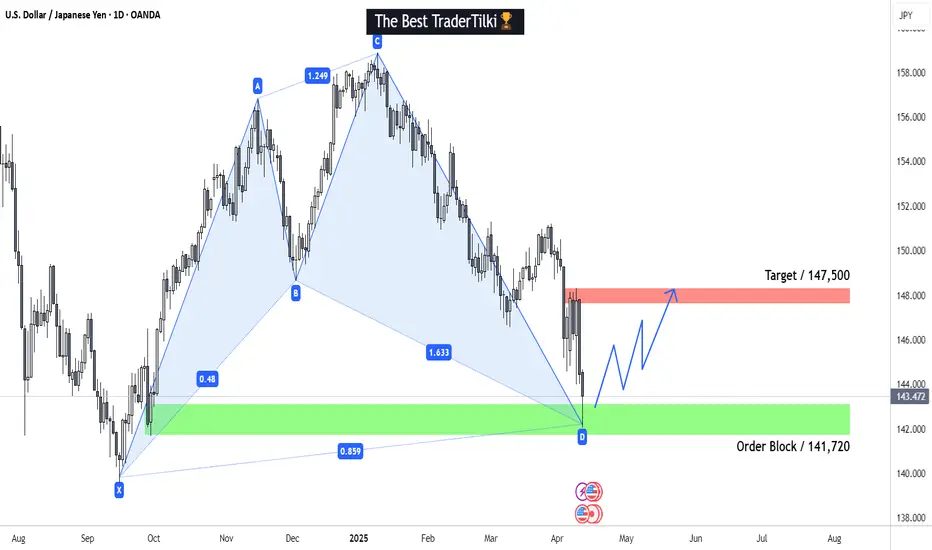
USDJPY / 1 DAY / BULLHello Guys;
My USDJPY target level is 147,500.
My target may come a bit late because this trade is a swing trade.
I would appreciate it very much if you do not miss your likes within the framework of Respect for Labor Thank you very much in advance
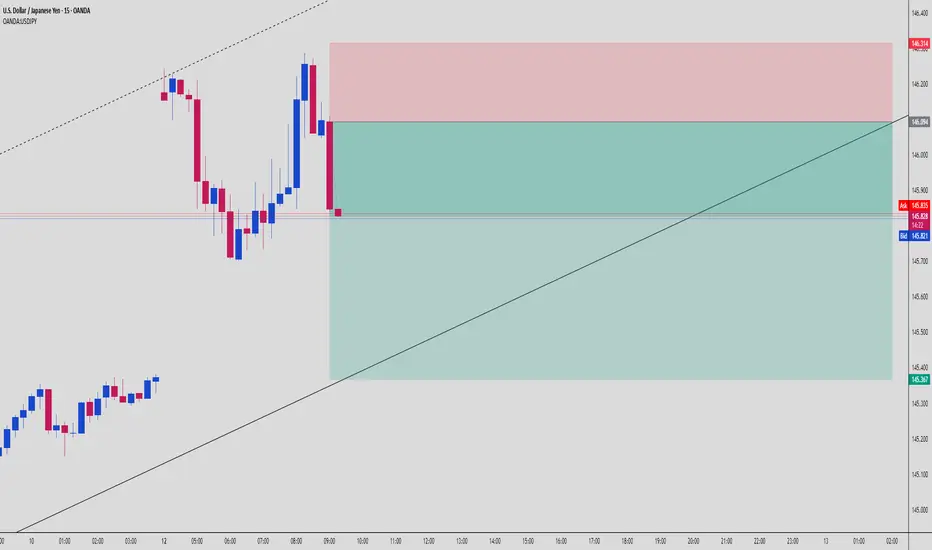
"USDJPY Just Printed a Trap — Smart Money Is In. Are You?"🧠 Smart Money Concepts (SMC) Setup Alert: USDJPY | 15-Min Timeframe
We’re spotting a high-probability bullish continuation setup on USDJPY backed by Smart Money logic. Let’s unpack what’s happening:
🧭 1. Liquidity Grab at the Low
Notice how price created a false breakdown below prior structure — a classic liquidity hunt. Late sellers got trapped before price snapped back aggressively, triggering a Bullish Break of Structure (BOS).
Smart Money needed to grab liquidity before running price higher. Textbook manipulation.
🟩 2. Refined Entry Zone: Discount + Bullish Order Flow
Price has now retraced back to a discount zone, entering the premium-to-discount pullback area. Buyers are expected to defend this level, creating the potential for a bullish continuation.
This entry is cleanly defined by a buy-side imbalance (light green area) which overlaps with a bullish order block and internal trendline support.
📐 3. Risk-to-Reward (R:R) Setup
We’ve got an excellent R:R opportunity here:
🎯 Entry: Near 145.910
❌ Stop Loss: Just above 146.314 (invalidate bullish bias)
✅ Take Profit Zone: 145.367 (with continuation possible beyond)
This gives us roughly a 2.3R setup, highly favorable for swing entries.
🎯 4. Confluence
Trendline support holding
Bullish BOS confirmed
Imbalance filled
Liquidity grabbed
Order block respected
FVG forming structure for propulsion
Smart Money is likely to push price back toward internal liquidity highs — and possibly sweep them for a final exit.
📊 Strategy:
Wait for bullish engulfing or strong rejection wick from this discount zone to confirm entry.
Trail stop as structure develops on lower timeframes. This setup can also be compounded if price forms another internal BOS.
⚠️ Risk Reminder:
Don’t chase. Let price come to you.
Manage risk at all times.
One setup doesn’t define the day — consistency wins.
🧪 Summary:
USDJPY is giving Smart Money vibes — from the liquidity grab, clean BOS, internal order block, to an excellent R:R setup.
This is the kind of trade where you want to be the hunter, not the prey.
💬 Drop a 🔥 if you caught this move.
📩 Tag a trading buddy who needs to learn SMC.
📊 Stay smart. Trade with purpose.
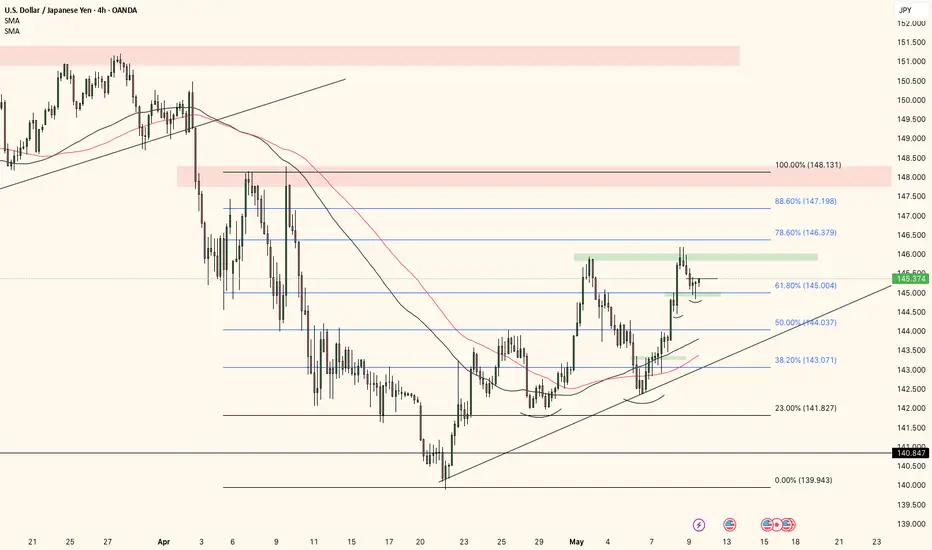
USD/JPY Breaks Out – Bulls Eye 149.35 Fibonacci TargetUSD/JPY surged nearly 2%, breaking above both its 50-day SMA and short-term downtrend line, signaling a potential trend reversal:
📈 Strong bullish candle, clearing the 146.50–147.50 zone
📊 RSI climbing through 60, showing accelerating bullish momentum
📉 MACD crossing the zero line, reinforcing the bullish signal
🔺 Next upside targets:
149.35 = 50% Fib retracement of the Dec–April decline
151.60 = 61.8% Fib and near 200-day SMA
Staying above 146.30 keeps the bias bullish. A close above 149.35 would open the door for a potential run toward 154.80.
-MW

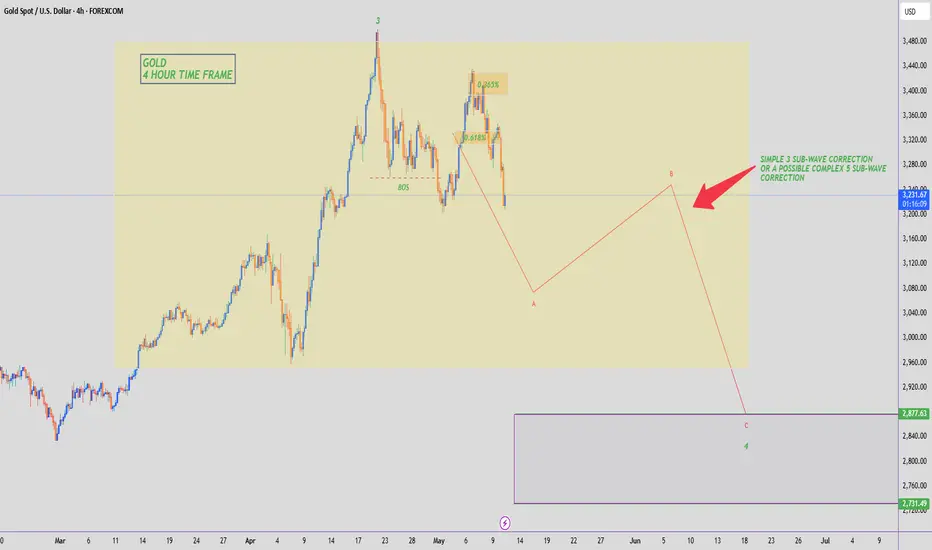
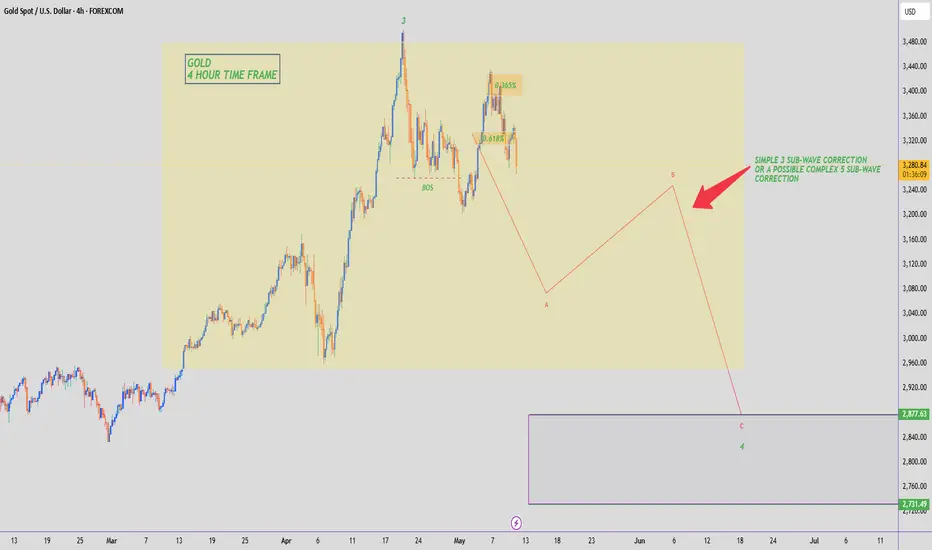
GOLD - WAVE 4 CORRECTION TO $2,800 (UPDATE)Huge melt off on Gold overnight! Price is down 1,100+ PIPS so far today & heading towards our predicted bias, which I showed you all on this analysis.
Heading down towards Wave A, before any internal correction to the upside is made for Wave B.
USDJPY Analysis todayHello traders, this is a complete multiple timeframe analysis of this pair. We see could find significant trading opportunities as per analysis upon price action confirmation we may take this trade. Smash the like button if you find value in this analysis and drop a comment if you have any questions or let me know which pair to cover in my next analysis.

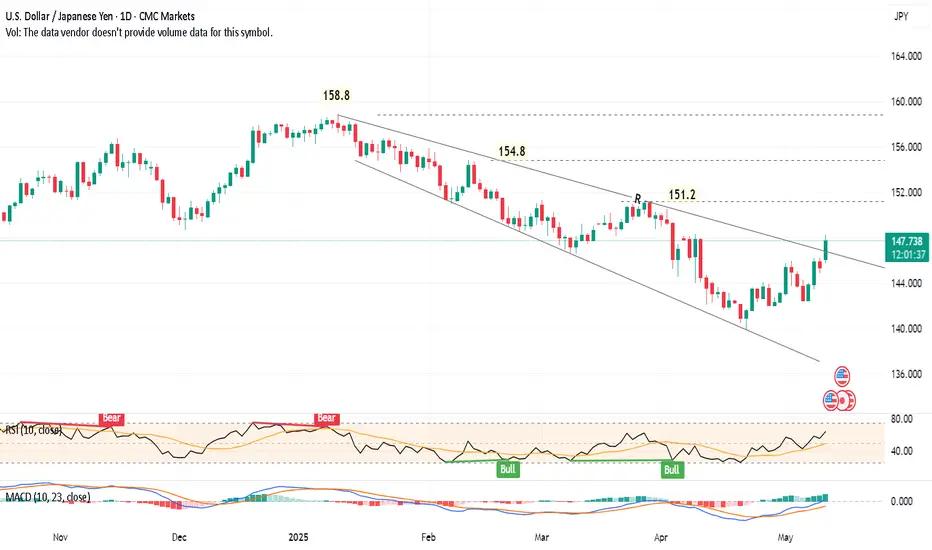
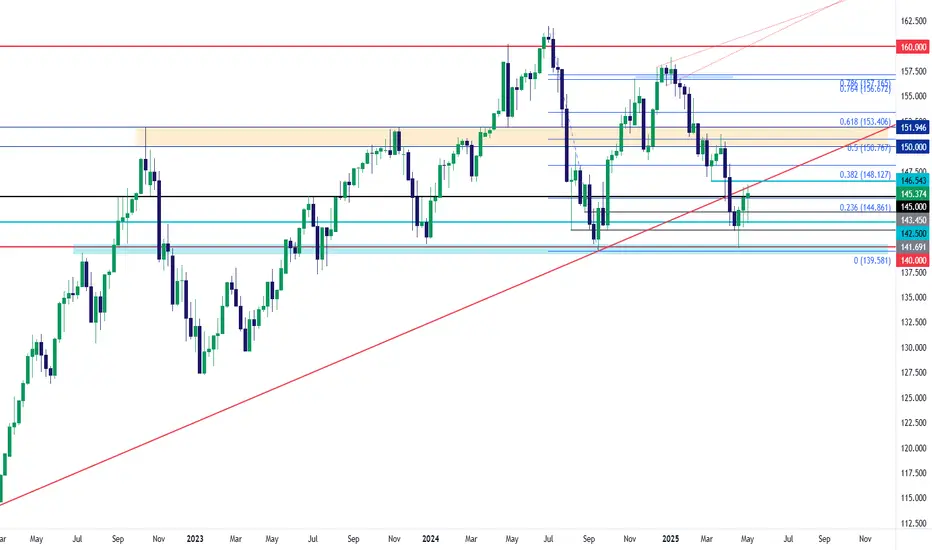
USDJPY is expected to target 165.5Daily chart,
USDJPY CMCMARKETS:USDJPY price is forming a falling expanding wedge pattern. After clear crossing of the line R, and stabilizing above it for 2 days, the target will be 165.5
Note that there are resistance levels on the way, especially the strong historical High (at 161.95)!
Stop loss below 145 - Consider a rising stop loss level as the price goes up.
Technical indicators:
RSI is positive
MACD is about to cross its signal line.
GOLD - WAVE 4 CORRECTION TO $2,800 (UPDATE)Gold has started the week extremely bearish, by gapping down & taking out last week’s low.
Running 1,500 PIPS in profit, from rejecting our 0.365% supply zone, which I highlighted for you all last week on my analysis.
Bearish reversal off overlap resistance?USD/JPY is rising towards the pivot, which is overlapping resistance. It could reverse from this level to the 1st support, which acts as pullback support.
Pivot: 147.17
1st Support: 142.42
1st Resistance: 151.00
Risk Warning:
Trading Forex and CFDs carries a high level of risk to your capital and you should only trade with money you can afford to lose. Trading Forex and CFDs may not be suitable for all investors, so please ensure that you fully understand the risks involved and seek independent advice if necessary.
Disclaimer:
The above opinions given constitute general market commentary, and do not constitute the opinion or advice of IC Markets or any form of personal or investment advice.
Any opinions, news, research, analyses, prices, other information, or links to third-party sites contained on this website are provided on an "as-is" basis, are intended only to be informative, is not an advice nor a recommendation, nor research, or a record of our trading prices, or an offer of, or solicitation for a transaction in any financial instrument and thus should not be treated as such. The information provided does not involve any specific investment objectives, financial situation and needs of any specific person who may receive it. Please be aware, that past performance is not a reliable indicator of future performance and/or results. Past Performance or Forward-looking scenarios based upon the reasonable beliefs of the third-party provider are not a guarantee of future performance. Actual results may differ materially from those anticipated in forward-looking or past performance statements. IC Markets makes no representation or warranty and assumes no liability as to the accuracy or completeness of the information provided, nor any loss arising from any investment based on a recommendation, forecast or any information supplied by any third-party.

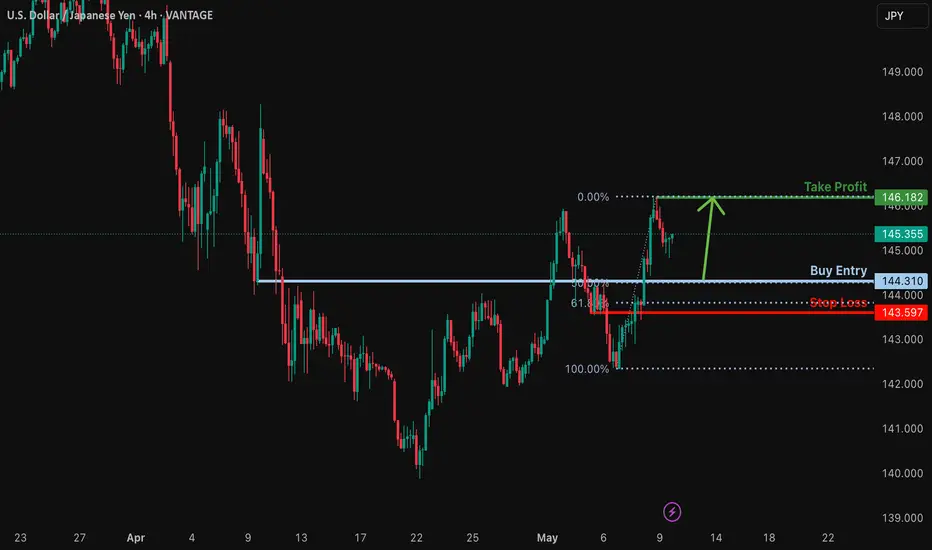
Bullish bounce off pullback support?USD/JPY is falling towards the support level which is a pullback support that aligns with the 50% Fibonacci retracement and could bounce from this level to our take profit.
Entry: 144.31
Why we like it:
There is a pullback support level that lines up with the 50% Fibonacci retracement.
Stop loss: 143.59
Why we like it:
There is a pullback support that lines up with the 61.8% Fibonacci retracement.
Take profit: 146.18
Why we like it:
There is a pullback resistance level.
Enjoying your TradingView experience? Review us!
Please be advised that the information presented on TradingView is provided to Vantage (‘Vantage Global Limited’, ‘we’) by a third-party provider (‘Everest Fortune Group’). Please be reminded that you are solely responsible for the trading decisions on your account. There is a very high degree of risk involved in trading. Any information and/or content is intended entirely for research, educational and informational purposes only and does not constitute investment or consultation advice or investment strategy. The information is not tailored to the investment needs of any specific person and therefore does not involve a consideration of any of the investment objectives, financial situation or needs of any viewer that may receive it. Kindly also note that past performance is not a reliable indicator of future results. Actual results may differ materially from those anticipated in forward-looking or past performance statements. We assume no liability as to the accuracy or completeness of any of the information and/or content provided herein and the Company cannot be held responsible for any omission, mistake nor for any loss or damage including without limitation to any loss of profit which may arise from reliance on any information supplied by Everest Fortune Group.
UJ ANALYSISUJ is bearish but has been bullish so I'll continue looking for buys until price show me otherwise.
GBPJPY and USDJPY Bullish bounce?Hello traders, this is a complete multiple timeframe analysis of this pair. We see could find significant trading opportunities as per analysis upon price action confirmation we may take this trade. Smash the like button if you find value in this analysis and drop a comment if you have any questions or let me know which pair to cover in my next analysis.

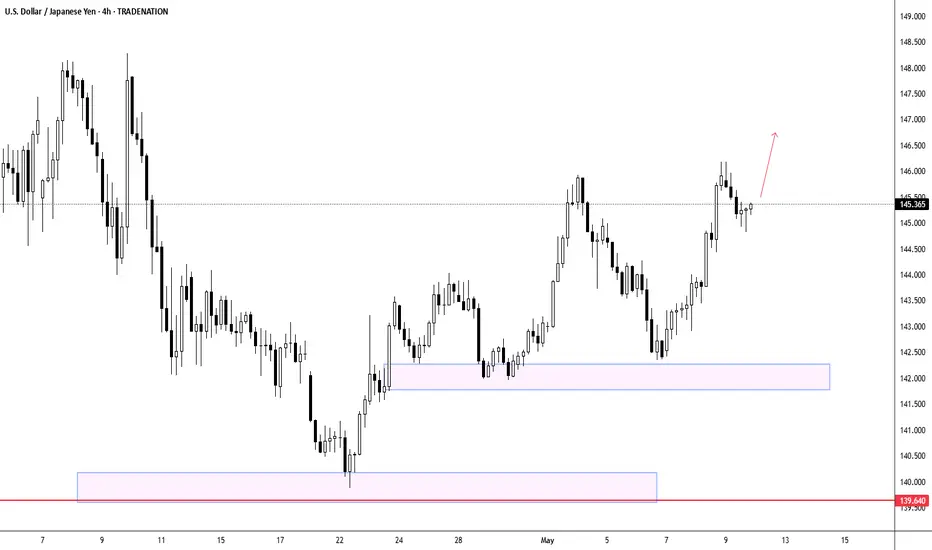
USDJPY - Technical Analysis Favors Dollar Strength AheadBased on the USD/JPY chart, we're seeing a promising bullish setup after the pair rebounded from support around 142.00. The price has formed a higher low and appears to be establishing a potential uptrend, having recently broken above the 145.00 resistance level. With the current price action showing resilience and momentum shifting to the upside, there's a higher probability of continued strength toward potential targets near the previous highs around 148.00. The formation of consecutive bullish candles above key support zones reinforces this positive outlook, suggesting buyers are regaining control after the April decline.
Disclosure: I am part of Trade Nation's Influencer program and receive a monthly fee for using their TradingView charts in my analysis.
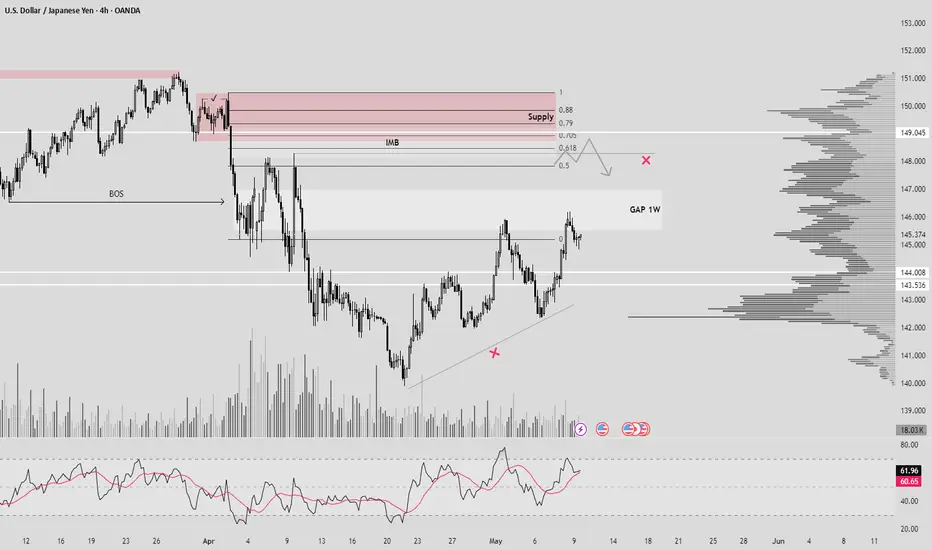
USDJPY 4HHello Traders! Here as you can see we have BOS + Supply. I expecting reversal on LTF after closing gap and take that liquidity(SMT).
P.S: 0.5 IMB + 0 zone Supply + OTE + Horizontal lever = ENTRY.
Have a good day!
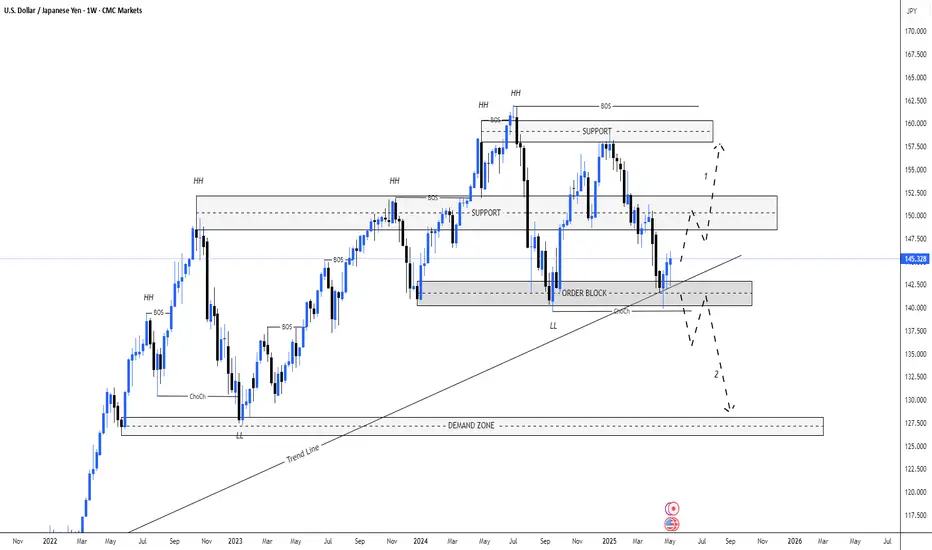
USDJPY WEEKLYHello Traders. This is my analysis for USDJPY. If it breaks out of the trend line, we can expect a significant drop. Let's hope it will make a false breakout from the trend line and continue bullish.
I am not a professional and I would be happy if you share your opinion in the comments.
USDJPY Set to Rise as Support Holds and Dollar Finds TailwindsUSDJPY looks poised for further upside following a period of consolidation and a successful retest of strong support around the 140.50 level. The weekly chart reveals a clear triple bottom pattern, reinforcing the strength of this support zone and suggesting renewed bullish momentum.
The US Dollar is starting to regain strength after a period of weakness, supported by improving U.S. economic data, sticky inflation, and a less dovish stance from the Federal Reserve. In contrast, Japan is unlikely to change its ultra-loose monetary policy in the near term, keeping rate differentials wide and favoring a stronger Dollar.
With the Bank of Japan expected to hold rates steady for the foreseeable future, capital is likely to continue flowing out of the yen. Carry trade flows remain intact, adding to the upward pressure on USDJPY.
Momentum indicators are turning higher, and price action is forming a steady base for another leg up. The market could target the 150 zone in the coming weeks, where the 50-week moving average may act as initial resistance.
As long as 140.50 holds, dips could offer attractive buying opportunities. A sustained move above 145.00 could trigger fresh bullish momentum and accelerate gains.

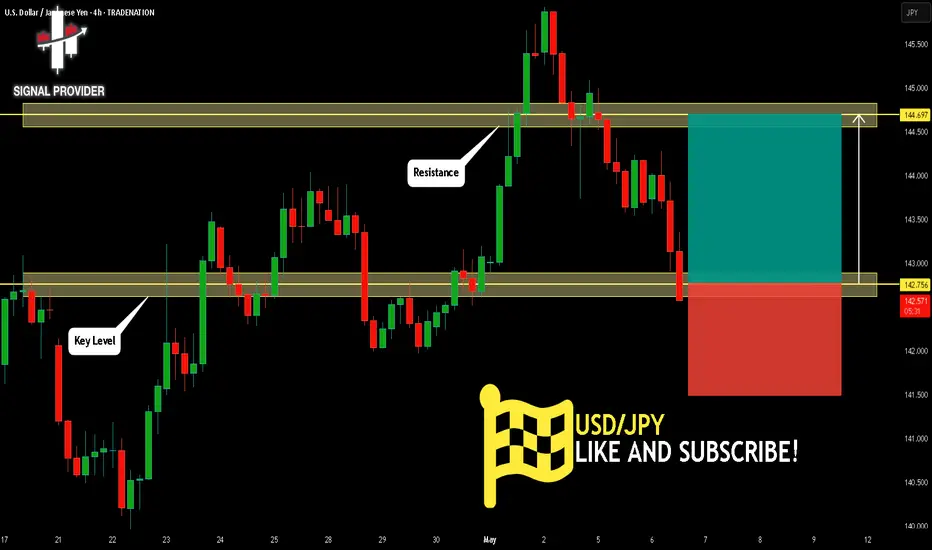
USDJPY Will Move Higher! Buy!
Please, check our technical outlook for USDJPY.
Time Frame: 4h
Current Trend: Bullish
Sentiment: Oversold (based on 7-period RSI)
Forecast: Bullish
The market is approaching a key horizontal level 142.756.
Considering the today's price action, probabilities will be high to see a movement to 144.697.
P.S
We determine oversold/overbought condition with RSI indicator.
When it drops below 30 - the market is considered to be oversold.
When it bounces above 70 - the market is considered to be overbought.
Disclosure: I am part of Trade Nation's Influencer program and receive a monthly fee for using their TradingView charts in my analysis.
Like and subscribe and comment my ideas if you enjoy them!
USD/JPY Trendline Resistance - 145.00 SupportUSD/JPY has been tricky this year as the pair has brewed several bear traps and there's even been some bull traps along the way. Trading breakouts in a market like that can be even more frustrating than usual, as a case in point the 140.00 test from a few weeks ago was a brutal false breakout that then led to a 500+ pip reversal.
Last week's Bank of Japan meeting was followed by this week's FOMC meeting and the net result of the two was a stronger USD/JPY, and for the second consecutive week the pair found resistance on the underside of a trendline projection.
But perhaps more notably, the same 145.00 level that bulls could not hold above a week ago showed up as support into the end of this week. I wouldn't want to call the weekly bar as a purely bullish item, however, as it has more of a spinning top/indecisive type of nature. But - given that it closed green for a third week in a row and held above 145, we have to give bulls some credit here, and the door would remain open for a deeper run towards the 146.75 prior swing low. - js
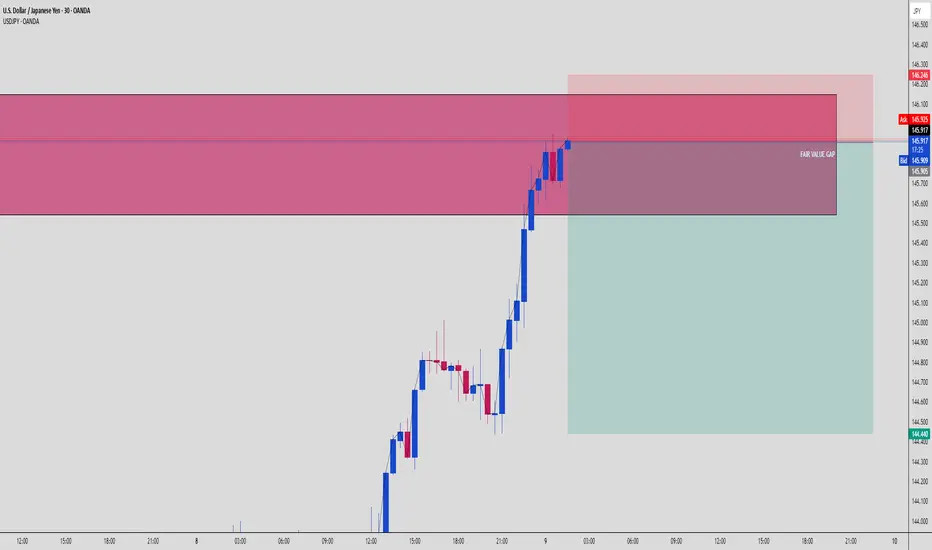
USDJPY Smart Money Short Setup | 30m OB + FVG Reaction🧠 USDJPY 30m SMC Setup | May 9, 2025
We’ve got a high-probability short brewing as price taps the premium zone and aligns with multiple Smart Money Concepts. A clear Fair Value Gap (FVG) is sitting inside a bearish Order Block, with price aggressively wicking into it — right where institutions unload.
🔍 KEY CONFLUENCES:
🧱 Bearish Order Block rejection in premium
⚡ Fair Value Gap filled at 145.910
💰 Risk-to-Reward ~1:4+, targeting discounted zone
🧲 Liquidity sweep + FVG fill = SM distribution trigger
⏳ Entry timing aligned with NY session reaction
📊 Setup Specs:
Pair: USDJPY
Timeframe: 30 min
Entry: 145.910 (after FVG fill)
SL: ~146.246
TP: ~144.440
RR: Approx. 1:4.5
💡 Smart Money Logic:
Price filled a clean imbalance zone, ran liquidity from earlier highs, and instantly showed distribution behavior. If momentum confirms with a bearish break, this becomes a high-conviction short.
📈 Chart Ninja Note:
“FVG + OB is where the banks sell while the crowd buys… don’t be the crowd.”