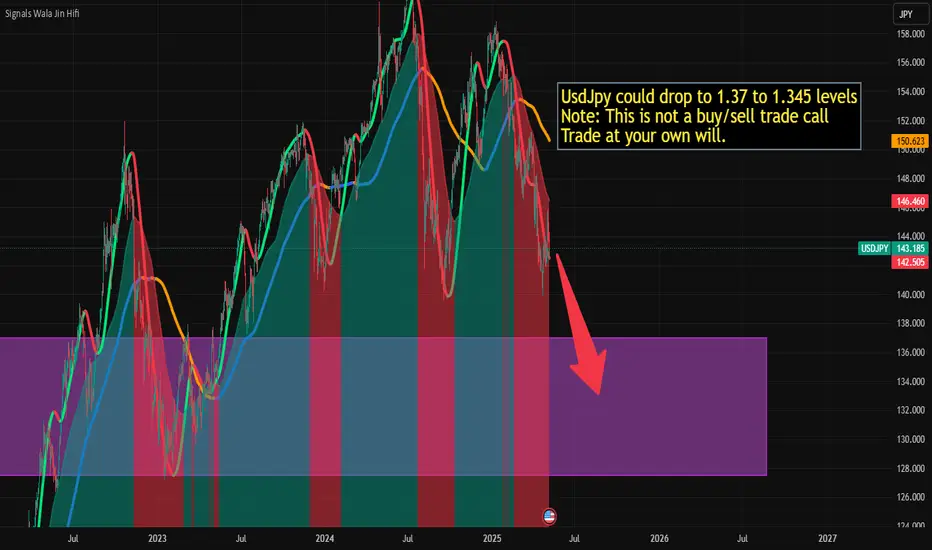
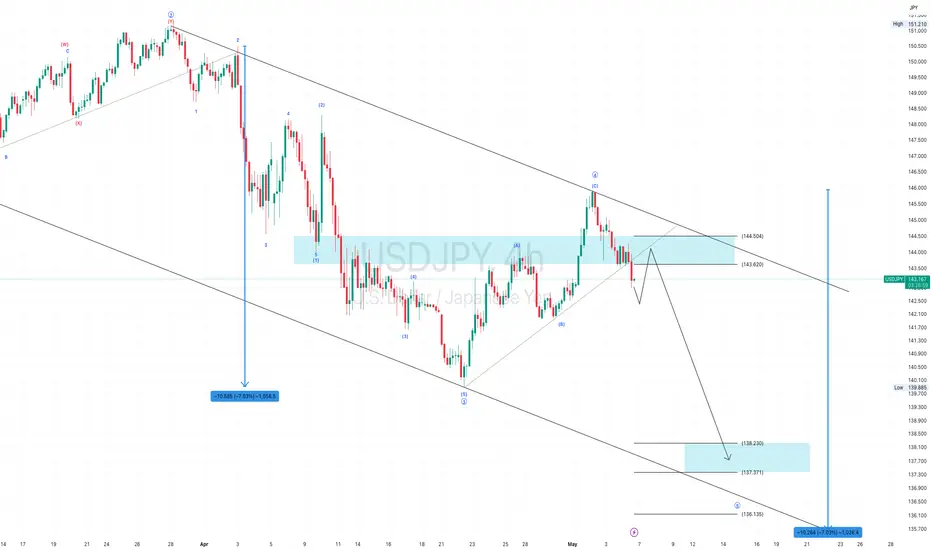
UsdJpy could drop to 1.37 to 1.345UsdJpy could drop to 1.37 to 1.345 levels
Note: This is not a buy/sell trade call
Trade at your own will.
USDJPY
USDJPY H4 | Bearish Reversal Based on the H4 chart, the price is approaching our sell entry level at 143.63, a pullback resistance.
Our take profit is set at 141.81, an overlap support.
The stop loss is set at 145.49, an overlap resistance.
High Risk Investment Warning
Trading Forex/CFDs on margin carries a high level of risk and may not be suitable for all investors. Leverage can work against you.
Stratos Markets Limited (tradu.com):
CFDs are complex instruments and come with a high risk of losing money rapidly due to leverage. 63% of retail investor accounts lose money when trading CFDs with this provider. You should consider whether you understand how CFDs work and whether you can afford to take the high risk of losing your money.
Stratos Europe Ltd (tradu.com):
CFDs are complex instruments and come with a high risk of losing money rapidly due to leverage. 63% of retail investor accounts lose money when trading CFDs with this provider. You should consider whether you understand how CFDs work and whether you can afford to take the high risk of losing your money.
Stratos Global LLC (tradu.com):
Losses can exceed deposits.
Please be advised that the information presented on TradingView is provided to Tradu (‘Company’, ‘we’) by a third-party provider (‘TFA Global Pte Ltd’). Please be reminded that you are solely responsible for the trading decisions on your account. There is a very high degree of risk involved in trading. Any information and/or content is intended entirely for research, educational and informational purposes only and does not constitute investment or consultation advice or investment strategy. The information is not tailored to the investment needs of any specific person and therefore does not involve a consideration of any of the investment objectives, financial situation or needs of any viewer that may receive it. Kindly also note that past performance is not a reliable indicator of future results. Actual results may differ materially from those anticipated in forward-looking or past performance statements. We assume no liability as to the accuracy or completeness of any of the information and/or content provided herein and the Company cannot be held responsible for any omission, mistake nor for any loss or damage including without limitation to any loss of profit which may arise from reliance on any information supplied by TFA Global Pte Ltd.
The speaker(s) is neither an employee, agent nor representative of Tradu and is therefore acting independently. The opinions given are their own, constitute general market commentary, and do not constitute the opinion or advice of Tradu or any form of personal or investment advice. Tradu neither endorses nor guarantees offerings of third-party speakers, nor is Tradu responsible for the content, veracity or opinions of third-party speakers, presenters or participants.

Japanese Yen Pairs: A Short Guide on Relative StrengthIndicators are a popular choice among many traders, and they certainly have their place in my own toolkit. But sometimes it is best to simply look the price to gauge strength. And doing so, it can help us scenario plan for future events. After I take a quick look at Japanese yen pairs, I wrap up on my preferred setup.
Matt Simpson, Market Analyst at Forex.com and City Index

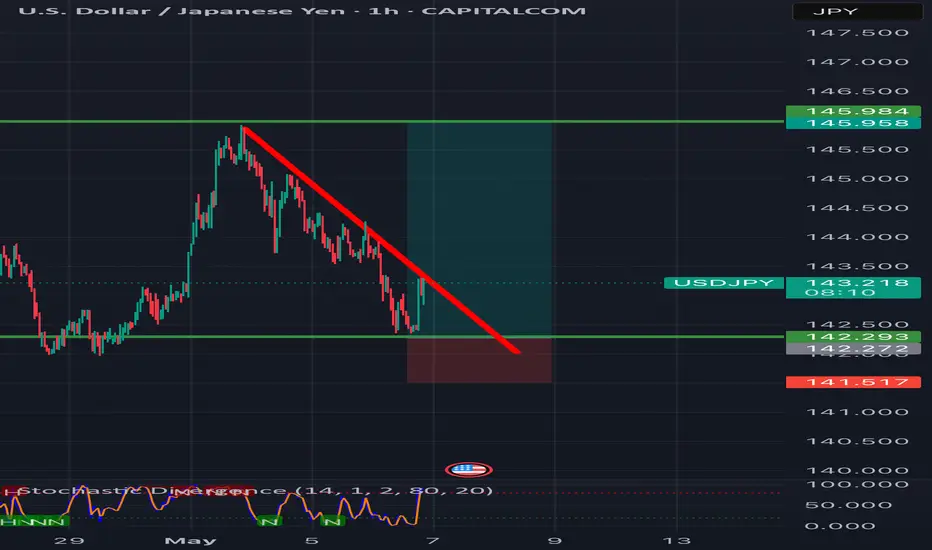
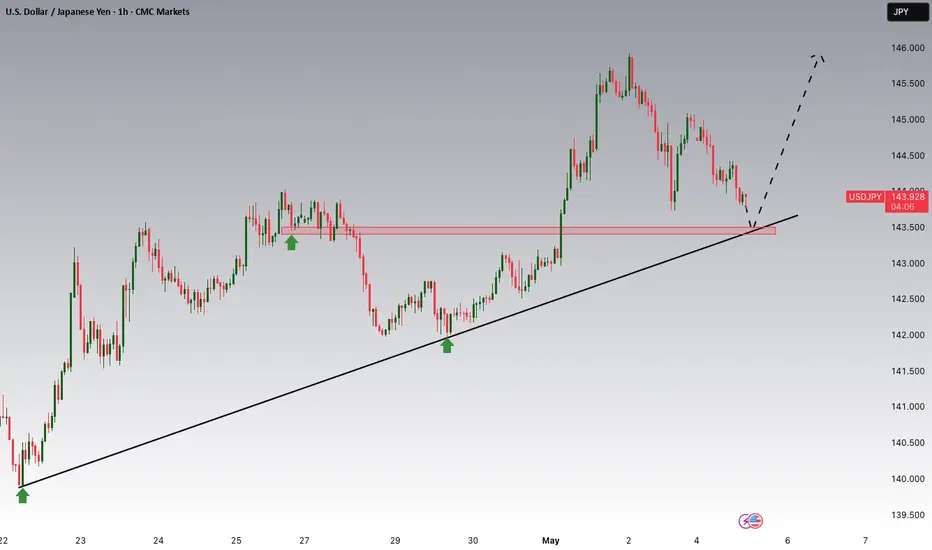
USDJPY Technical Analysis – GTE VIP Buy SetupUSDJPY Technical Analysis – GTE VIP Buy Setup
Price tapped into key support around 142.29 and rejected strongly with a bullish engulfing on the 1H chart. This level has held as strong demand multiple times.
We entered a buy expecting price to break through the descending trendline, with confluence from stochastic oversold and bullish divergence building.
If momentum holds, we anticipate a breakout to 145.43 and beyond as clean traffic lies above.
Classic reversal play — support bounce + trendline breakout in progress.
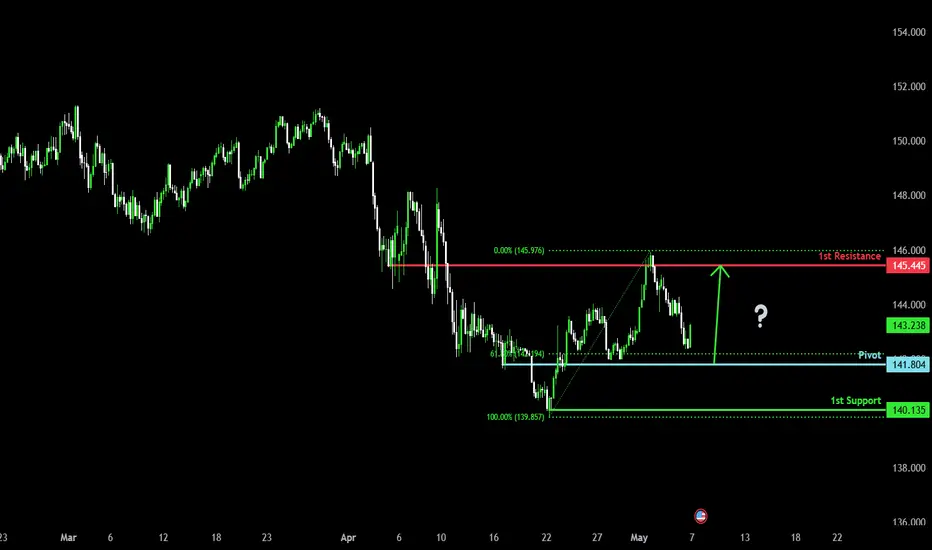
Bullish bounce?USD/JPY is falling towards the pivot which acts as a pullback support and could bounce to the 1st resistance which is a pullback resistance.
Pivot: 141.80
1st Support: 140.13
1st Resistance: 145.44
Risk Warning:
Trading Forex and CFDs carries a high level of risk to your capital and you should only trade with money you can afford to lose. Trading Forex and CFDs may not be suitable for all investors, so please ensure that you fully understand the risks involved and seek independent advice if necessary.
Disclaimer:
The above opinions given constitute general market commentary, and do not constitute the opinion or advice of IC Markets or any form of personal or investment advice.
Any opinions, news, research, analyses, prices, other information, or links to third-party sites contained on this website are provided on an "as-is" basis, are intended only to be informative, is not an advice nor a recommendation, nor research, or a record of our trading prices, or an offer of, or solicitation for a transaction in any financial instrument and thus should not be treated as such. The information provided does not involve any specific investment objectives, financial situation and needs of any specific person who may receive it. Please be aware, that past performance is not a reliable indicator of future performance and/or results. Past Performance or Forward-looking scenarios based upon the reasonable beliefs of the third-party provider are not a guarantee of future performance. Actual results may differ materially from those anticipated in forward-looking or past performance statements. IC Markets makes no representation or warranty and assumes no liability as to the accuracy or completeness of the information provided, nor any loss arising from any investment based on a recommendation, forecast or any information supplied by any third-party.
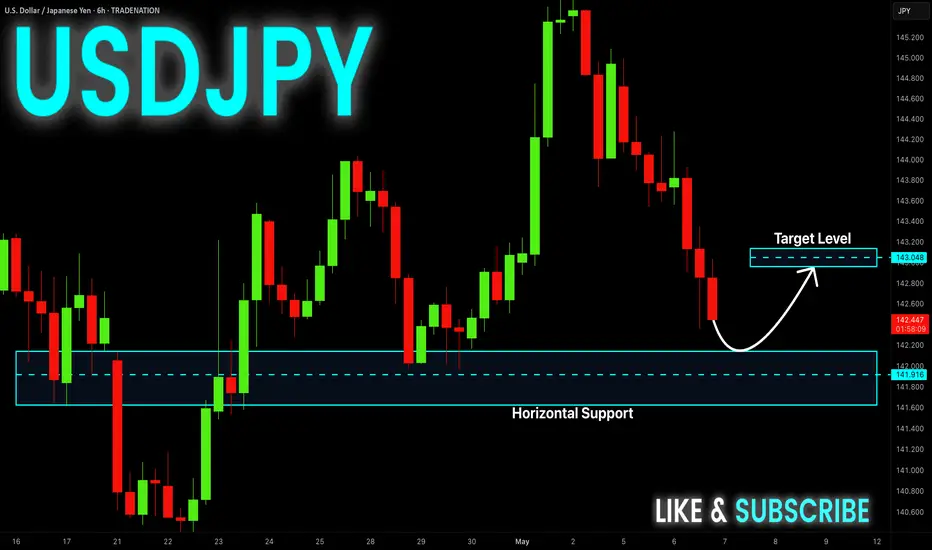
USD-JPY Local Long! Buy!
Hello,Traders!
USD-JPY has fallen down
Sharply and the pair is
Locally oversold so after
It hits the horizontal support
Of 141.800 a local bullish
Correction is to be expected
Buy!
Comment and subscribe to help us grow!
Check out other forecasts below too!
Disclosure: I am part of Trade Nation's Influencer program and receive a monthly fee for using their TradingView charts in my analysis.
Analysis of the Latest SignalsRecently, the situation in Ukraine and Russia has remained tense, and the conflict in the Middle East has escalated (such as the confrontation between Israel and the Houthi armed forces in Yemen), prompting funds to flow to traditional safe - haven currencies. However, the Bank of Japan (BoJ) maintained a dovish stance last week and did not clarify the interest - rate - hike path, which limited the upside potential of the yen.
Although inflation in Japan persists and wage growth is strong (the largest increase in 34 years), the BoJ's cautious attitude towards economic recovery has led the market to lower the interest - rate - hike expectations for June and July, putting pressure on the yen.
you are currently struggling with losses, or are unsure which of the numerous trading strategies to follow, at this moment, you can choose to observe the operations within our channel.

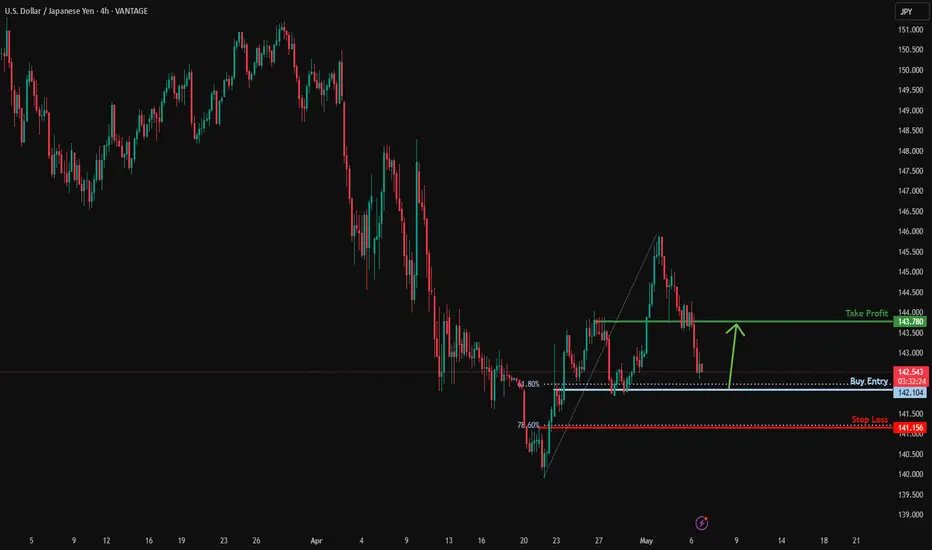
Bullish bounce?USD/JPY is falling towards the support level which is a pullback support that line sup with the 61.8% Fibonacci retracement and could bounce from this level to our take profit.
Entry: 142.10
Why we like it:
There is a pullback support level that lines up with the 61.8% Fibonacci retracement.
Stop loss: 141.15
Why we like it:
There is a pullback support level that aligns with the 78.6% Fibonacci retracement.
Take profit: 143.78
Why we like it:
There is a pullback support level that lines up with the 78.6% Fibonacci retracement.
Enjoying your TradingView experience? Review us!
Please be advised that the information presented on TradingView is provided to Vantage (‘Vantage Global Limited’, ‘we’) by a third-party provider (‘Everest Fortune Group’). Please be reminded that you are solely responsible for the trading decisions on your account. There is a very high degree of risk involved in trading. Any information and/or content is intended entirely for research, educational and informational purposes only and does not constitute investment or consultation advice or investment strategy. The information is not tailored to the investment needs of any specific person and therefore does not involve a consideration of any of the investment objectives, financial situation or needs of any viewer that may receive it. Kindly also note that past performance is not a reliable indicator of future results. Actual results may differ materially from those anticipated in forward-looking or past performance statements. We assume no liability as to the accuracy or completeness of any of the information and/or content provided herein and the Company cannot be held responsible for any omission, mistake nor for any loss or damage including without limitation to any loss of profit which may arise from reliance on any information supplied by Everest Fortune Group.
XAUUSD (GOLD) | 4H | SWING TRADING Good morning, my friends,
Gold is currently at the 3355.0 level.
Even if gold makes a correction at this point, my target remains 3461.0.
This is a swing trading model, so there may be delays in reaching my target. However, I am confident that I will reach it eventually.
Once we hit that level, I will share an update for you all.
Dear friends, your likes are always my biggest motivation to keep sharing analyses. That’s why I kindly ask each of my followers to show their support—please don’t hold back on the likes.
I sincerely thank everyone who supports me with their likes. It truly means a lot

USDJPY Retest of Supply Zone Before Bearish ContinuationUSDJPY pair is reacting to key supply around 143.70–144.00 but shows signs of weakness after failing to hold above this level. With renewed risk-off sentiment and escalating global trade tensions—especially involving Japan and the U.S.—this pair may be setting up for a bearish continuation. Here's what both the chart and macro backdrop suggest.
📊 Technical Breakdown (4H Chart)
Key Supply Zone Retested:
The pair retraced into a previously broken structure zone (blue box), rejecting the 143.70–144.00 area multiple times.
Price is now forming lower highs, indicating bearish pressure building beneath resistance.
Bearish Continuation Pattern:
Price action resembles a bear flag, with a minor pullback likely before continuation lower.
A retest of 143.00–143.50 could serve as an ideal sell zone.
Major Support Levels:
142.04–142.02: Immediate support, already tested.
140.16: Key structure low from late April.
138.04: Final measured move target based on Fibonacci extension and prior demand zone.
Bearish Trade Setup:
Entry Zone: 143.00–143.50
Stop: Above 145.35
TP1: 142.00
TP2: 140.15
TP3: 138.00
🌐 Macro Fundamentals
Trump Tariffs Stir Instability:
President Trump is pressing Japan in trade talks with threats of new tariffs, already impacting investor confidence
A 25% tariff on Japanese auto exports has gone into effect, disrupting trade negotiations.
Urgency for a Deal, But No Progress Yet:
Trump says multiple deals are “coming,” but little substance has emerged. Analysts fear economic fallout and potential global recession if tensions continue
JPY Strengthening on Safe-Haven Flows:
With U.S. economic indicators weakening and global uncertainty rising, the yen may benefit from risk aversion.
✅ Summary
USDJPY remains vulnerable to downside continuation from the 143–144 resistance zone. If price breaks below 142.00 again with conviction, expect momentum to build toward 140.15 and potentially 138.00.

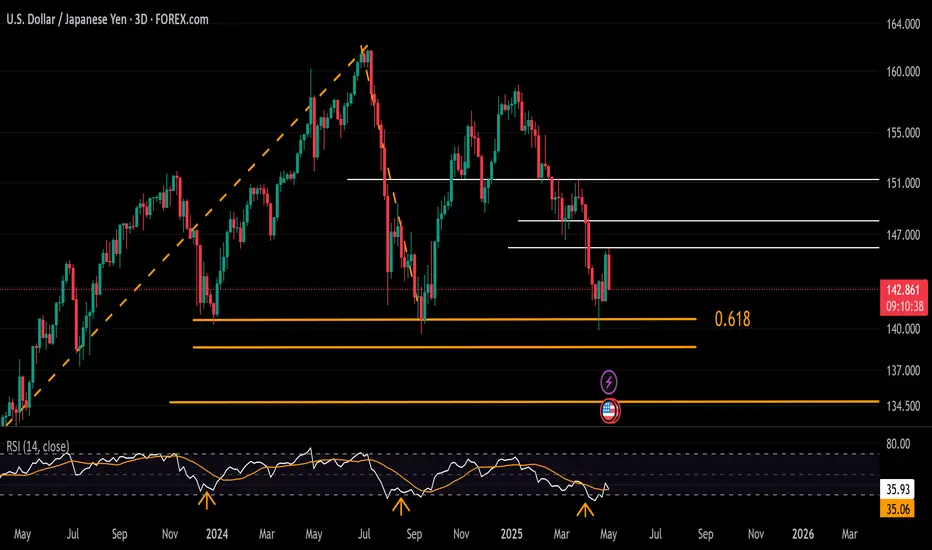
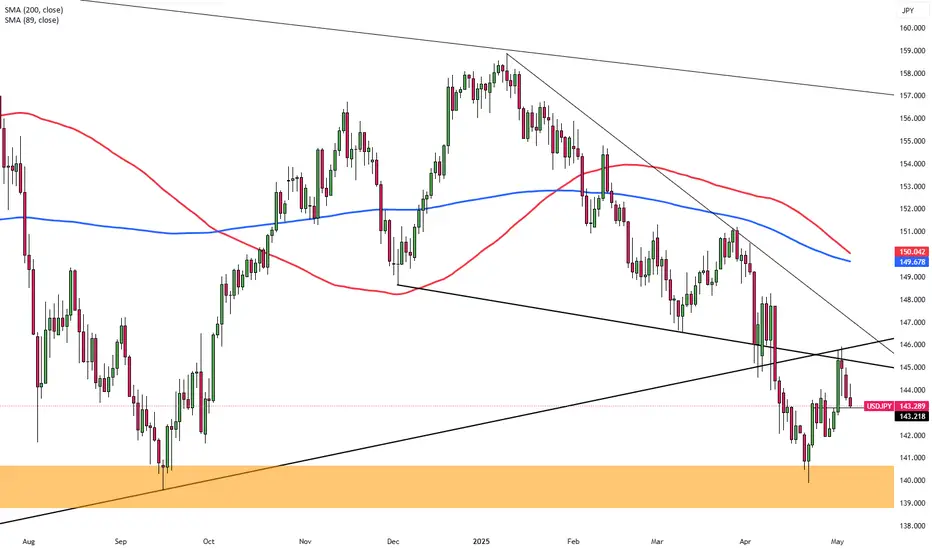
USDJPY Forecast: Haven Appetite Back in SightUSDJPY remains above the 0.618 Fibonacci retracement zone at 139, stemming from the uptrend between January 2023 (127.20) and July 2024 (162.00).
However, the pair is currently trading below resistance at 146, steering the trend back toward key support levels at 142 and 139.
A decisive break below 139 could expose new 2025 lows near 138.30 and 134.60, both key Fibonacci levels.
On the upside, a rebound above 146 may open the way to 149 and 151, testing the grounds for a more sustainable uptrend.
Written by Razan Hilal, CMT
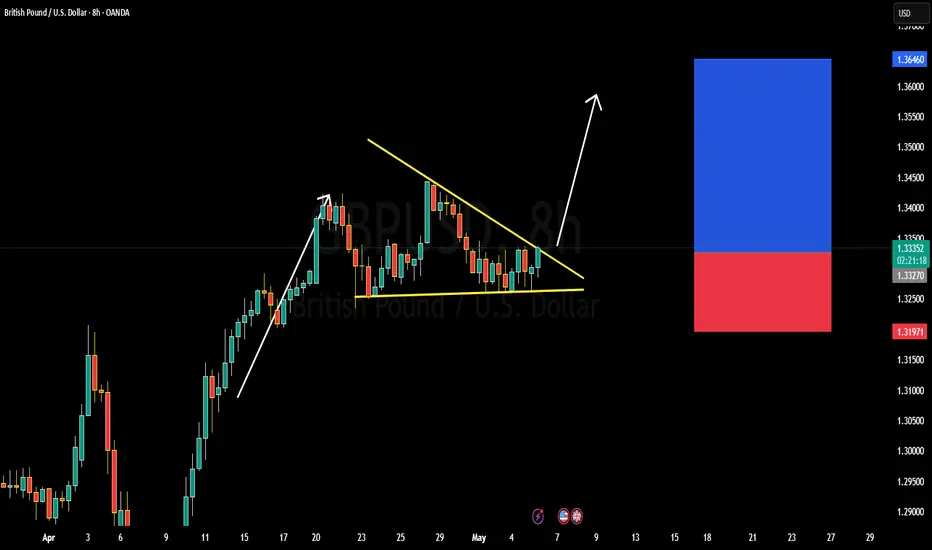
GBPUSD BULLISH OR BEARISH DETAILED ANALYSISGBPUSD is currently trading around 1.33400 and is displaying a promising bullish setup. The price action is coiling within a symmetrical triangle, which typically signals a potential breakout. A clear bullish structure has already formed following the recent impulse wave, and with the consolidation tightening, we are now closely watching for a breakout to the upside. The expected bullish breakout aligns with the projected target of 1.36000, offering a strong risk-reward opportunity for trend-following traders.
From a fundamental standpoint, the British pound is showing resilience despite broader dollar strength. Recent comments from the Bank of England have maintained a cautious yet firm tone regarding inflation control, hinting at the potential for rates to stay elevated longer than markets previously priced in. Meanwhile, the U.S. dollar index has seen some pressure amid mixed economic data and increasing speculation that the Federal Reserve may hold rates steady in the upcoming sessions.
Technically, GBPUSD remains well-supported above the 1.32500 level, with buyers defending key horizontal and trendline support areas. The recent compression in price suggests that volatility is about to expand, typically favoring the direction of the initial trend, which in this case remains bullish. Momentum indicators are beginning to curl higher, further supporting a breakout scenario.
In summary, GBPUSD is setting up for a high-probability bullish continuation. A confirmed breakout from the triangle could ignite a fresh rally toward 1.36000, especially if supported by dovish Fed rhetoric and firm UK economic sentiment. This setup is one to watch closely as it aligns both technically and fundamentally, positioning it as a favorable opportunity for medium-term swing trades.
USDJPY 05/06/2025Scenario USDJPY TF H4
- Stick to your stop loss to protect your trades
- Manage your positions patiently until you hit the target
- Profit always in risk, take the risk or lose the chance
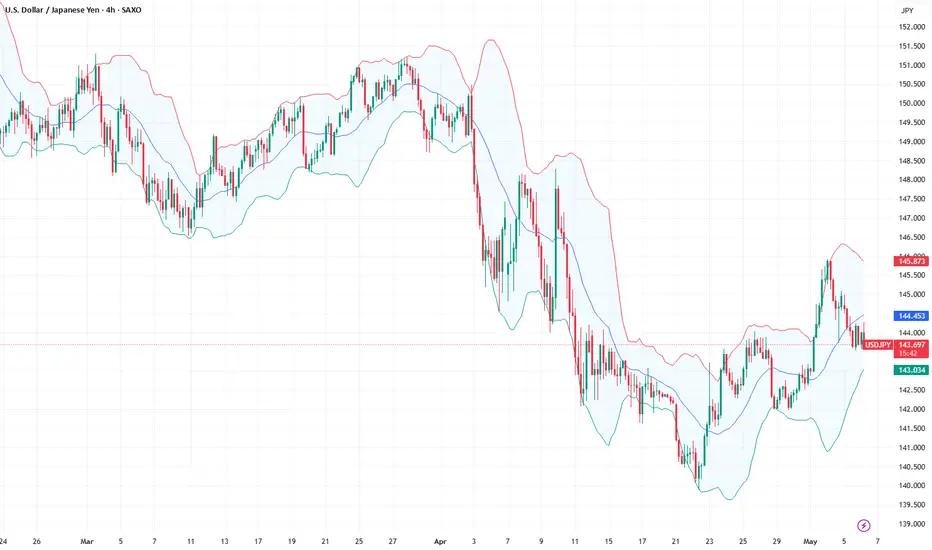
Yen Slips Toward 144 on Stronger DollarThe Japanese yen edged lower toward 144 per dollar on Tuesday, as the U.S. dollar strengthened amid optimism over potential U.S.-China trade talks and investor caution ahead of the Federal Reserve’s policy decision. President Trump suggested a possible reduction in tariffs on Chinese goods. Meanwhile, the Bank of Japan held rates steady but revised its growth and inflation outlook. Trading activity remained subdued due to a public holiday in Japan.
Resistance is located at 145.90, followed by 146.75 and 149.80. On the downside, support levels are at 139.70, then 137.00 and 135.00.
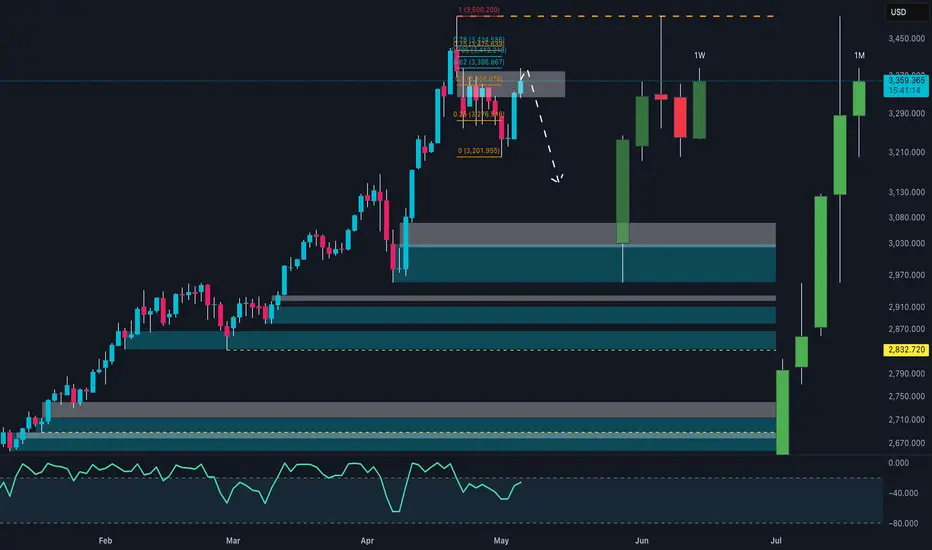
GOLD - Smart Money Selling, Retail Chasing Longs📉 Technical Context:
Price has reacted precisely to the 0.618–0.786 Fibonacci retracement zone between 3,386–3,442 USD, aligning with a clear weekly supply zone and imbalance. The current market structure suggests a potential lower high, with the first target around 3,060 USD, and the second near 2,880–2,900 USD demand.
🧠 COT Report (as of April 29, 2025):
Non-Commercials (speculators) cut 18,519 long contracts, signaling waning bullish conviction.
Commercials (hedgers) increased shorts by +9,848 contracts, maintaining a bearish contrarian stance.
📊 Retail Sentiment (MyFxBook):
65% of retail traders are short from 3,062, while 35% are long from 3,184 — ideal environment for a bull trap before reversal.
📅 Seasonality (Market Bulls):
May is historically weak:
10Y: -9.98%
5Y: -12.21%
Strength historically returns in June/July → a correction before continuation is likely.
✅ Conclusion:
Technical structure, macro context, and positioning all align for a high-probability short.
📍 Entry Zone: 3,420–3,440
🔒 Stop: Above ATH (3,500)
🎯 Targets:
TP1: 3,060
TP2: 2,900
Fundamental Market Analysis for May 6, 2025 USDJPYUSDJPY:
The Japanese Yen (JPY) declined against its US counterpart during Tuesday's Asian session, albeit without any follow-through selling. Despite the Bank of Japan's (BoJ) ‘restrained’ guidance last Thursday, Japan's rising inflation and prospects for continued wage increases leave the door open for further policy tightening by the central bank. In addition, uncertainty over US President Donald Trump's trade policy and rising geopolitical tensions continue to act as tailwinds for the safe-haven yen.
Meanwhile, the prospect of more aggressive rate cuts by the Federal Reserve (Fed) is not helping the US Dollar (USD) attract meaningful buyers and is helping to limit the upside for the USD/JPY pair. Traders also seem unwilling to wait for more signals on the Fed's policy outlook before positioning for the next leg of directional movement. Thus, the main focus will be on the outcome of the two-day FOMC meeting, which starts this Tuesday and which will give the dollar a fresh impetus.
Trading recommendation: BUY 143.90, SL 143.60, TP144.80
Bullish Breakout from Falling WedgeThe exchange rate of the US dollar against the Japanese yen shows a slight downward trend. The opening rate of the US dollar against the Japanese yen on that day was 144.8740. During the trading session, it hit a high of 144.9890 and a low of 144.085. The latest trading price is 144.082, which is 0.60% lower than the closing price of 144.9180 in the New York foreign exchange market on the previous trading day.
Buffett has warned of the risks of the US dollar, and funds may flow to safe - haven assets such as the Japanese yen, which may have had a certain impact on the exchange rate of the US dollar against the Japanese yen. On the other hand, from a technical perspective, according to the chart data, the "Daily Chart PP" of the US dollar / Japanese yen shows that its pivot point is at 158.27, and the maximum coverage range of the corresponding support and resistance is 157.29 - 159.33. The current exchange rate is at a relatively low level and may be attracted by the lower support level.
you are currently struggling with losses, or are unsure which of the numerous trading strategies to follow, at this moment, you can choose to observe the operations within our channel.

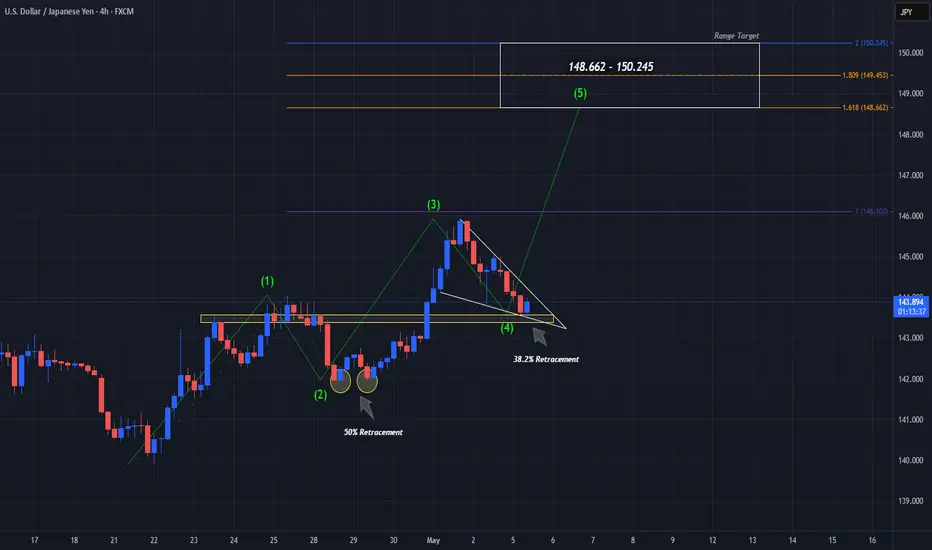
UJ Impulse Wave 5 IncomingFX:USDJPY seems to have finished Wave 4 being a Correction Wave of the Elliot Wave Theory and looks to be prepping for the start of Wave 5 being an Impulse Wave!
Now Price has not only made a 38.2% Retracement to 143.6 of the 145.941 Swing High that ended Wave 3 but is testing Break of Previous Structure being Past Resistance attempting to turn it into Support if enough Buyers enter the market in this opportune area.
Price Action during the Correction of Wave 4 has formed a Falling Wedge Pattern, typically seen as a Continuation Pattern. For this to be fact, we will need to see a Bullish Breakout to the Falling Resistance followed by a successful Retest of the Break where the Long Opportunities should present themselves.
Once Wave 5 is confirmed, we can expect Price to work from here and potential reach the Potential Range Target of ( 148.662 - 150.245 )
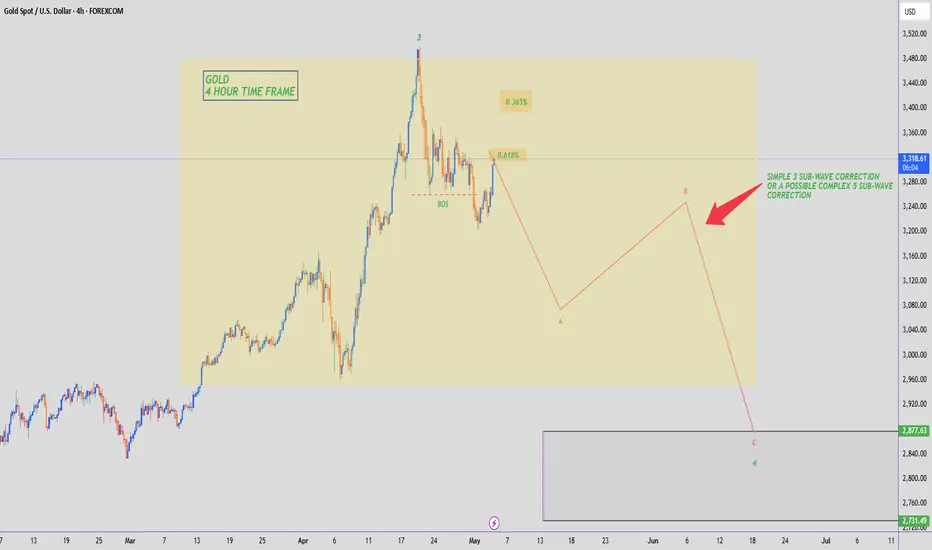
GOLD - WAVE 4 CORRECTION TO $2,800 (UPDATE)Gold starting the week with some bullish momentum. We've seen a 'BOS' to the downside, which is now being followed by a retest of a supply zone. This zone can either be around $3,317 (0.618% Fib) or higher around $3,400 zone (0.365% Fib).
Don't forget we're in a 'Wave 4 Correction' of the Elliott Wave Theory strategy. Wave 4 always has choppy price action to trap in late buyers & early sellers.
USDJPY Potential UpsidesHey Traders, in today's trading session we are monitoring USDJPY for a buying opportunity around 143.500 zone, USDJPY is trading in an uptrend and currently is in a correction phase in which it is approaching the trend at 143.500 support and resistance area.
Trade safe, Joe.
USDJPY and GBPJPY Analysis todayHello traders, this is a complete multiple timeframe analysis of this pair. We see could find significant trading opportunities as per analysis upon price action confirmation we may take this trade. Smash the like button if you find value in this analysis and drop a comment if you have any questions or let me know which pair to cover in my next analysis.

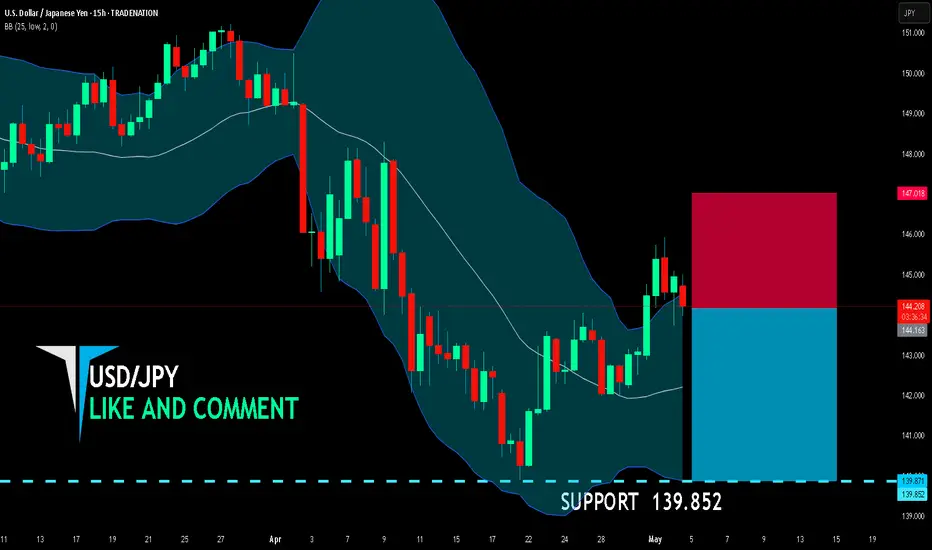
USD/JPY BEARS ARE GAINING STRENGTH|SHORT
USD/JPY SIGNAL
Trade Direction: short
Entry Level: 144.163
Target Level: 139.852
Stop Loss: 147.018
RISK PROFILE
Risk level: medium
Suggested risk: 1%
Timeframe: 15h
Disclosure: I am part of Trade Nation's Influencer program and receive a monthly fee for using their TradingView charts in my analysis.
✅LIKE AND COMMENT MY IDEAS✅
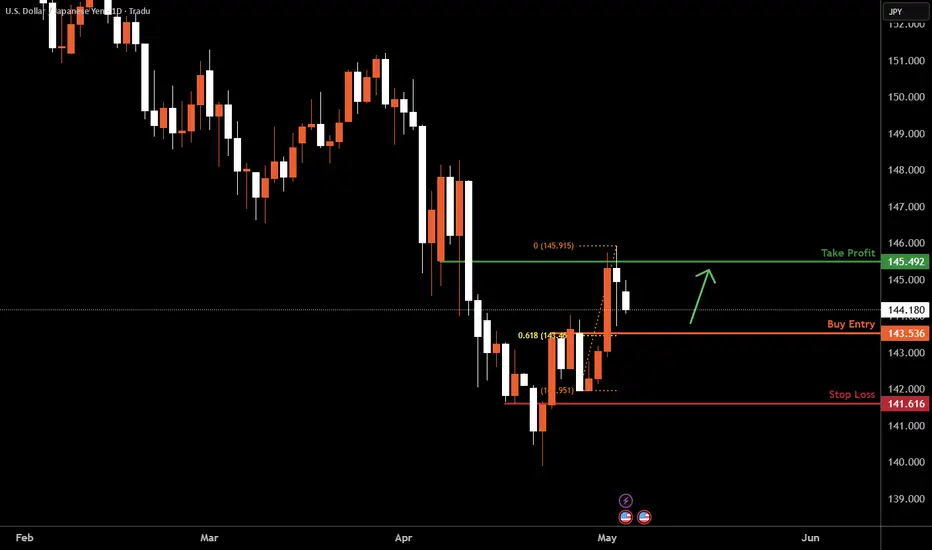
USDJPY D1 | Bullish Bounce Off 61.8%Based on the D1 chart analysis, the price is falling toward our buy entry level at 143.53, a pullback support that aligns with the 61.8 Fibonacci retracement.
Our take profit is set at 145.49, an overlap resistance.
The stop loss is placed at 141.61,a pullback support.
High Risk Investment Warning
Trading Forex/CFDs on margin carries a high level of risk and may not be suitable for all investors. Leverage can work against you.
Stratos Markets Limited (tradu.com):
CFDs are complex instruments and come with a high risk of losing money rapidly due to leverage. 63% of retail investor accounts lose money when trading CFDs with this provider. You should consider whether you understand how CFDs work and whether you can afford to take the high risk of losing your money.
Stratos Europe Ltd (tradu.com):
CFDs are complex instruments and come with a high risk of losing money rapidly due to leverage. 63% of retail investor accounts lose money when trading CFDs with this provider. You should consider whether you understand how CFDs work and whether you can afford to take the high risk of losing your money.
Stratos Global LLC (tradu.com):
Losses can exceed deposits.
Please be advised that the information presented on TradingView is provided to Tradu (‘Company’, ‘we’) by a third-party provider (‘TFA Global Pte Ltd’). Please be reminded that you are solely responsible for the trading decisions on your account. There is a very high degree of risk involved in trading. Any information and/or content is intended entirely for research, educational and informational purposes only and does not constitute investment or consultation advice or investment strategy. The information is not tailored to the investment needs of any specific person and therefore does not involve a consideration of any of the investment objectives, financial situation or needs of any viewer that may receive it. Kindly also note that past performance is not a reliable indicator of future results. Actual results may differ materially from those anticipated in forward-looking or past performance statements. We assume no liability as to the accuracy or completeness of any of the information and/or content provided herein and the Company cannot be held responsible for any omission, mistake nor for any loss or damage including without limitation to any loss of profit which may arise from reliance on any information supplied by TFA Global Pte Ltd.
The speaker(s) is neither an employee, agent nor representative of Tradu and is therefore acting independently. The opinions given are their own, constitute general market commentary, and do not constitute the opinion or advice of Tradu or any form of personal or investment advice. Tradu neither endorses nor guarantees offerings of third-party speakers, nor is Tradu responsible for the content, veracity or opinions of third-party speakers, presenters or participants.