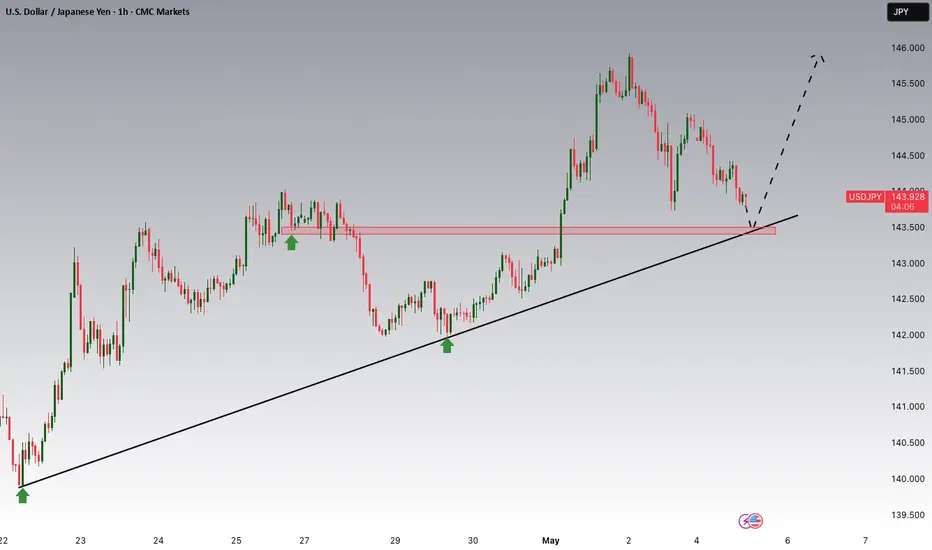
USDJPY Potential UpsidesHey Traders, in today's trading session we are monitoring USDJPY for a buying opportunity around 143.500 zone, USDJPY is trading in an uptrend and currently is in a correction phase in which it is approaching the trend at 143.500 support and resistance area.
Trade safe, Joe.
USDJPY
USDJPY and GBPJPY Analysis todayHello traders, this is a complete multiple timeframe analysis of this pair. We see could find significant trading opportunities as per analysis upon price action confirmation we may take this trade. Smash the like button if you find value in this analysis and drop a comment if you have any questions or let me know which pair to cover in my next analysis.

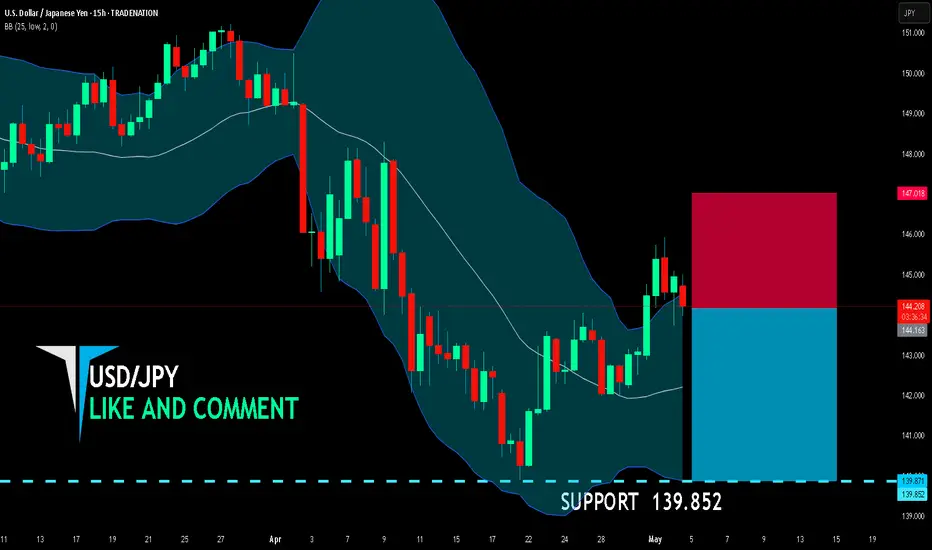
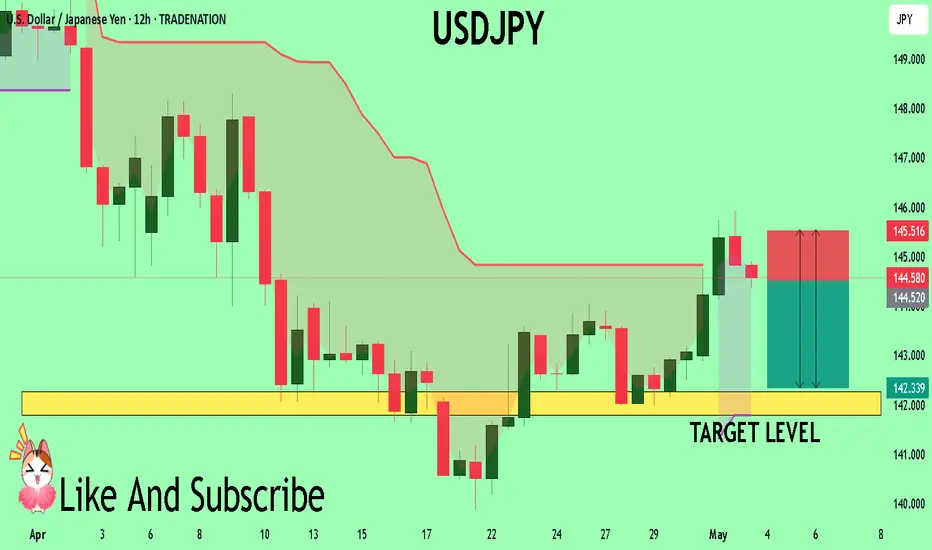
USD/JPY BEARS ARE GAINING STRENGTH|SHORT
USD/JPY SIGNAL
Trade Direction: short
Entry Level: 144.163
Target Level: 139.852
Stop Loss: 147.018
RISK PROFILE
Risk level: medium
Suggested risk: 1%
Timeframe: 15h
Disclosure: I am part of Trade Nation's Influencer program and receive a monthly fee for using their TradingView charts in my analysis.
✅LIKE AND COMMENT MY IDEAS✅
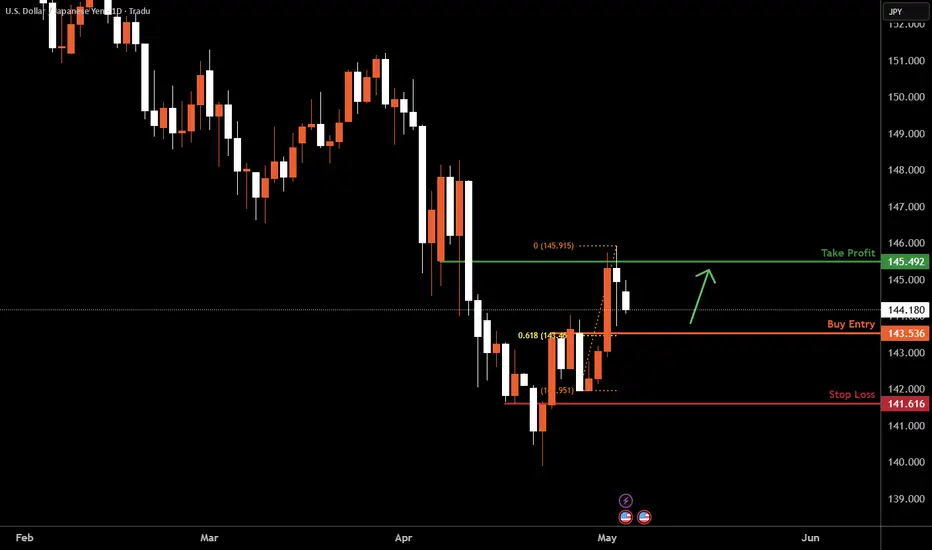
USDJPY D1 | Bullish Bounce Off 61.8%Based on the D1 chart analysis, the price is falling toward our buy entry level at 143.53, a pullback support that aligns with the 61.8 Fibonacci retracement.
Our take profit is set at 145.49, an overlap resistance.
The stop loss is placed at 141.61,a pullback support.
High Risk Investment Warning
Trading Forex/CFDs on margin carries a high level of risk and may not be suitable for all investors. Leverage can work against you.
Stratos Markets Limited (tradu.com):
CFDs are complex instruments and come with a high risk of losing money rapidly due to leverage. 63% of retail investor accounts lose money when trading CFDs with this provider. You should consider whether you understand how CFDs work and whether you can afford to take the high risk of losing your money.
Stratos Europe Ltd (tradu.com):
CFDs are complex instruments and come with a high risk of losing money rapidly due to leverage. 63% of retail investor accounts lose money when trading CFDs with this provider. You should consider whether you understand how CFDs work and whether you can afford to take the high risk of losing your money.
Stratos Global LLC (tradu.com):
Losses can exceed deposits.
Please be advised that the information presented on TradingView is provided to Tradu (‘Company’, ‘we’) by a third-party provider (‘TFA Global Pte Ltd’). Please be reminded that you are solely responsible for the trading decisions on your account. There is a very high degree of risk involved in trading. Any information and/or content is intended entirely for research, educational and informational purposes only and does not constitute investment or consultation advice or investment strategy. The information is not tailored to the investment needs of any specific person and therefore does not involve a consideration of any of the investment objectives, financial situation or needs of any viewer that may receive it. Kindly also note that past performance is not a reliable indicator of future results. Actual results may differ materially from those anticipated in forward-looking or past performance statements. We assume no liability as to the accuracy or completeness of any of the information and/or content provided herein and the Company cannot be held responsible for any omission, mistake nor for any loss or damage including without limitation to any loss of profit which may arise from reliance on any information supplied by TFA Global Pte Ltd.
The speaker(s) is neither an employee, agent nor representative of Tradu and is therefore acting independently. The opinions given are their own, constitute general market commentary, and do not constitute the opinion or advice of Tradu or any form of personal or investment advice. Tradu neither endorses nor guarantees offerings of third-party speakers, nor is Tradu responsible for the content, veracity or opinions of third-party speakers, presenters or participants.
Bearish reversal?USD/JPY is rising towards the pivot which has been identified as an overlap resistance and could reverse to the 1st support which is a pullback support.
Pivot: 146.90
1st Support: 142.06
1st Resistance: 150.92
Risk Warning:
Trading Forex and CFDs carries a high level of risk to your capital and you should only trade with money you can afford to lose. Trading Forex and CFDs may not be suitable for all investors, so please ensure that you fully understand the risks involved and seek independent advice if necessary.
Disclaimer:
The above opinions given constitute general market commentary, and do not constitute the opinion or advice of IC Markets or any form of personal or investment advice.
Any opinions, news, research, analyses, prices, other information, or links to third-party sites contained on this website are provided on an "as-is" basis, are intended only to be informative, is not an advice nor a recommendation, nor research, or a record of our trading prices, or an offer of, or solicitation for a transaction in any financial instrument and thus should not be treated as such. The information provided does not involve any specific investment objectives, financial situation and needs of any specific person who may receive it. Please be aware, that past performance is not a reliable indicator of future performance and/or results. Past Performance or Forward-looking scenarios based upon the reasonable beliefs of the third-party provider are not a guarantee of future performance. Actual results may differ materially from those anticipated in forward-looking or past performance statements. IC Markets makes no representation or warranty and assumes no liability as to the accuracy or completeness of the information provided, nor any loss arising from any investment based on a recommendation, forecast or any information supplied by any third-party.

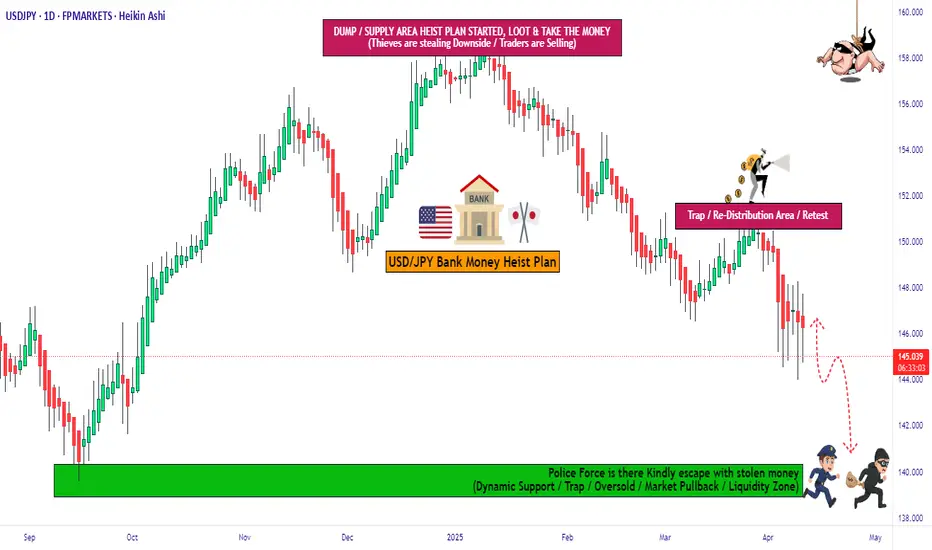
USD/JPY "The Gopher" Forex Bank Heist Plan (Swing/Day)🌟Hi! Hola! Ola! Bonjour! Hallo! Marhaba!🌟
Dear Money Makers & Robbers, 🤑💰✈️
Based on 🔥Thief Trading style technical and fundamental analysis🔥, here is our master plan to heist the USD/JPY "The Gopher" Forex Market. Please adhere to the strategy I've outlined in the chart, which emphasizes short entry. Our aim is the Green Zone. Risky level, oversold market, consolidation, trend reversal, trap at the level where traders and bullish robbers are stronger. 🏆💸"Take profit and treat yourself, traders. You deserve it!💪🏆🎉
Entry 📈 : "The vault is wide open! Swipe the Bearish loot at any price - the heist is on!
however I advise to Place sell limit orders within a 15 or 30 minute timeframe most nearest or swing, low or high level for Pullback Entries.
Stop Loss 🛑:
📌Thief SL placed at the nearest/swing High or Low level Using the 1D timeframe (148.800) Day/Scalping trade basis.
📌SL is based on your risk of the trade, lot size and how many multiple orders you have to take.
Target 🎯: 140.000 (or) Escape Before the Target
💰💵💸USD/JPY "The Gopher" Forex Market Heist Plan (Swing/Day Trade) is currently experiencing a Bearish trend.., driven by several key factors.👇👇👇
📰🗞️Get & Read the Fundamental, Macro, COT Report, Quantitative Analysis, Sentimental Outlook, Intermarket Analysis, Future trend targets... go ahead to check 👉👉👉🔗🔗
Detailed Explanation Recap ✨
Fundamentals: Policy divergence + trade risks ⚖️ favor JPY 💪.
Macro: US slowdown 📉 + Japan resilience 🌱 lift JPY.
Global Markets: Risk-off flows 🛡️ + yield dynamics 📜 boost JPY.
COT: Speculative unwinding 📉 aligns with bearish pressure.
Seasonality: Mild JPY edge in April 🌸.
Intermarket: USD weakness 💸 across assets aids JPY.
Quantitative: Technicals confirm bearish 📉.
Sentiment: Broad bearish tilt 😟, retail as contrarian 🚨.
Trend Prediction: Downward bias 📉 across timeframes.
Outlook: Strong bearish case 🐻 with clear targets.
⚠️Trading Alert : News Releases and Position Management 📰 🗞️ 🚫🚏
As a reminder, news releases can have a significant impact on market prices and volatility. To minimize potential losses and protect your running positions,
we recommend the following:
Avoid taking new trades during news releases
Use trailing stop-loss orders to protect your running positions and lock in profits
💖Supporting our robbery plan 💥Hit the Boost Button💥 will enable us to effortlessly make and steal money 💰💵. Boost the strength of our robbery team. Every day in this market make money with ease by using the Thief Trading Style.🏆💪🤝❤️🎉🚀
I'll see you soon with another heist plan, so stay tuned 🤑🐱👤🤗🤩
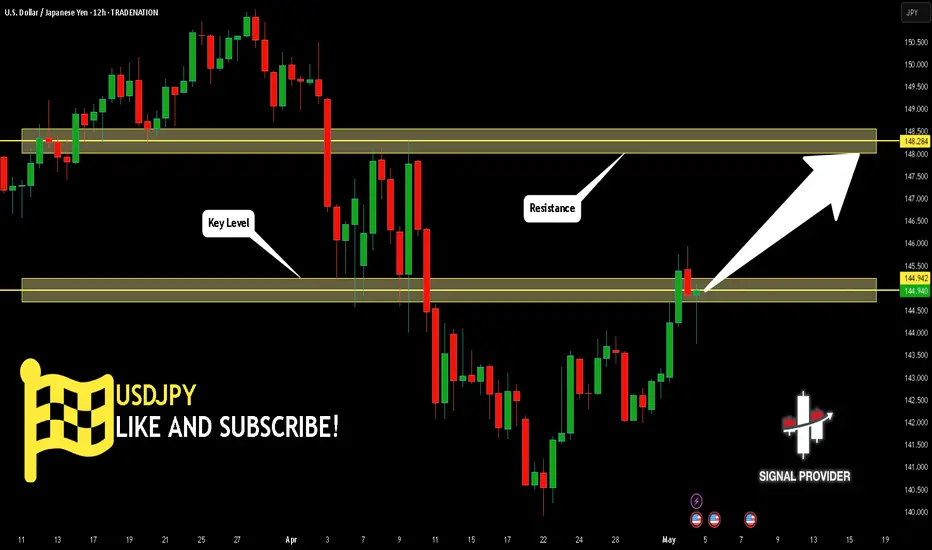
USDJPY Will Move Higher! Long!
Take a look at our analysis for USDJPY.
Time Frame: 12h
Current Trend: Bullish
Sentiment: Oversold (based on 7-period RSI)
Forecast: Bullish
The market is on a crucial zone of demand 144.942.
The oversold market condition in a combination with key structure gives us a relatively strong bullish signal with goal 148.284 level.
P.S
We determine oversold/overbought condition with RSI indicator.
When it drops below 30 - the market is considered to be oversold.
When it bounces above 70 - the market is considered to be overbought.
Disclosure: I am part of Trade Nation's Influencer program and receive a monthly fee for using their TradingView charts in my analysis.
Like and subscribe and comment my ideas if you enjoy them!
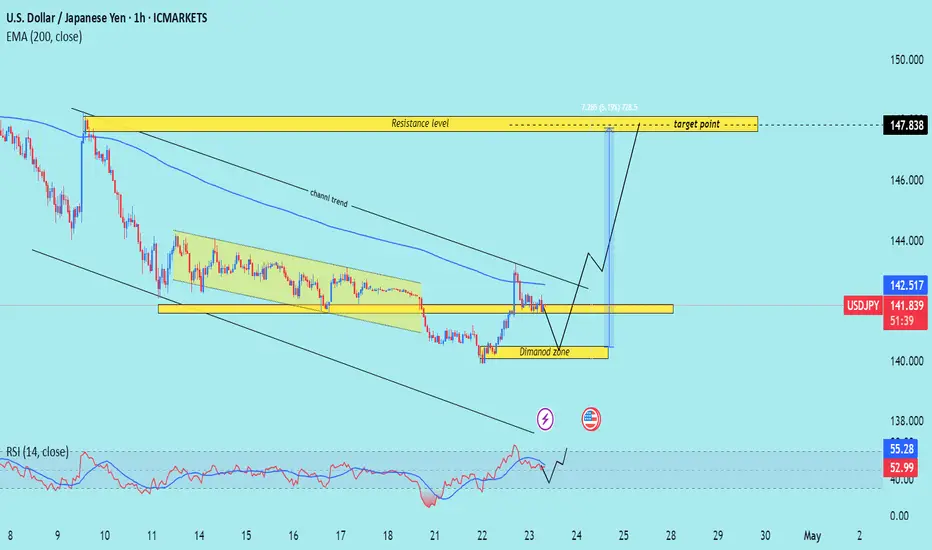
USD/JPY) bullish trend analysis Read The ChaptianSMC Trading point update
Technical analysis of USD/JPY chart shows a bullish reversal setup. Here’s a breakdown behind the analysis:
1. Downtrend & Channel Breakout:
Price was trending downward within a descending channel (marked “channel trend”).
Recently, the price broke out of the channel, signaling a potential trend reversal.
2. Demand Zone (Diamond Zone):
The yellow box labeled “Diamond Zone” represents a demand/support zone where price previously found buyers.
A retest of this zone is expected before the bullish move.
3. EMA (200):
The EMA (200) is currently above the price but close. A break above this level (142.522) could add to bullish momentum.
4. RSI Indicator:
RSI is showing a bounce off a mid-level (~50), suggesting bullish momentum is gaining.
5. Target Level:
The analysis targets 147.838, which aligns with a prior resistance zone.
The move projects a 5.19% gain (~778.5 pips) from the current setup.
Trading Idea Summary:
Entry: Around the “Diamond Zone” after a successful retest.
Confirmation: Watch for bullish candlestick patterns or a break above EMA 200.
Target: 147.838
Stop Loss (implied): Below the Diamond Zone (~140.000)
Pales support boost 🚀 analysis follow)
Look To Sell USD and Buy EUR, GBP, NZD and AUD!This is the FOREX outlook for the week of May 5 - 9th.
In this video, we will analyze the following FX markets:
USD Index
EUR
GBP
AUD
NZD
CAD
CHF
JPY
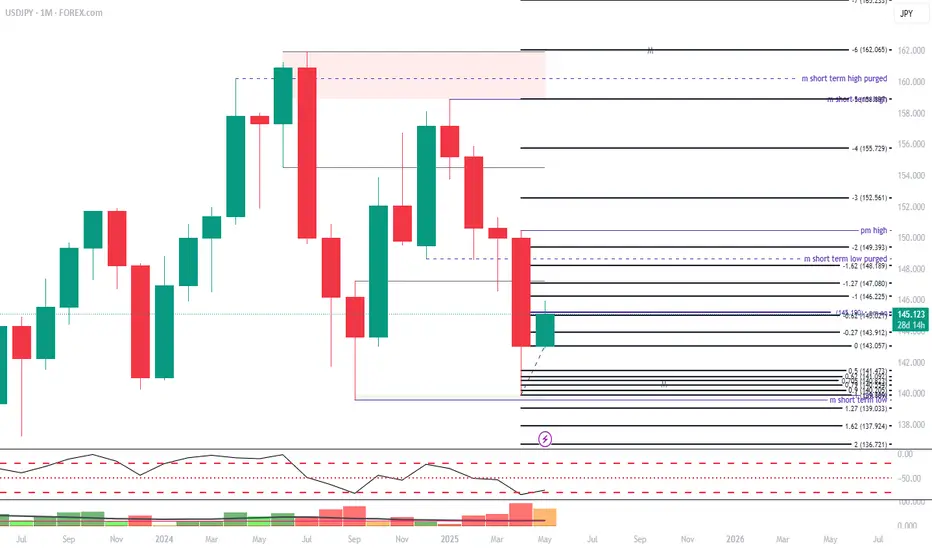
USD Index has tapped the W -FVG. I expect it to sweep the last week's high before heading down. Short term strength for longer term weakness.
Look to buy xxxUSD pairs. Sell USDxxx pairs.
Wait for valid setups. FOMC is Wednesday! Don't just jump into trades without confirming the bias first!
Enjoy!
May profits be upon you.
Leave any questions or comments in the comment section.
I appreciate any feedback from my viewers!
Like and/or subscribe if you want more accurate analysis.
Thank you so much!
Disclaimer:
I do not provide personal investment advice and I am not a qualified licensed investment advisor.
All information found here, including any ideas, opinions, views, predictions, forecasts, commentaries, suggestions, expressed or implied herein, are for informational, entertainment or educational purposes only and should not be construed as personal investment advice. While the information provided is believed to be accurate, it may include errors or inaccuracies.
I will not and cannot be held liable for any actions you take as a result of anything you read here.
Conduct your own due diligence, or consult a licensed financial advisor or broker before making any and all investment decisions. Any investments, trades, speculations, or decisions made on the basis of any information found on this channel, expressed or implied herein, are committed at your own risk, financial or otherwise.

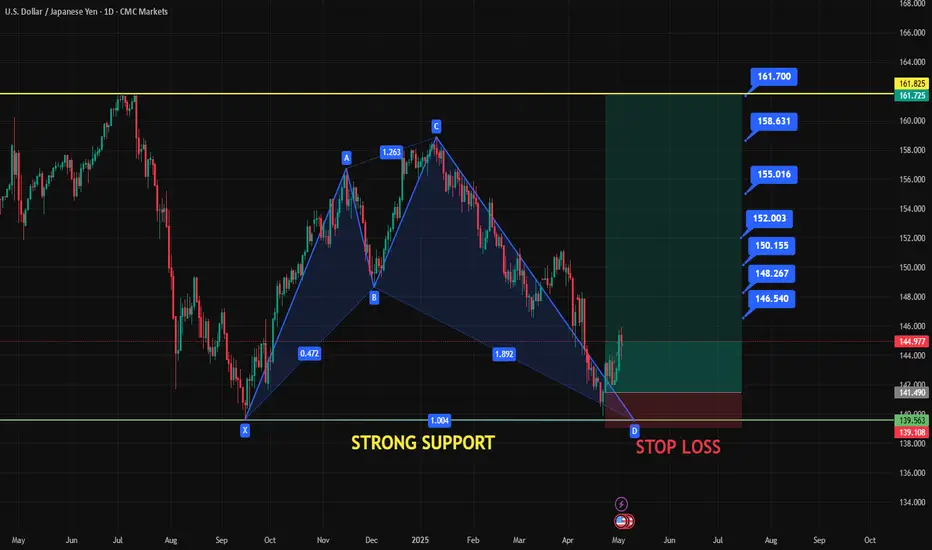
USDJPY WILL FLY TO 161 !!HELLO TRADES
As you can see a harmonic pattren on Daily Chart for this pair udsjpy we have a great oppritunity to join the Us Dollar Rally we can see a horizontal Support was tested and and its moving to given Targets chart is simple and easy to ready make a proper research before taking any trade these are only dail based valid targets if not break given Stop loss We need ur Supports and comments Stay Tuned for more update ...
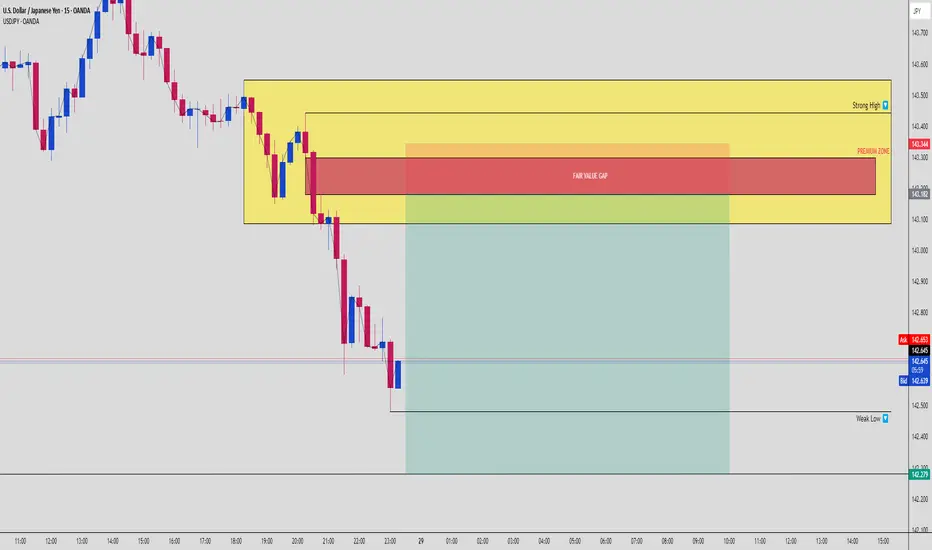
"USDJPY Crashing from Premium FVG | Liquidity Grab Confirmed!"USDJPY Analysis 🧠 | 15M Timeframe
Price tapped deep into the Premium Area, perfectly aligning with a high-probability Fair Value Gap (FVG) and Order Block confluence.
We witnessed a strong bearish reaction — classic Smart Money move in action.
Key Observations:
Price surged aggressively into the Premium Zone (~79% retracement area).
Immediate bearish reaction from the red Fair Value Gap zone.
Liquidity sweep confirmed above the previous Strong High.
Discount Area below remains unfilled, offering juicy targets.
🧠 Smart Money Concept Insight:
Institutions love to bait breakout traders by pumping into Premium Zones.
After collecting stop orders and liquidity above highs, they aggressively reverse, aiming to rebalance into the Discount Area.
USDJPY delivered a textbook liquidity grab before the sharp drop!
Current Trading Plan:
Bearish bias remains intact after the strong reaction.
TP1: Mid Discount Area
TP2: Weak Low liquidity sweep zone
SL (for any new shorts): Above the Strong High
Remember:
📚 Premium = Look for Sell Opportunities
📚 Discount = Look for Buy Opportunities
Stay laser-focused on Smart Money footprints, not noise.
📉 Emotions out, execution sharp!
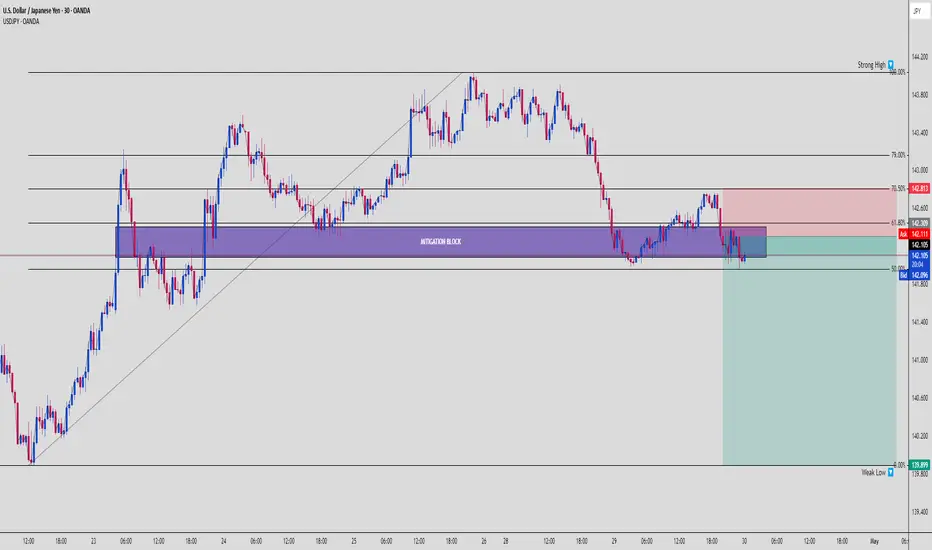
"USDJPY | Smart Money Premium Trap | Mitigation Block Rejection"⚡ USDJPY Analysis – 30M Timeframe | April 30, 2025
📊 Price Action Summary:
USDJPY has aggressively tapped into the Premium Zone, aligning perfectly with a Mitigation Block and Fibonacci 61.8% golden pocket.
We’re seeing early signs of Smart Money rejection — time to stay sharp! 🧐
🔥 Key Moves:
Premium Zone Entry: Price retraced right into the 61.8–70.5% fib region.
Mitigation Block respected: A known Smart Money zone where trapped sellers from previous moves get wrecked.
Liquidity Build-Up Below: Eyes on the unprotected lows — Smart Money LOVES to grab those.
🧠 What’s Really Going On Behind the Scenes:
Retail traders: "It’s bouncing! Let’s go long!" 🟢💸
Smart Money: "Perfect… let’s trap them for liquidity." 🧊📉
This move screams classic Premium Trap — draw them in, then nuke it. ☠️
🧩 Why This Setup Matters:
Mitigation Block + FVG combo = High-probability rejection zone
Sellers are likely reloading positions here
The Strong High has been established — room to target Weak Lows below
🎯 Trade Setup Idea:
Entry: Inside or just below the Mitigation Block (confirmation from bearish rejection)
Stop Loss: Just above the Strong High (~142.813)
Take Profit Zones:
TP1: Mid-discount (~141.400)
TP2: Weak Low (~139.899) — the real liquidity target 🎯
💬 Pro Tip:
"Mitigation blocks are the sniper’s nest for Smart Money. Get in, get out, get paid." 🎯
Watch the reaction closely inside the purple zone. It’s not just a block — it’s a liquidity recycling station.
🚀 Summary:
✅ Price entered Premium
✅ Mitigation Block tested
✅ Liquidity below waiting
✅ High RRR bearish setup aligning
🧘♂️ Be patient. Wait for confirmation. Let Smart Money leave the trail — then follow.
✍️ Save this chart and study how Mitigation Blocks get respected over and over. It’s not magic — it’s mechanics.
➡️ Comment "SNEAKY SHORT" if you're watching the block trap unfold!
➡️ Tag a trader who still doesn’t believe in Premium/Discount theory. 😂📉📈
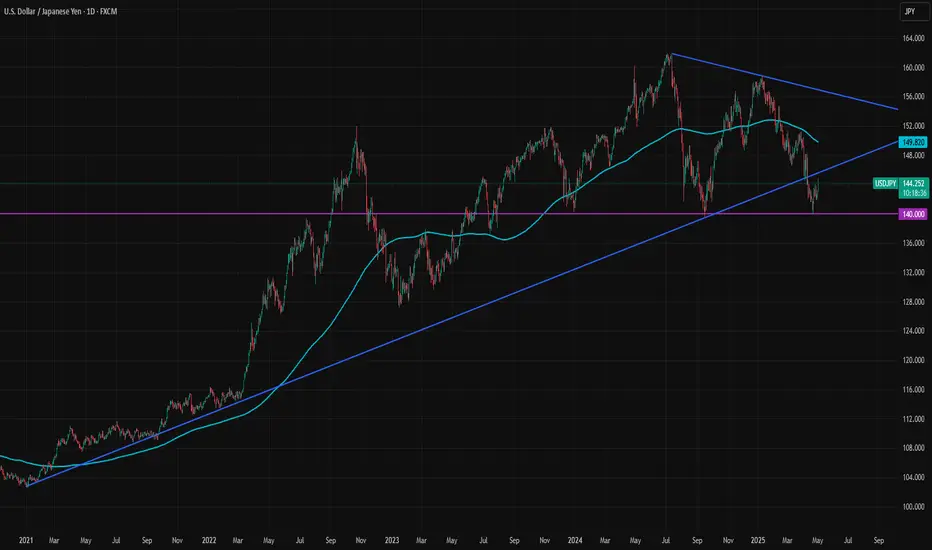
USDJPY: Bounce on the 17 month Support starting massive rally.USDJPY is neutral on its 1D technical outlook (RSI = 50.306, MACD = -0.870, ADX = 40.251) but is on a massive bounce on the S1 Zone, which has been holding since December 25th 2023. That Low last week also approached the 1W MA200. The LH trendline is the Resistance level of this pattern (Descending Triangle) and since the last one hit the 0.786 Fibonacci, we expect this one to hit the 0.618 Fib (TP = 153.500).
## If you like our free content follow our profile to get more daily ideas. ##
## Comments and likes are greatly appreciated. ##

Can USD/JPY hold THIS key support after a mixed NFP report? The US dollar traded mixed shortly after the NFP was released, as risk-on sentiment remained the prevailing trend. As index futures rose further, commodity dollars extended their gains against the greenback, while the USD/JPY attempted to find support around the key 144.00 - 144.50 area. This zone was resistance in the past so let's see if the UJ will be able to rebound from here later in the session, and in early next week.
NFP comes in stronger, but...
The nonfarm payrolls data “beat” forecasts, with a headline print of 177K vs. 138K eyed. But data for March was revised lower to 185K rom 228K. Revisions to prior two months have taken out 58K from initial estimates. Taken together, this is hardly a beat. But the good news was that full-time employment rose sharply. The unemployment rate, meanwhile, was unchanged at 4.2%.
On the inflation side of things, average earnings came in slightly lower than expected, rising 0.2% on a month-over-month basis, compared with 0.3% expected. Nothing to get too excited over, but potentially good news as far as inflation is concerned – especially after we saw a slightly weaker Core PCE Price Index in mid-week.
NFP was never going to matter much
The market’s focus is on trade war and trade negotiations. We were never going to see any wild market reactions, and so it has so far proved. The US dollar initially spiked then quickly returned to pre-NFP levels. Gold fell, and index futures added onto earlier gains.
Up next: ISM Services PMI on Monday and FOMC on Thursday.
By Fawad Razaqzada, market analyst with FOREX.com

USDJPY Trading Opportunity! SELL!
My dear subscribers,
This is my opinion on the USDJPY next move:
The instrument tests an important psychological level 144.50
Bias - Bearish
Technical Indicators: Supper Trend gives a precise Bearish signal, while Pivot Point HL predicts price changes and potential reversals in the market.
Target - 142.26
My Stop Loss - 145.51
About Used Indicators:
On the subsequent day, trading above the pivot point is thought to indicate ongoing bullish sentiment, while trading below the pivot point indicates bearish sentiment.
Disclosure: I am part of Trade Nation's Influencer program and receive a monthly fee for using their TradingView charts in my analysis.
———————————
WISH YOU ALL LUCK
LOOKING FOR USDJPY TO TARGET 149.400 Looking for a retrace into 143.9 and then a move to 149.400 weekly and monthly supply .
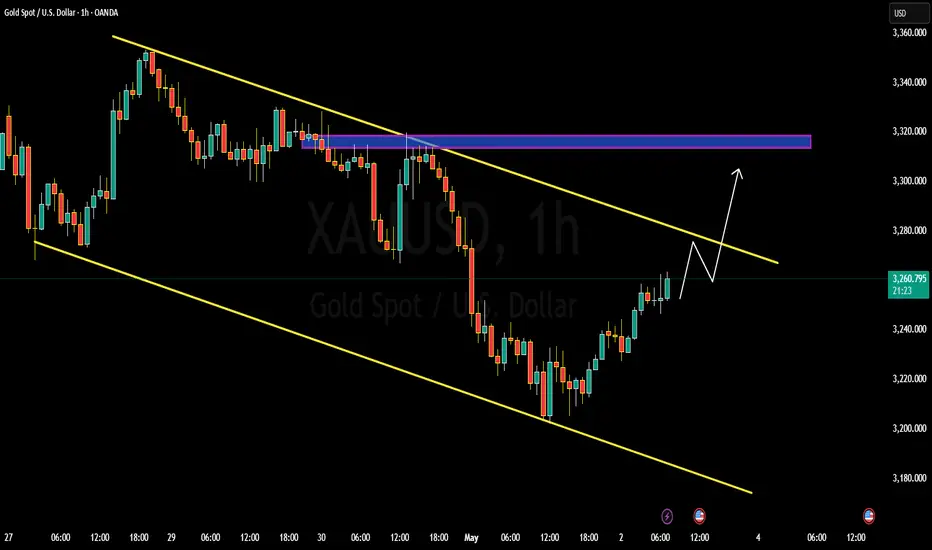
XAUUSD DETAILED ANALYSIS TECHNICAL AND FUNDAMENTALS XAUUSD is currently trading around the 3256 level and is clearly respecting a descending channel on the 1-hour timeframe. The price is now pushing higher from the lower boundary of the channel, suggesting short-term bullish momentum. Based on the current technical structure, I am anticipating a clean breakout above the channel resistance, with the next key target at 3300. The marked purple resistance zone around 3310–3320 also acts as a magnet for price once the breakout is confirmed.
On the fundamental side, gold remains supported by ongoing geopolitical uncertainty and speculation around the Fed's next rate decision. With recent U.S. economic data showing mixed signals—strong labor market figures but slowing inflation momentum—the market is pricing in fewer rate hikes, which weakens the USD and favors upside in XAUUSD. Additionally, central bank gold demand remains strong globally, acting as a long-term support for bullion.
Traders are currently reacting to a softening dollar index and treasury yields, which further underpins bullish sentiment in gold. A clear break above the upper boundary of this channel, ideally with strong volume confirmation, could set the stage for a swift move to retest the 3300 psychological level. From a risk-reward perspective, the breakout trade setup here aligns well with institutional strategies that favor trend continuation post-consolidation.
In summary, XAUUSD is trading inside a clean descending channel, with buyers stepping in aggressively near the support zone. A breakout above the structure could trigger a bullish continuation move toward 3300, backed by strong macro tailwinds and technical confirmation. This setup offers an excellent opportunity for swing traders to capitalize on short-term momentum. Are you also tracking gold fundamentals this week?
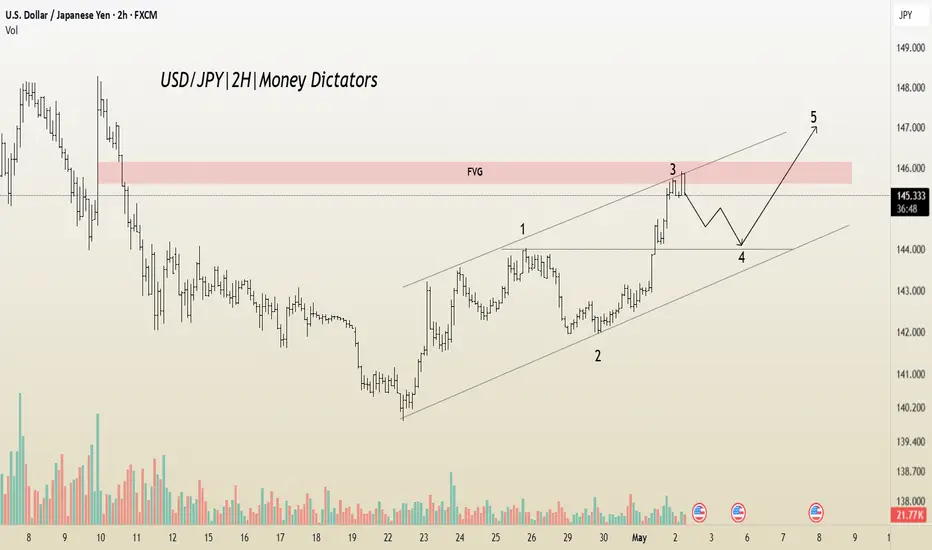
USD/JPY Eyes Breakout After Healthy Wave 4 CorrectionThe USD/JPY pair is currently unfolding a clean impulsive 5-wave structure to the upside. The price action has already completed Waves 1, 2, and 3, and has entered a probable Wave 4 correction.
Wave 3 appears extended and tapped into a key Fair Value Gap (FVG), which acted as resistance.
Wave 4 is likely to develop as a shallow retracement, possibly forming a bull flag or expanded flat before launching into Wave 5.
The ascending channel supports the bullish structure with both Wave 2 and Wave 4 respecting lower bounds.
Targets: 144.750 - 144.351
Stoploss: 146.268
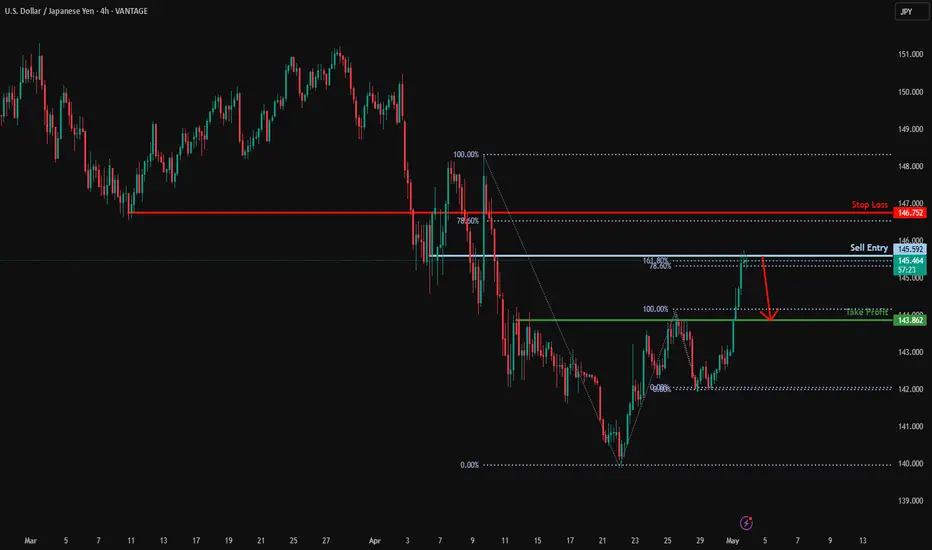
Could the price reverse from here?USD/JPY is reacting off the resistance level which is a pullback resistance that lines up with the 161.8% Fibonacci extension and the 78.6% Fibonacci projection and could reverse from this level to our take profit.
Entry: 145.59
Why we like it:
There is a pullback resistance level that lines up with the 161.8% Fibonacci extension and the 78.6% Fibonacci projection.
Stop loss: 146.75
Why we like it:
There is a pullback resistance level that line sup with the 78.6% Fibonacci retracement.
Take profit: 143.86
Why we like it:
There is a pullback support level.
Enjoying your TradingView experience? Review us!
Please be advised that the information presented on TradingView is provided to Vantage (‘Vantage Global Limited’, ‘we’) by a third-party provider (‘Everest Fortune Group’). Please be reminded that you are solely responsible for the trading decisions on your account. There is a very high degree of risk involved in trading. Any information and/or content is intended entirely for research, educational and informational purposes only and does not constitute investment or consultation advice or investment strategy. The information is not tailored to the investment needs of any specific person and therefore does not involve a consideration of any of the investment objectives, financial situation or needs of any viewer that may receive it. Kindly also note that past performance is not a reliable indicator of future results. Actual results may differ materially from those anticipated in forward-looking or past performance statements. We assume no liability as to the accuracy or completeness of any of the information and/or content provided herein and the Company cannot be held responsible for any omission, mistake nor for any loss or damage including without limitation to any loss of profit which may arise from reliance on any information supplied by Everest Fortune Group.
USD/JPY : Get Ready for another Rally! (READ THE CAPTION)By analyzing the USD/JPY chart on the daily timeframe, we can see that, as expected, the price has finally started to rise. So far, it has successfully reached the 143.5 and 144 targets, and extended up to 145.76, delivering a solid 350-pip move.
The main analysis remains valid, and I expect the price to hit the next target at 146.2 soon.
The total gain from this setup has now exceeded 570 pips, and the key upcoming supply zones are at 146.2, 148.7, and 150.
This analysis will be updated accordingly!
THE MAIN ANALYSIS :
Please support me with your likes and comments to motivate me to share more analysis with you and share your opinion about the possible trend of this chart with me !
Best Regards , Arman Shaban

DeGRAM | USDJPY Keeps the Demand Zone📊 Technical Analysis
● USD/JPY has broken the falling-wedge top and is holding above the 142.20 breakout line; that keeps 144.03 → 147.5 in scope.
💡 Fundamental Analysis
● U.S. March retail sales surged 1.4 %, underscoring resilient demand.
✨ Summary
A wedge breakout plus firm U.S. data, a hawkish Fed and a dovish BOJ favour more dollar strength; holding above 142.20 keeps USD/JPY on track for $144.03–147.5.
-------------------
Share your opinion in the comments and support the idea with like. Thanks for your support!
USDJPY Daily & H4 Forecasts, Technical Analysis & Trading IdeaTechnical analysis is on the chart!
No description needed!
FX:USDJPY
________________________________________________________________
❤️ If you find this helpful and want more FREE forecasts in TradingView,
. . . . . . . . Hit the 'BOOST' button 👍
. . . . . . . . . . . Drop some feedback in the comments below! (e.g., What did you find most useful? How can we improve?)
🙏 Your support is appreciated!
Now, it's your turn!
Be sure to leave a comment; let us know how you see this opportunity and forecast.
Have a successful week,
ForecastCity Support Team

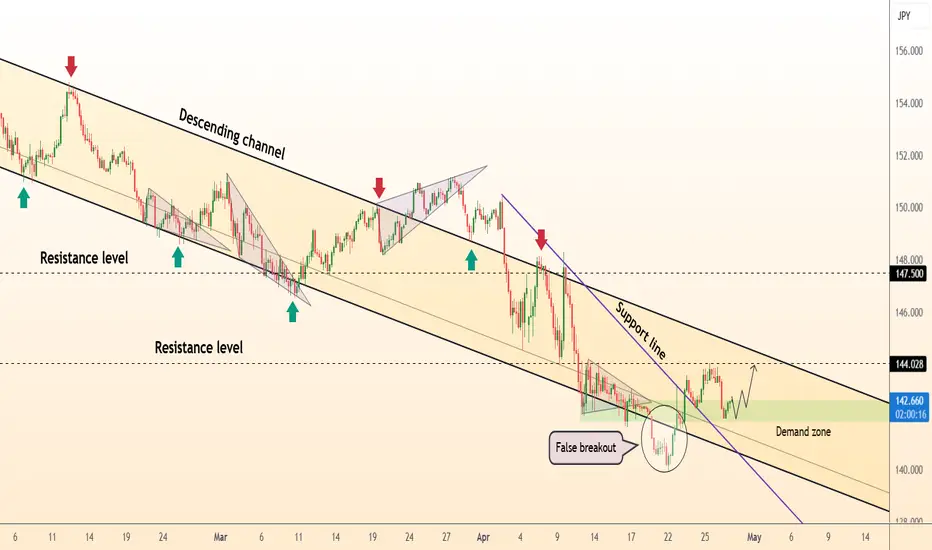
USDJPY Poised to Retest Broken Trendline After Dovish BOJWe discussed the potential battle between bulls and bears near the trendline in our early April post. USDJPY bears ultimately won that battle, and the 140 target was reached. You can view the earlier post here:
Following the breakdown, the 140 level acted as support, and now an upward reaction has begun. At today’s meeting, the BOJ held rates steady at 0.50% as expected, and Governor Ueda delivered a dovish message. The BOJ lowered its core inflation forecast by 0.2% to 2.2% for 2025 and to 1.7% for 2026. The GDP forecast was also revised down from 1.1% to 0.5%.
These projections suggest the BOJ lacks full confidence in consistently reaching its 2% inflation target, though it's very close. However, the risk of tariffs complicates the outlook. Tariffs could negatively impact both growth and inflation, and the BOJ will likely hold off on further rate hikes for at least a few meetings to observe early effects.
In the context of a more dovish BOJ and the dollar index stabilizing after weeks of declines, USDJPY is staging a positive correction. A retest of the broken trendline appears likely, with potential for the short-term rally to extend toward 148.50. Beyond that point, the market will face a critical decision. If the upward reaction stalls, another medium-term move back toward 140 remains a strong possibility.