Could the price bounce from here?USD/JPY is falling towards the support level which is a pullback support that aligns with the 61.8% Fibonacci retracement and could bounce from this level to our take profit.
Entry: 142.39
Why we like it:
There is a pullback support level that line sup with the 61.8% Fibonacci retracement.
Stop loss: 141.95
Why we like it:
There is a pullback support level.
Take profit: 143.13
Why we like it:
There is a pullback resistance level.
Enjoying your TradingView experience? Review us!
Please be advised that the information presented on TradingView is provided to Vantage (‘Vantage Global Limited’, ‘we’) by a third-party provider (‘Everest Fortune Group’). Please be reminded that you are solely responsible for the trading decisions on your account. There is a very high degree of risk involved in trading. Any information and/or content is intended entirely for research, educational and informational purposes only and does not constitute investment or consultation advice or investment strategy. The information is not tailored to the investment needs of any specific person and therefore does not involve a consideration of any of the investment objectives, financial situation or needs of any viewer that may receive it. Kindly also note that past performance is not a reliable indicator of future results. Actual results may differ materially from those anticipated in forward-looking or past performance statements. We assume no liability as to the accuracy or completeness of any of the information and/or content provided herein and the Company cannot be held responsible for any omission, mistake nor for any loss or damage including without limitation to any loss of profit which may arise from reliance on any information supplied by Everest Fortune Group.
USDJPY

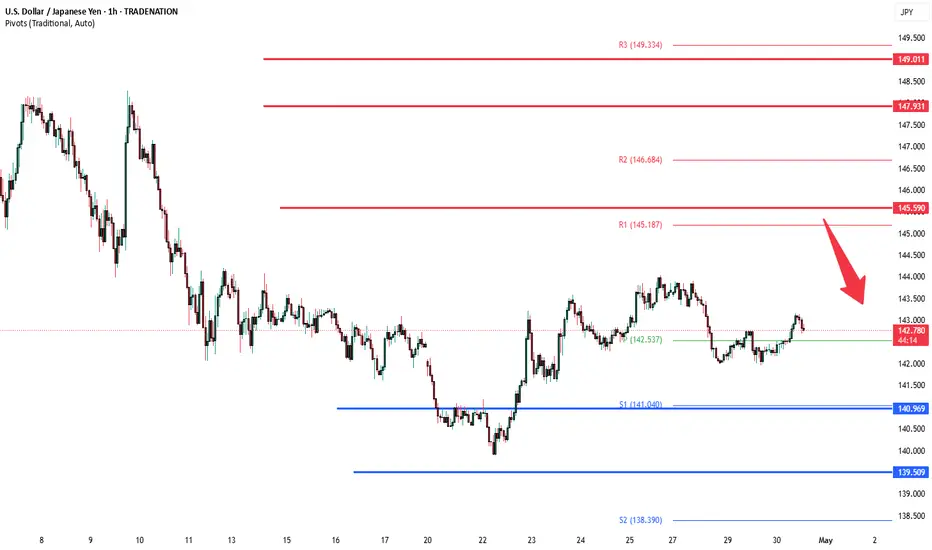
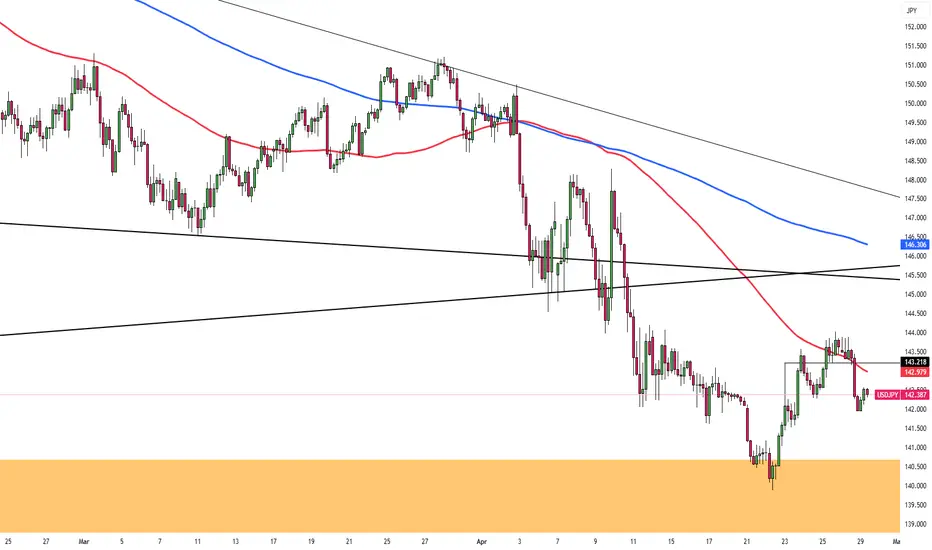
USDJPY INTRADAY downtrend continuationThe USDJPY pair is exhibiting a bearish sentiment, reinforced by the ongoing downtrend. The key trading level to watch is at 145.60, which represents the current intraday swing low and the falling resistance trendline level.
In the short term, an oversold rally from current levels, followed by a bearish rejection at the 145.60 resistance, could lead to a downside move targeting support at 141.00, with further potential declines to 139.50 and 138.40 over a longer timeframe.
On the other hand, a confirmed breakout above the 145.60 resistance level and a daily close above that mark would invalidate the bearish outlook. This scenario could pave the way for a continuation of the rally, aiming to retest the 147.90 resistance, with a potential extension to 149.00 levels.
Conclusion:
Currently, the USDJPY sentiment remains bearish, with the 145.60 level acting as a pivotal resistance. Traders should watch for either a bearish rejection at this level or a breakout and daily close above it to determine the next directional move. Caution is advised until the price action confirms a clear break or rejection.
This communication is for informational purposes only and should not be viewed as any form of recommendation as to a particular course of action or as investment advice. It is not intended as an offer or solicitation for the purchase or sale of any financial instrument or as an official confirmation of any transaction. Opinions, estimates and assumptions expressed herein are made as of the date of this communication and are subject to change without notice. This communication has been prepared based upon information, including market prices, data and other information, believed to be reliable; however, Trade Nation does not warrant its completeness or accuracy. All market prices and market data contained in or attached to this communication are indicative and subject to change without notice.
USDJPY 4h Long Setup | Low Risk High Reward Market broke the descending structure with strong bullish impulse followed by higher lows respecting new trendline
Price retested the previous resistance now turned support zone with a bullish reaction
Entry is taken after confirmation of the retest holding and bullish continuation signs
Entry : 142.494
SL : 140.676
TP : 148.270
RR 1 : 3.2
Price action aligned with short-term bullish reversal structure and clear demand zone defense
Let price do the work

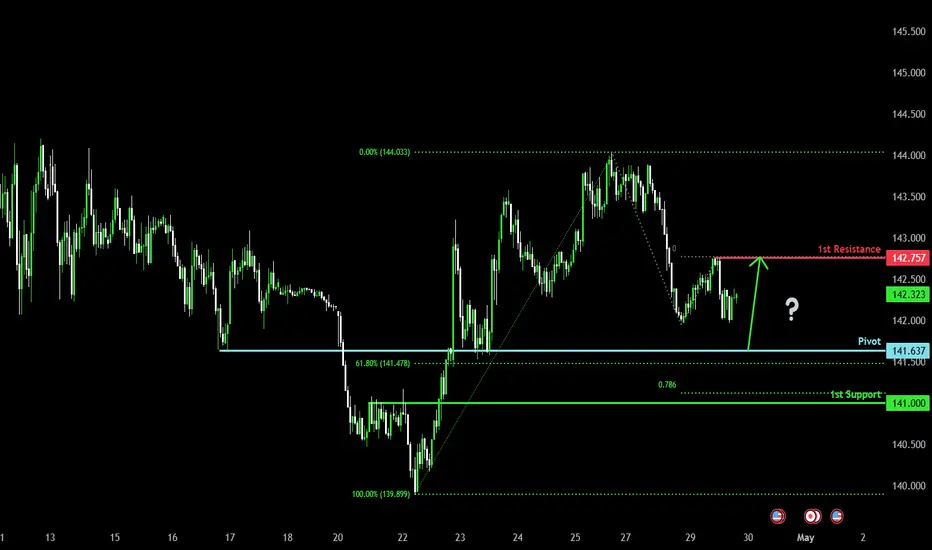
Bullish bounce off pullback support?USD/JPY is falling towards the pivot which is a pullback support and could rise to the 1st resistance.
Pivot: 141.63
1st Support: 141.00
1st Resistance: 142.75
Risk Warning:
Trading Forex and CFDs carries a high level of risk to your capital and you should only trade with money you can afford to lose. Trading Forex and CFDs may not be suitable for all investors, so please ensure that you fully understand the risks involved and seek independent advice if necessary.
Disclaimer:
The above opinions given constitute general market commentary, and do not constitute the opinion or advice of IC Markets or any form of personal or investment advice.
Any opinions, news, research, analyses, prices, other information, or links to third-party sites contained on this website are provided on an "as-is" basis, are intended only to be informative, is not an advice nor a recommendation, nor research, or a record of our trading prices, or an offer of, or solicitation for a transaction in any financial instrument and thus should not be treated as such. The information provided does not involve any specific investment objectives, financial situation and needs of any specific person who may receive it. Please be aware, that past performance is not a reliable indicator of future performance and/or results. Past Performance or Forward-looking scenarios based upon the reasonable beliefs of the third-party provider are not a guarantee of future performance. Actual results may differ materially from those anticipated in forward-looking or past performance statements. IC Markets makes no representation or warranty and assumes no liability as to the accuracy or completeness of the information provided, nor any loss arising from any investment based on a recommendation, forecast or any information supplied by any third-party.
Daily Price Action: USDJPY Tuesday 4/29/2025In this video, we will be looking into the potential price action USDJPY.

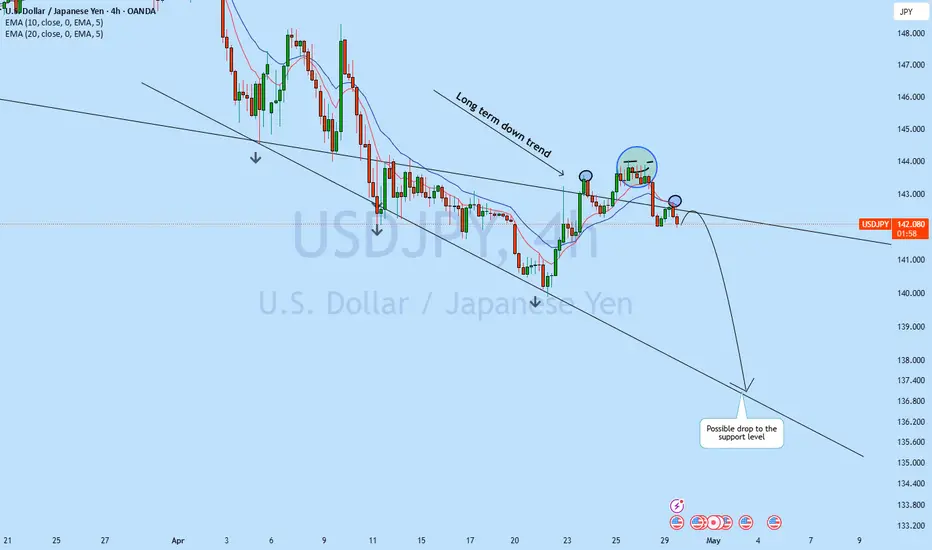
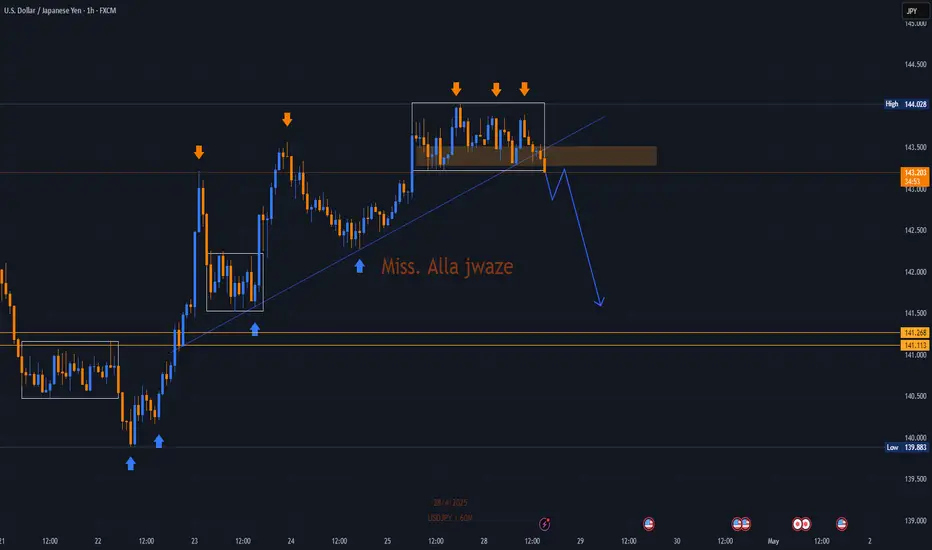
USDJPY ready for another drop?After daily break of structure USDJPY just has managed to form another head and shoulder with strong liquidity grab has started to move in the major direction of the trend. After yesterdays drop, price today so far has done pullback and formed another possible bearish market structure.
As of upcoming USD and JPY news may push that price back to the support as shown in sketch.
A sell trade is high probability
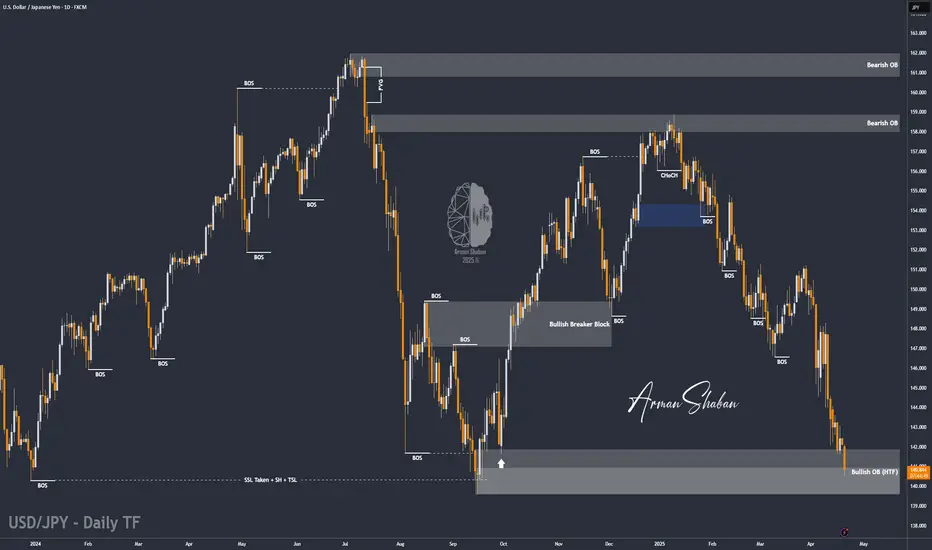
USD/JPY : Bull or Bear? Let's See! (READ THE CAPTION)Upon reviewing the USD/JPY chart on the daily timeframe, we observe that due to the sharp drop in the Dollar Index, the price has reached the 140.850 level. This decline was very strong and impulsive; however, as seen on the chart, the price has now approached a significant demand zone between 139.6 and 141. If the price manages to close and stabilize above this area, we can expect a further bullish move from this pair.
Please support me with your likes and comments to motivate me to share more analysis with you and share your opinion about the possible trend of this chart with me !
Best Regards , Arman Shaban
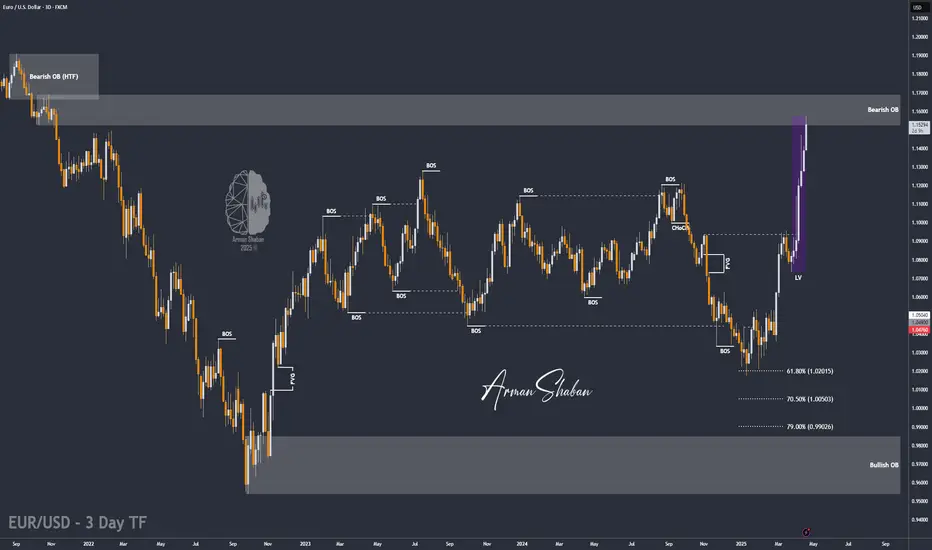
EUR/USD: Possible Fall Ahead? Let's See! (READ THE CAPTION)Upon reviewing the EUR/USD chart on the 3-day timeframe, we can see that following a sharp decline in the Dollar Index (DXY), the pair experienced a bullish move, reaching the 1.15 supply zone. If the price manages to stabilize and close below the 1.15–1.17 area, we can anticipate a further drop in EUR/USD to fill the created Liquidity Void (LV). This analysis will be updated accordingly.
Please support me with your likes and comments to motivate me to share more analysis with you and share your opinion about the possible trend of this chart with me !
Best Regards , Arman Shaban
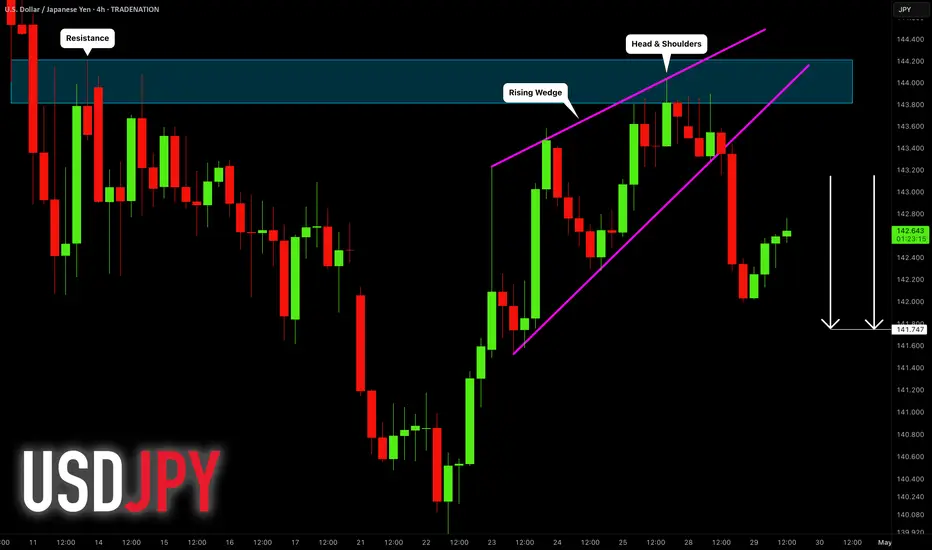
USDJPY: Bearish Outlook Explained 🇺🇸🇯🇵
I see a very bearish price action on USDJPY:
The price formed a head & shoulders pattern after a test of
a key daily/intraday resistance and violated its neckline
and a rising support of a rising wedge pattern.
The next strong support is 141.75
It will most likely be the next goal for the sellers.
❤️Please, support my work with like, thank you!❤️
I am part of Trade Nation's Influencer program and receive a monthly fee for using their TradingView charts in my analysis.
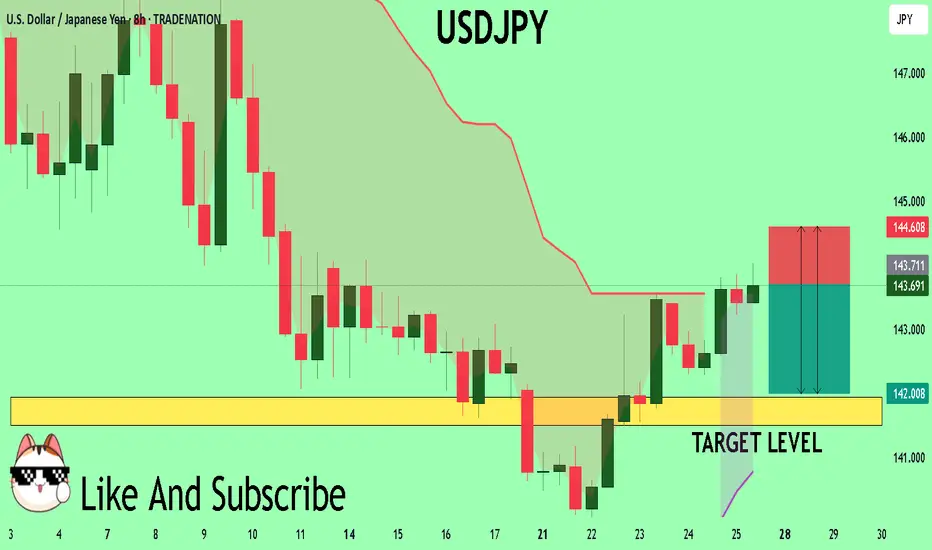
Yen Under Pressure Ahead of BOJ DecisionThe Japanese yen edged closer to 144 per dollar on Monday, continuing last week’s decline as global trade sentiment improved and the dollar strengthened. Markets responded to a private meeting between Japan’s Finance Minister Kato and U.S. Treasury Secretary Bessent, during which both parties stressed the importance of ongoing discussions on currency matters. Meanwhile, Japan’s trade negotiator is set to visit Washington this week, as the Bank of Japan is expected to maintain interest rates at 0.5%, amid concerns over the economic impact of U.S. tariffs.
Key resistance is at 144.00, with further levels at 145.90 and 146.75. Support stands at 139.70, followed by 137.00 and 135.00.
USDJPY: Analysis daily with me!USD/JPY is rebounding towards 142.50 in Tuesday's Asian session. Improved risk sentiment weakens the safe-haven Yen and supports the US Dollar. However, a Japanese holiday is limiting further upside.

USD/JPYThe Japanese Yen (JPY) oscillates in a narrow trading band at the start of a new week and remains close to a two-week trough touched against its American counterpart on Friday. Mixed signals from the US and China temper hopes for a quick resolution of the trade conflict between the world's two largest economies, which, in turn, offers support to the safe-haven JPY. Moreover, expectations that Japan will strike a trade deal with the US turn out to be another factor underpinning the JPY.
Meanwhile, investors have been scaling back their bets for an immediate interest rate hike by the Bank of Japan (BoJ) as rising economic risks from US tariffs overshadow signs of broadening inflation in Japan. This holds back the JPY bulls from placing aggressive bets, which, along with a modest US Dollar (USD) uptick, acts as a tailwind for the USD/JPY pair. However, the divergent BoJ-Federal Reserve (Fed) policy expectations should cap the USD and benefit the lower-yielding JPY.

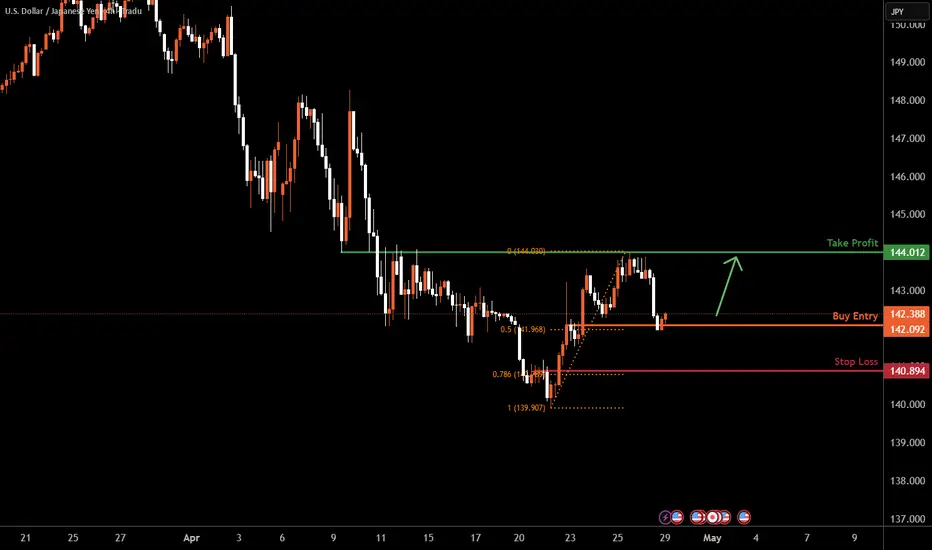
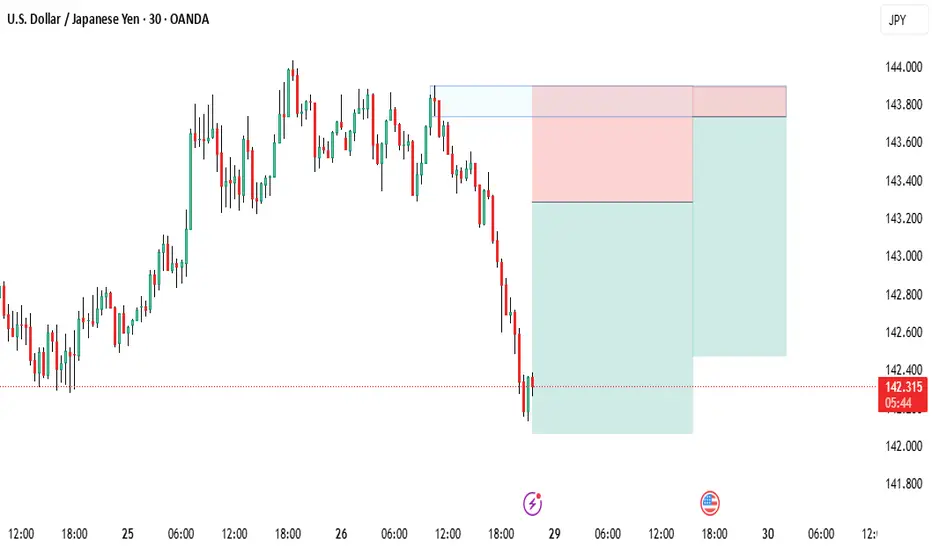
USDJPY H4 I Bullish Rise Based on the H4 chart analysis, we can see that the price has just bounced off our buy entry at 142.09, which is an overlap support that aligns close to the 50% Fibo retracement.
Our take profit will be at 144.01, which is an overlap resistance level.
The stop loss will be placed at 140.89, which is a pullback support level.
High Risk Investment Warning
Trading Forex/CFDs on margin carries a high level of risk and may not be suitable for all investors. Leverage can work against you.
Stratos Markets Limited (tradu.com):
CFDs are complex instruments and come with a high risk of losing money rapidly due to leverage. 63% of retail investor accounts lose money when trading CFDs with this provider. You should consider whether you understand how CFDs work and whether you can afford to take the high risk of losing your money.
Stratos Europe Ltd (tradu.com):
CFDs are complex instruments and come with a high risk of losing money rapidly due to leverage. 63% of retail investor accounts lose money when trading CFDs with this provider. You should consider whether you understand how CFDs work and whether you can afford to take the high risk of losing your money.
Stratos Global LLC (tradu.com):
Losses can exceed deposits.
Please be advised that the information presented on TradingView is provided to Tradu (‘Company’, ‘we’) by a third-party provider (‘TFA Global Pte Ltd’). Please be reminded that you are solely responsible for the trading decisions on your account. There is a very high degree of risk involved in trading. Any information and/or content is intended entirely for research, educational and informational purposes only and does not constitute investment or consultation advice or investment strategy. The information is not tailored to the investment needs of any specific person and therefore does not involve a consideration of any of the investment objectives, financial situation or needs of any viewer that may receive it. Kindly also note that past performance is not a reliable indicator of future results. Actual results may differ materially from those anticipated in forward-looking or past performance statements. We assume no liability as to the accuracy or completeness of any of the information and/or content provided herein and the Company cannot be held responsible for any omission, mistake nor for any loss or damage including without limitation to any loss of profit which may arise from reliance on any information supplied by TFA Global Pte Ltd.
The speaker(s) is neither an employee, agent nor representative of Tradu and is therefore acting independently. The opinions given are their own, constitute general market commentary, and do not constitute the opinion or advice of Tradu or any form of personal or investment advice. Tradu neither endorses nor guarantees offerings of third-party speakers, nor is Tradu responsible for the content, veracity or opinions of third-party speakers, presenters or participants.
#USDJPYTwo resistances are shown, which can be used to trade short. One signal is higher risk because it has a higher stop, and the other is lower risk.
Will USDJPY Shows Reaction Below Liquidity?$$$$
N.B!
- USDJPY price might not follow the drawn lines . Actual price movements may likely differ from the forecast.
- Let emotions and sentiments work for you
- ALWAYS Use Proper Risk Management In Your Trades
#usdjpy
#usd
#jpy

USDJPY My Opinion! SELL!
My dear friends,
My technical analysis for USDJPY is below:
The market is trading on 143.69pivot level.
Bias - Bearish
Technical Indicators: Both Super Trend & Pivot HL indicate a highly probable Bearish continuation.
Target - 141.93
Recommended Stop Loss - 144.60
About Used Indicators:
A pivot point is a technical analysis indicator, or calculations, used to determine the overall trend of the market over different time frames.
Disclosure: I am part of Trade Nation's Influencer program and receive a monthly fee for using their TradingView charts in my analysis.
———————————
WISH YOU ALL LUCK
USDJPY 1 Hour Timeframe on a UptrendCurrently USDJPY in the 1 hour timeframe is on an uptrend with a series of higher highs and higher lows. At the moment the corrective wave is completed and actively looking for buy setup.

USDJPY We have a strong gathering in the area. We expect the dollar to fall against the Japanese yen as a technical analysis, but any geopolitical entry changes the analysis course, so we expect a decline.
Fundamental Market Analysis for April 28, 2025 USDJPYUSDJPY:
The Japanese yen (JPY) fluctuated in a narrow range in Monday's Asian session and paused its recent pullback from a multi-month high reached last week against its U.S. counterpart. U.S. Treasury Secretary Scott Bessent did not support President Donald Trump's statement that tariff talks with China are underway. That tempered optimism about a quick resolution to trade tensions between the world's two largest economies and provided some support for the safe-haven yen.
Meanwhile, traders pushed back expectations of an immediate interest rate hike by the Bank of Japan (BoJ) due to rising economic risks from US tariffs. However, signs of rising inflation in Japan leave the door open for further BoJ rate hikes this year, which is a big divergence from bets on more aggressive Federal Reserve (Fed) policy easing. This keeps USD bulls on the defensive and also serves as a tailwind for the low-yielding Yen.
Trading recommendation: SELL 143.20, SL 143.60, TP 142.50
USDJPY Long Setup – Fundamental + Sentiment AlignmentAfter a full macro, COT, and sentiment analysis for this week, USDJPY stands out as the cleanest opportunity.
✅ Strong USD support: solid economic growth, persistent inflation, and elevated Treasury yields.
✅ Extremely weak JPY: Bank of Japan remains dovish, with low inflation and no sign of tightening policy.
✅ Risk sentiment: Stable to positive, favoring continuation of USD strength.
Bias: Long USDJPY
Risk: Unexpected shifts in US data or global risk-off shocks.
🔔 If you like this type of detailed analysis combining fundamentals, positioning, and sentiment — make sure to follow me for weekly setups and insights.
Let's trade smarter, not harder. 🚀
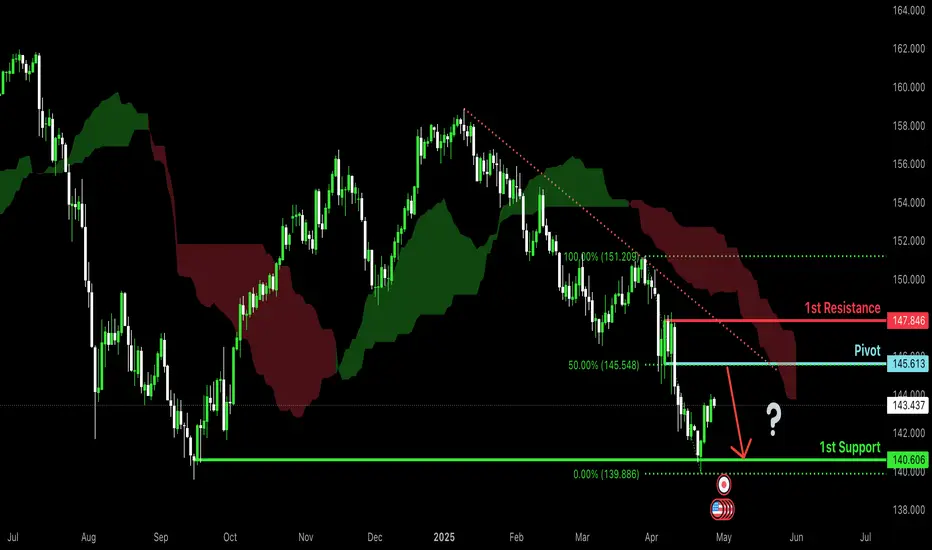
Could the price reverse from here?USD/JPY is rising towards the pivot which is a pullback resitance that aligns with the 50% Fibonacci retracement and could reverse to the 1st support.
Pivot: 145.61
1st Support: 140.60
1st Resistance: 147.84
Risk Warning:
Trading Forex and CFDs carries a high level of risk to your capital and you should only trade with money you can afford to lose. Trading Forex and CFDs may not be suitable for all investors, so please ensure that you fully understand the risks involved and seek independent advice if necessary.
Disclaimer:
The above opinions given constitute general market commentary, and do not constitute the opinion or advice of IC Markets or any form of personal or investment advice.
Any opinions, news, research, analyses, prices, other information, or links to third-party sites contained on this website are provided on an "as-is" basis, are intended only to be informative, is not an advice nor a recommendation, nor research, or a record of our trading prices, or an offer of, or solicitation for a transaction in any financial instrument and thus should not be treated as such. The information provided does not involve any specific investment objectives, financial situation and needs of any specific person who may receive it. Please be aware, that past performance is not a reliable indicator of future performance and/or results. Past Performance or Forward-looking scenarios based upon the reasonable beliefs of the third-party provider are not a guarantee of future performance. Actual results may differ materially from those anticipated in forward-looking or past performance statements. IC Markets makes no representation or warranty and assumes no liability as to the accuracy or completeness of the information provided, nor any loss arising from any investment based on a recommendation, forecast or any information supplied by any third-party.
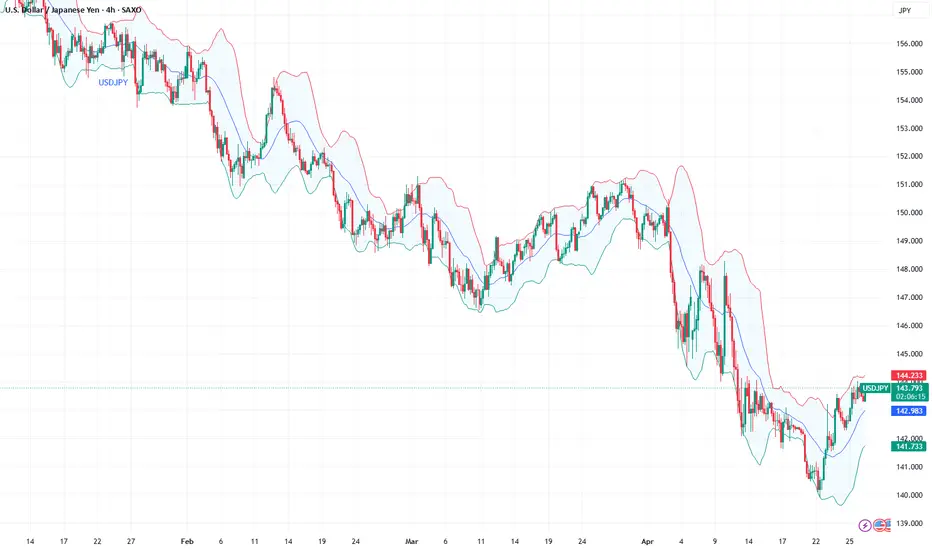
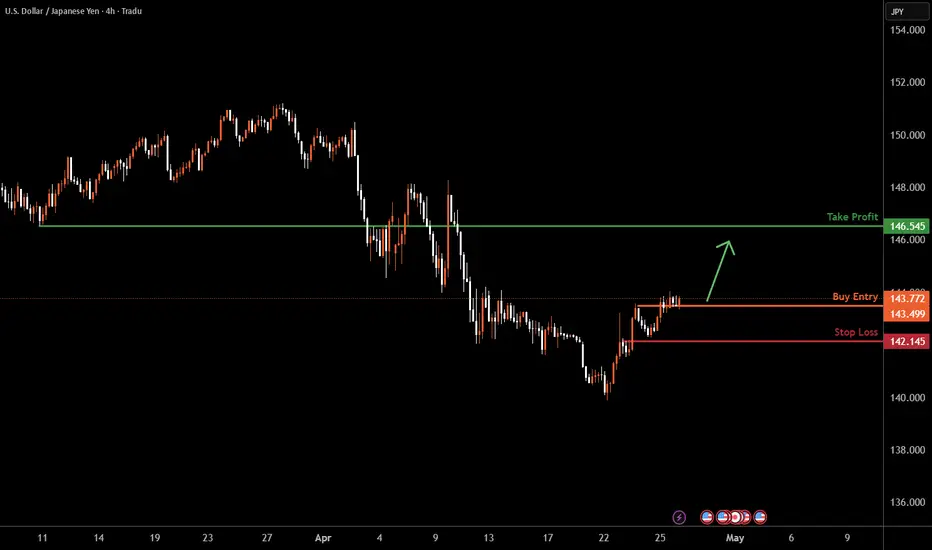
USDJPY H4 | Bullish Rise Based on the H4 chart analysis, we can see that the price has just bounced off our buy entry at 143.49, which is an overlap support.
Our take profit will be at146.54, which is a pullback resistance level.
The stop loss will be placed at 142.14, which is a pullback support level.
High Risk Investment Warning
Trading Forex/CFDs on margin carries a high level of risk and may not be suitable for all investors. Leverage can work against you.
Stratos Markets Limited (tradu.com):
CFDs are complex instruments and come with a high risk of losing money rapidly due to leverage. 63% of retail investor accounts lose money when trading CFDs with this provider. You should consider whether you understand how CFDs work and whether you can afford to take the high risk of losing your money.
Stratos Europe Ltd (tradu.com):
CFDs are complex instruments and come with a high risk of losing money rapidly due to leverage. 63% of retail investor accounts lose money when trading CFDs with this provider. You should consider whether you understand how CFDs work and whether you can afford to take the high risk of losing your money.
Stratos Global LLC (tradu.com):
Losses can exceed deposits.
Please be advised that the information presented on TradingView is provided to Tradu (‘Company’, ‘we’) by a third-party provider (‘TFA Global Pte Ltd’). Please be reminded that you are solely responsible for the trading decisions on your account. There is a very high degree of risk involved in trading. Any information and/or content is intended entirely for research, educational and informational purposes only and does not constitute investment or consultation advice or investment strategy. The information is not tailored to the investment needs of any specific person and therefore does not involve a consideration of any of the investment objectives, financial situation or needs of any viewer that may receive it. Kindly also note that past performance is not a reliable indicator of future results. Actual results may differ materially from those anticipated in forward-looking or past performance statements. We assume no liability as to the accuracy or completeness of any of the information and/or content provided herein and the Company cannot be held responsible for any omission, mistake nor for any loss or damage including without limitation to any loss of profit which may arise from reliance on any information supplied by TFA Global Pte Ltd.
The speaker(s) is neither an employee, agent nor representative of Tradu and is therefore acting independently. The opinions given are their own, constitute general market commentary, and do not constitute the opinion or advice of Tradu or any form of personal or investment advice. Tradu neither endorses nor guarantees offerings of third-party speakers, nor is Tradu responsible for the content, veracity or opinions of third-party speakers, presenters or participants.
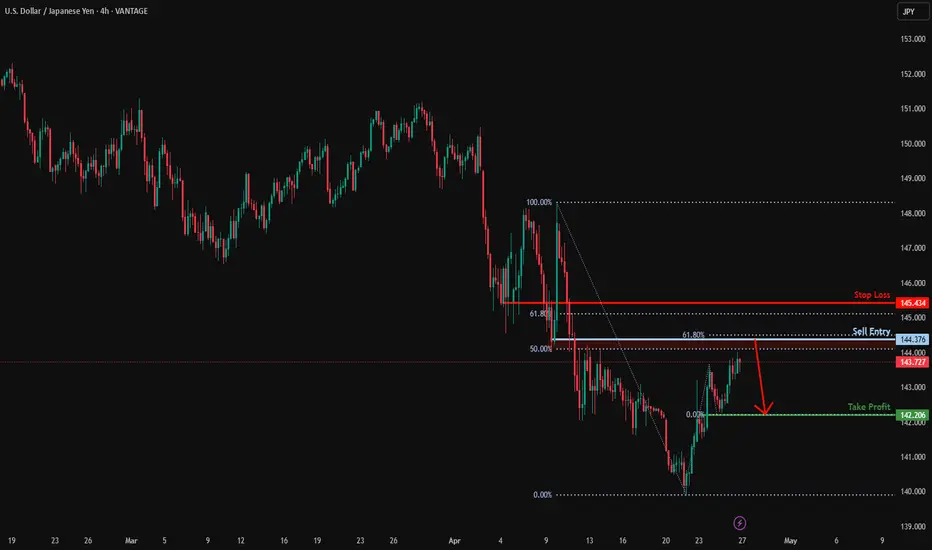
Bearish reversal?USD/JPY is rising towards the resistance level which is a pullback resistance that is slightly above the 50% Fibonacci retracement and also lines up with the 61.8% Fibonacci projection and could reverse to from this level to our take profit.
Entry: 144.37
Why we like it:
There is a pullback resistance level that lines up with the 61.8% Fibonacci projection and is also slightly above the 50% Fibonacci retracement.
Stop loss: 145.43
Why we like it:
There is a pullback resistance level that is slightly above the 61.8% Fibonacci retracement.
Take profit: 142.20
Why we like it:
There is a pullback support level.
Enjoying your TradingView experience? Review us!
Please be advised that the information presented on TradingView is provided to Vantage (‘Vantage Global Limited’, ‘we’) by a third-party provider (‘Everest Fortune Group’). Please be reminded that you are solely responsible for the trading decisions on your account. There is a very high degree of risk involved in trading. Any information and/or content is intended entirely for research, educational and informational purposes only and does not constitute investment or consultation advice or investment strategy. The information is not tailored to the investment needs of any specific person and therefore does not involve a consideration of any of the investment objectives, financial situation or needs of any viewer that may receive it. Kindly also note that past performance is not a reliable indicator of future results. Actual results may differ materially from those anticipated in forward-looking or past performance statements. We assume no liability as to the accuracy or completeness of any of the information and/or content provided herein and the Company cannot be held responsible for any omission, mistake nor for any loss or damage including without limitation to any loss of profit which may arise from reliance on any information supplied by Everest Fortune Group.