Traders, it's time to pay close attention! 🚨 USDJPY 4H Setup Alert – High-Probability Play Unfolding! 🚨
Traders, it's time to pay close attention! 🧠📊
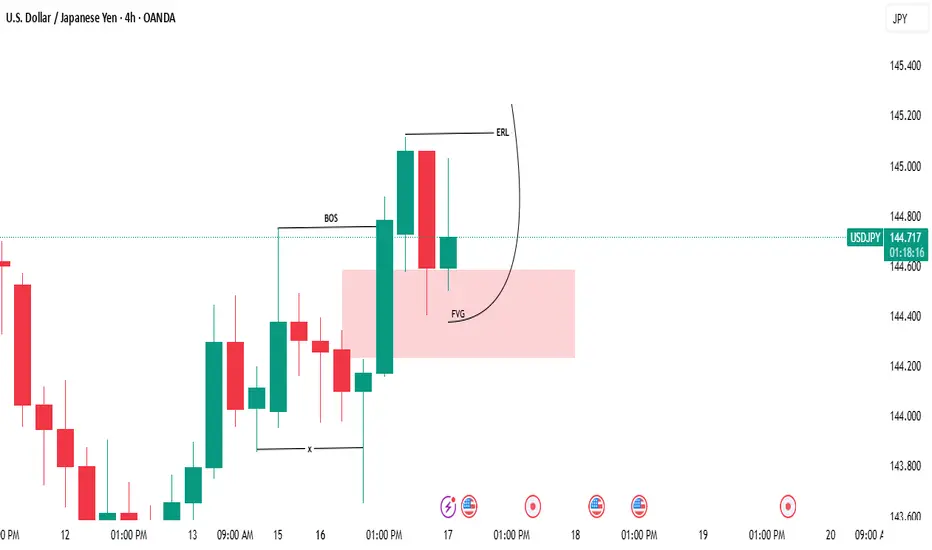
The USDJPY pair has just perfectly tapped into a key bullish Fair Value Gap (FVG) on the 4-hour chart — a classic move in the smart money playbook. What’s more? We've just seen a clean sweep of internal range liquidity (IRL) — a textbook liquidity grab that signals potential accumulation by larger players. 💥💼
This is not just noise — it's a significant signal. The market structure is hinting at a possible shift in momentum, and bullish pressure is building. The trap has been set, the weak hands have been shaken out, and smart money may be preparing for a strong upward push. 📈🐂
🔮 What’s the next move?
All eyes are now on the external range liquidity (ERL) — a prime liquidity pool sitting above current price levels. If price accelerates toward it, this zone could act as the magnet and the catalyst for the next explosive move upward. 🚀
🔥 Key Points to Watch:
Bullish FVG reaction ✅
IRL liquidity swept ✅
Bullish market structure forming 🏗️
ERL liquidity resting overhead — potential target 🎯
Volume profile & order flow confirming accumulation? 👀
⚠️ Stay alert and don’t chase — let the setup come to you.
Smart money might already be stepping in, and if this momentum follows through, we could be witnessing the beginning of a strong leg up.
Mark your charts and monitor closely — opportunity is knocking. 📍🕵️♂️
USDJPY
Fundamental Market Analysis for June 17, 2025 USDJPYThe Japanese yen (JPY) continues to experience significant pressure against the US dollar (USD), showing a three-day decline and trading above the key psychological level of 145.000. This weakening is largely due to growing market expectations that the Bank of Japan (BoJ) may delay raising rates until the first quarter of next year. The main reason for this delay is said to be the continuing uncertainty surrounding future US tariff policy, which could have a significant impact on global trade flows and Japan's economic growth. Moderate but steady growth in the US dollar is also contributing to the strengthening of the USD/JPY position, pushing the pair to new highs during the Asian trading session.
However, market participants are cautious about aggressive bearish bets against the yen ahead of the upcoming Bank of Japan monetary policy meeting. This meeting is seen as a critical event that could provide additional signals about the central bank's long-term policy outlook. Any hints of a change in tone or new assessments of the economic situation will be carefully analyzed by traders.
In addition to central bank decisions, growing geopolitical tensions in the Middle East may help limit deeper losses for the Japanese yen. As a traditional “safe haven,” the yen typically attracts investors during periods of global instability, which may offset some of the negative impact of interest rate differentials. In addition, the outlook for the USD/JPY pair is influenced by the growing recognition that the US Federal Reserve (Fed) may lower borrowing costs in 2025. Expectations of future Fed rate cuts could hinder further strengthening of the US dollar and thus limit the upside potential of the USD/JPY pair. Overall, the market remains in anticipation of key decisions that will determine the future trajectory of one of the world's most actively traded currency pairs.
Trading recommendation: SELL 144.550, SL 145.000, TP 143.600
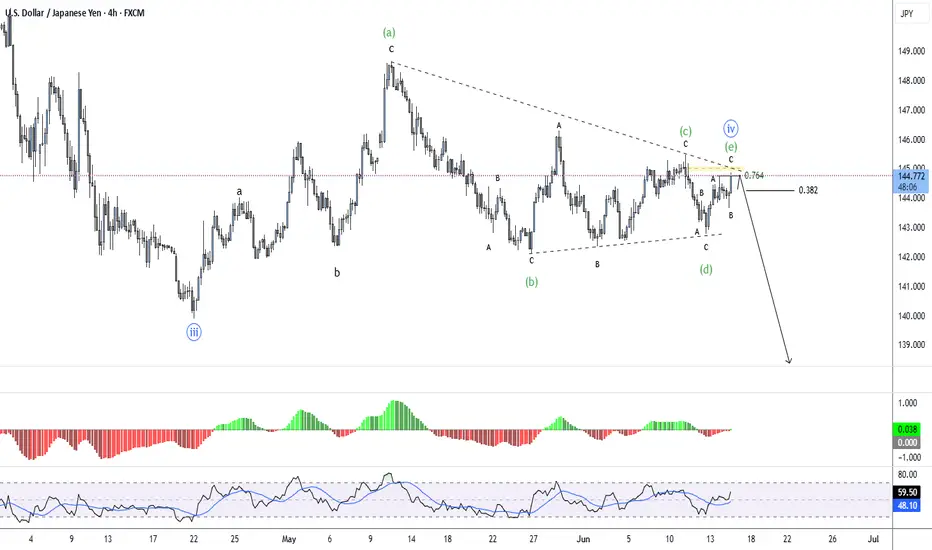
USDJPY – Triangle Complete? Wave (v) Setup BuildingWave (iv) appears to be ending with an (e) wave tag into the 0.764 retracement.
📉 Price remains capped within the contracting triangle — watching closely for breakdown confirmation.
If this plays out, wave (v) of C could now begin unfolding with initial focus on 140.00 and below.
🧩 Structure: (a)-(b)-(c)-(d)-(e) triangle complete
📏 Final wave (e) aligns with 0.764 retracement and structural resistance
⚠️ RSI divergence + weakening momentum support the bearish scenario
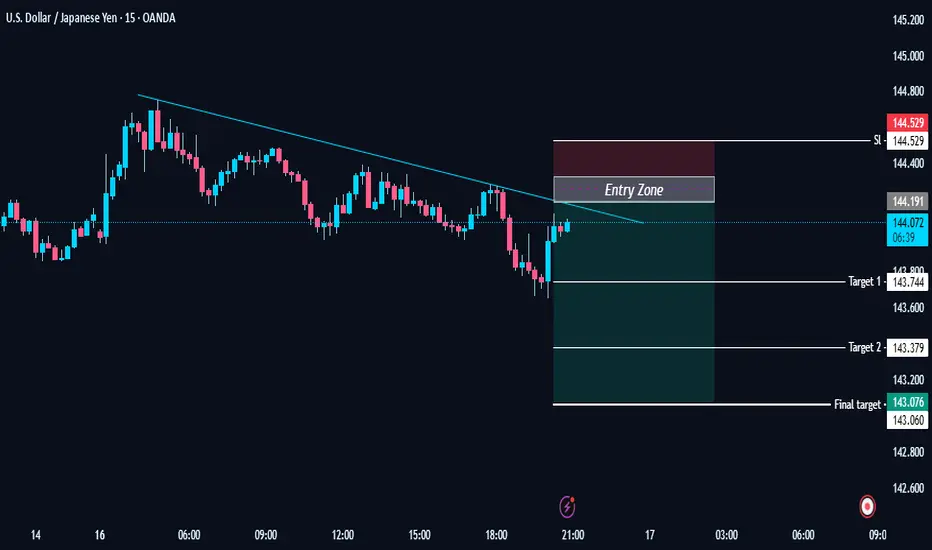
USDJPY TRADE OPPORTUNITY.This chart represents a short (sell) trade setup for USD/JPY on the 15-minute timeframe.
Chart Breakdown:
Trendline: A clear descending trendline indicates a bearish market structure.
Entry Zone: The price is expected to enter the resistance area (marked as "Entry Zone") around 144.191.
Stop Loss (SL): Placed above the resistance zone at 144.529, in case the price breaks out upward.
Target 1: 143.744 – the first level of potential profit-taking.
Target 2: 143.379 – further continuation of the bearish move.
Final Target: 143.076 – the major target if bearish momentum continues.
Idea Summary:
This setup anticipates that the price will reject the trendline and entry zone and then drop to lower support levels. It’s a classic lower high formation with trendline confluence, aiming for multiple take-profits on the way down.
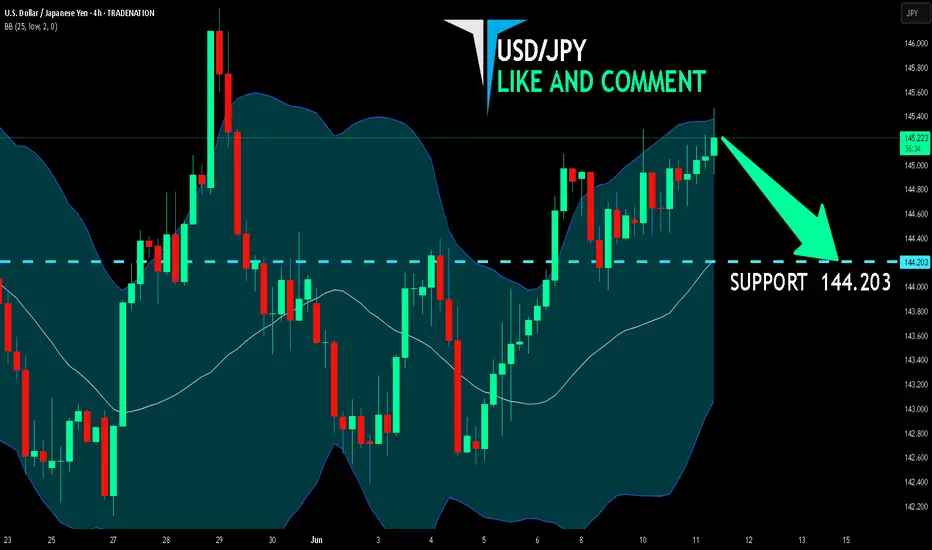
USD/JPY SELLERS WILL DOMINATE THE MARKET|SHORT
Hello, Friends!
USD-JPY uptrend evident from the last 1W green candle makes short trades more risky, but the current set-up targeting 144.203 area still presents a good opportunity for us to sell the pair because the resistance line is nearby and the BB upper band is close which indicates the overbought state of the USD/JPY pair.
Disclosure: I am part of Trade Nation's Influencer program and receive a monthly fee for using their TradingView charts in my analysis.
✅LIKE AND COMMENT MY IDEAS✅
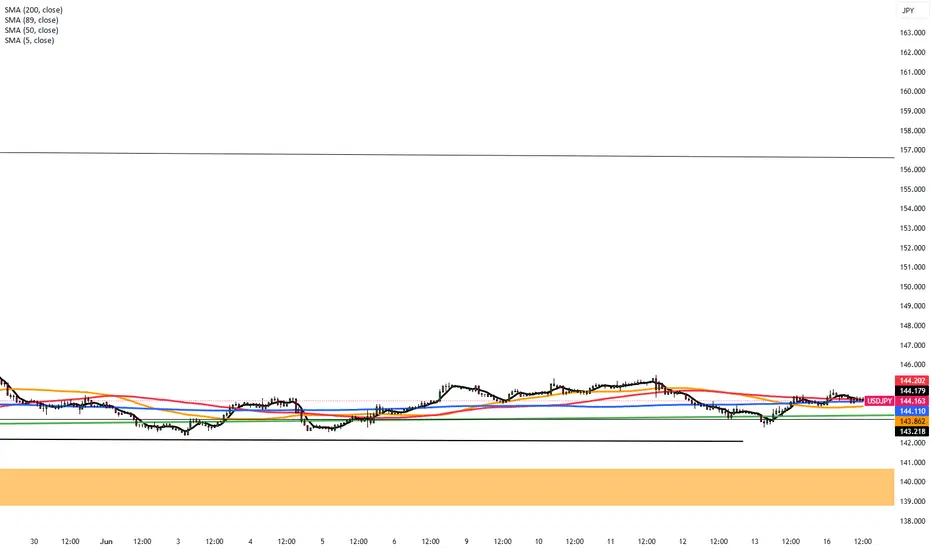
Stronger Dollar Pressures Yen on Geopolitical RisksThe Japanese yen fell past 144.2 per dollar on Monday, marking a second day of losses, as the U.S. dollar strengthened on increased safe-haven demand. This followed renewed conflict between Israel and Iran, with both sides targeting energy facilities and pushing oil prices higher. The rise in energy costs may reduce the chances of a near-term Fed rate cut as inflation and trade risks persist. Meanwhile, focus turns to the Bank of Japan’s upcoming policy meeting, where it is expected to keep rates unchanged while assessing the inflation impact of rising oil prices amid global uncertainty.
Resistance is at 145.30, while support stands near 142.50.
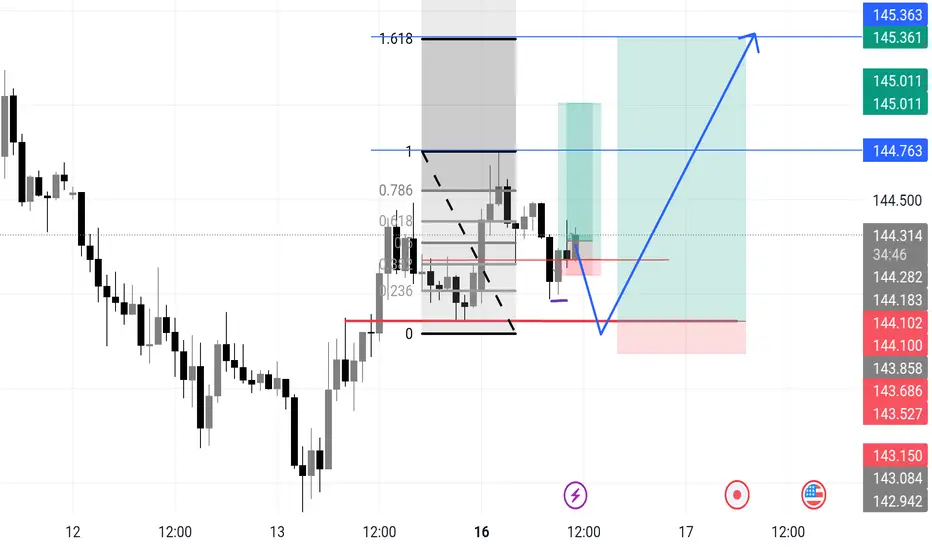
USDJPY Long potential setupWhat's going on?
USDJPY – Reload Zone Marked. If They Take Me Out, I’ll Be Waiting Lower.
Discipline means you don’t chase. You wait where the market must return.
Currently in 2 buys, one is an added position, then I moved my stop in from the purple line— but if those get wicked out, I’m hunting the next key demand zone just beneath 144.10. Where we'll have a textbook spring setup!
🧠 What I See:
We're forming a potential micro accumulation structure.
If the current position gets taken out, I’ll reload lower at the spring aligned with the prior reaction low + liquidity sweep zone.
🎯 Next Area of Interest:
Zone: 144.00 – 144.10
📌 Target Remains:
144.76 → 145.36
1.618 extension aligns with supply inefficiencies & range completion
---
> “Stop loss isn’t failure. It’s recon. The second entry — that’s where pros feast.”
I’m not trading emotion. I’m trading plan + precision + execution.
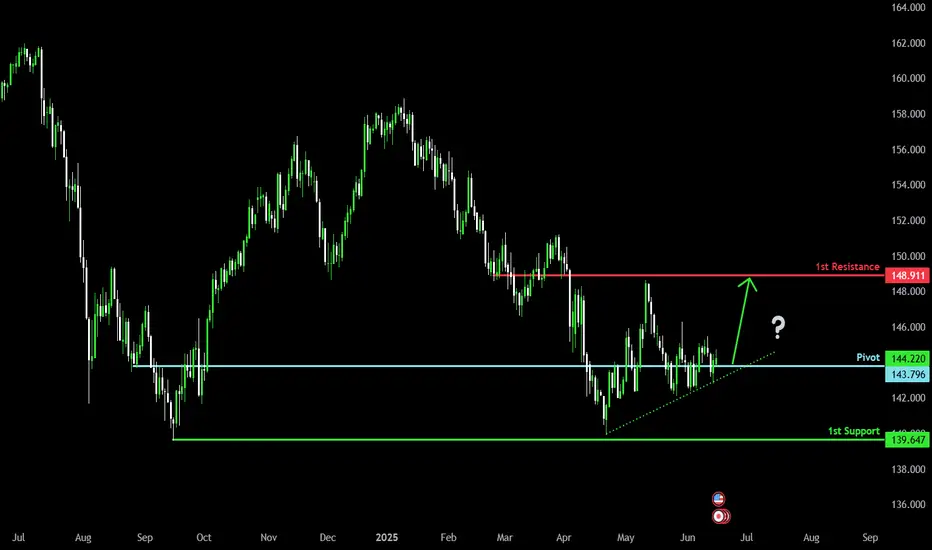
Potential bullish reversal?USD/JPY is reacting off the pivot and could rise from this level to the 1st resistance.
Pivot: 143.79
1st Support: 139.64
1st Resistance: 148.91
Risk Warning:
Trading Forex and CFDs carries a high level of risk to your capital and you should only trade with money you can afford to lose. Trading Forex and CFDs may not be suitable for all investors, so please ensure that you fully understand the risks involved and seek independent advice if necessary.
Disclaimer:
The above opinions given constitute general market commentary, and do not constitute the opinion or advice of IC Markets or any form of personal or investment advice.
Any opinions, news, research, analyses, prices, other information, or links to third-party sites contained on this website are provided on an "as-is" basis, are intended only to be informative, is not an advice nor a recommendation, nor research, or a record of our trading prices, or an offer of, or solicitation for a transaction in any financial instrument and thus should not be treated as such. The information provided does not involve any specific investment objectives, financial situation and needs of any specific person who may receive it. Please be aware, that past performance is not a reliable indicator of future performance and/or results. Past Performance or Forward-looking scenarios based upon the reasonable beliefs of the third-party provider are not a guarantee of future performance. Actual results may differ materially from those anticipated in forward-looking or past performance statements. IC Markets makes no representation or warranty and assumes no liability as to the accuracy or completeness of the information provided, nor any loss arising from any investment based on a recommendation, forecast or any information supplied by any third-party.
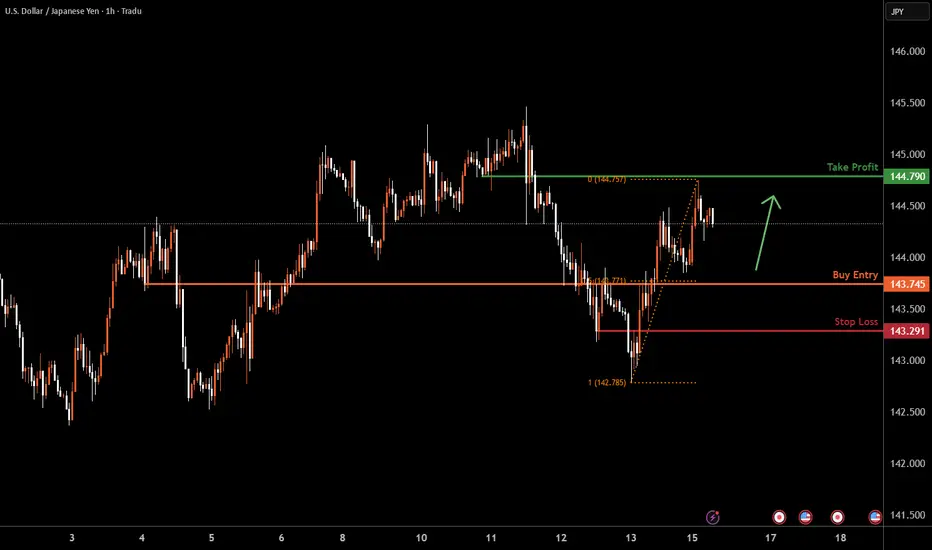
USDJPY H1 I Bullish Bounce Off the 50%Based on the H1 chart analysis, the price is falling toward our buy entry level at 143.74, a pullback support that aligns with the 50% Fibonacci retracement.
Our take profit is set at 144.79, an overlap resistance.
The stop loss is placed at 143.29, a pullback support.
High Risk Investment Warning
Trading Forex/CFDs on margin carries a high level of risk and may not be suitable for all investors. Leverage can work against you.
Stratos Markets Limited (tradu.com ):
CFDs are complex instruments and come with a high risk of losing money rapidly due to leverage. 63% of retail investor accounts lose money when trading CFDs with this provider. You should consider whether you understand how CFDs work and whether you can afford to take the high risk of losing your money.
Stratos Europe Ltd (tradu.com ):
CFDs are complex instruments and come with a high risk of losing money rapidly due to leverage. 63% of retail investor accounts lose money when trading CFDs with this provider. You should consider whether you understand how CFDs work and whether you can afford to take the high risk of losing your money.
Stratos Global LLC (tradu.com ):
Losses can exceed deposits.
Please be advised that the information presented on TradingView is provided to Tradu (‘Company’, ‘we’) by a third-party provider (‘TFA Global Pte Ltd’). Please be reminded that you are solely responsible for the trading decisions on your account. There is a very high degree of risk involved in trading. Any information and/or content is intended entirely for research, educational and informational purposes only and does not constitute investment or consultation advice or investment strategy. The information is not tailored to the investment needs of any specific person and therefore does not involve a consideration of any of the investment objectives, financial situation or needs of any viewer that may receive it. Kindly also note that past performance is not a reliable indicator of future results. Actual results may differ materially from those anticipated in forward-looking or past performance statements. We assume no liability as to the accuracy or completeness of any of the information and/or content provided herein and the Company cannot be held responsible for any omission, mistake nor for any loss or damage including without limitation to any loss of profit which may arise from reliance on any information supplied by TFA Global Pte Ltd.
The speaker(s) is neither an employee, agent nor representative of Tradu and is therefore acting independently. The opinions given are their own, constitute general market commentary, and do not constitute the opinion or advice of Tradu or any form of personal or investment advice. Tradu neither endorses nor guarantees offerings of third-party speakers, nor is Tradu responsible for the content, veracity or opinions of third-party speakers, presenters or participants.
Still keeping a close eye on a potential USD pop...Although the EUR/USD and GBP/USD popped higher late last week, I'm still keeping a close eye to stay short on the EUR/USD considering the bearish rising broadening pattern coupled with a yearly pivot point inter-median level and negative divergence on the MACD. This is all based on the daily chart.
Many factors are in play right now with what's going on between Israel and Iran along with FOMC this week and Tariffs still in play.
On a purely technical analysis point of view, I potentially expect a bullish retracement in the USD while remaining long term bearish across the board.
we'll see how this one develops.
Good Luck & Trade Safe.

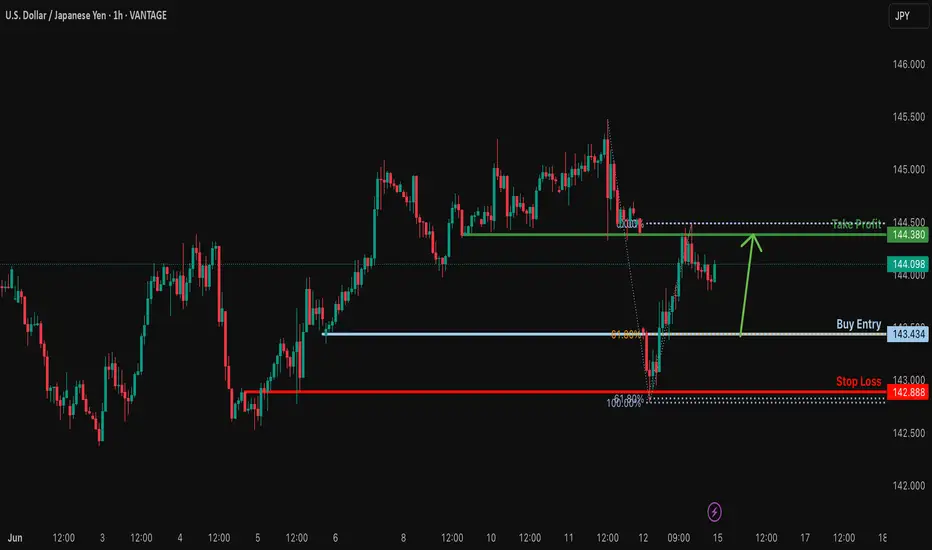
Bullish bounce off 61.8% Fibonacci support?USD/JPY is falling towards the support level which is a pullback support that aligns with the 61.8% Fibonacci retracement and could bounce from this level to our take profit.
Entry: 143.43
Why we like it:
There is a pullback support level that aligns with the 61.8% Fibonacci retracement.
Stop loss: 142.88
Why we like it
There is a pullback support level that lines up with the 61.8% Fibonacci projection.
Take profit: 144.38
Why we like it:
There is an overlap resistance level.
Enjoying your TradingView experience? Review us!
Please be advised that the information presented on TradingView is provided to Vantage (‘Vantage Global Limited’, ‘we’) by a third-party provider (‘Everest Fortune Group’). Please be reminded that you are solely responsible for the trading decisions on your account. There is a very high degree of risk involved in trading. Any information and/or content is intended entirely for research, educational and informational purposes only and does not constitute investment or consultation advice or investment strategy. The information is not tailored to the investment needs of any specific person and therefore does not involve a consideration of any of the investment objectives, financial situation or needs of any viewer that may receive it. Kindly also note that past performance is not a reliable indicator of future results. Actual results may differ materially from those anticipated in forward-looking or past performance statements. We assume no liability as to the accuracy or completeness of any of the information and/or content provided herein and the Company cannot be held responsible for any omission, mistake nor for any loss or damage including without limitation to any loss of profit which may arise from reliance on any information supplied by Everest Fortune Group.
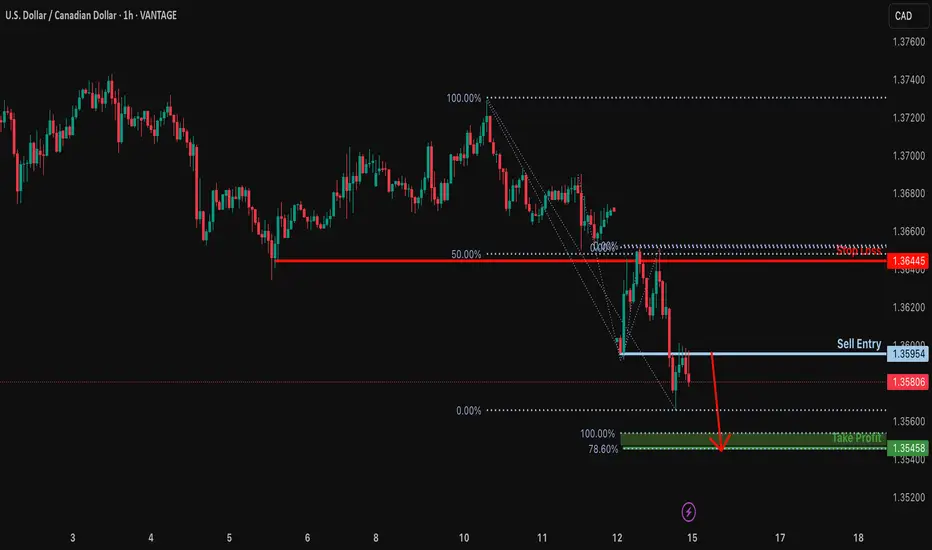
Bearish continuation?USD/CAD has rejected off the resistance level which is a pullback resistance and could drop from this level to our take profit.
Entry: 1.3595
Why we like it:
There is a pullback resistance level.
Stop loss: 1.3644
Why we like it:
There is an overlap resistance level that aligns with the 50% Fibonacci retracement.
Take profit: 1.3545
Why we like it:
There is a support level at the 100% and the 78.6% Fibonacci projection.
Enjoying your TradingView experience? Review us!
Please be advised that the information presented on TradingView is provided to Vantage (‘Vantage Global Limited’, ‘we’) by a third-party provider (‘Everest Fortune Group’). Please be reminded that you are solely responsible for the trading decisions on your account. There is a very high degree of risk involved in trading. Any information and/or content is intended entirely for research, educational and informational purposes only and does not constitute investment or consultation advice or investment strategy. The information is not tailored to the investment needs of any specific person and therefore does not involve a consideration of any of the investment objectives, financial situation or needs of any viewer that may receive it. Kindly also note that past performance is not a reliable indicator of future results. Actual results may differ materially from those anticipated in forward-looking or past performance statements. We assume no liability as to the accuracy or completeness of any of the information and/or content provided herein and the Company cannot be held responsible for any omission, mistake nor for any loss or damage including without limitation to any loss of profit which may arise from reliance on any information supplied by Everest Fortune Group.
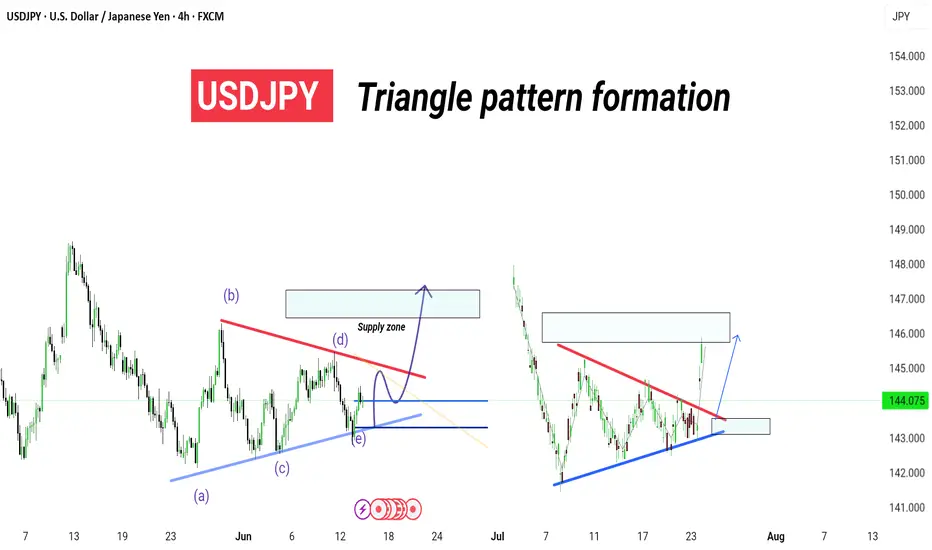
USDJPY – 4H . [[ TRIANGLE PATTERN ]]Technical Breakdown:
Symmetrical triangle pattern clearly formed with clean ABCDE wave structure.
The price has broken out from the upper resistance (trendline), confirming a bullish breakout scenario.
Next key area to watch is the supply zone near 145.800 – 146.200, where price may either:
Face resistance and retrace,
Or break through for continuation.
---
🔍 Key Levels:
Support Base (Retest zone): ~143.000
Breakout Entry Trigger: Above 144.200
Supply Zone Target: 145.800 – 146.200
Invalidation Level (Break Below Triangle): <142.500
---
🧠 Analysis Insight:
This is a classic triangle consolidation breakout, with price respecting both ascending and descending boundaries before thrusting upward.
Look for possible pullback retest entries before continuation to the supply zone.
Volume and momentum confirmation on breakout is key for sustainability.
---
🎯 Strategy Note:
Use low-risk entry setups on breakout retest.
Ideal for scalp to swing trades, with strong risk-reward structure.
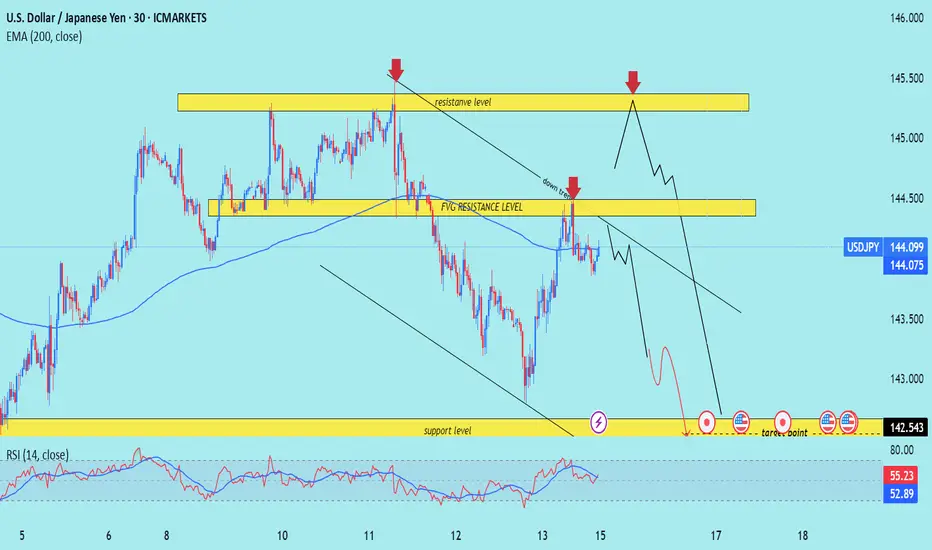
USD/JPY) Bearish trend analysis Read The ChaptianSMC trading point update
Technical analysis iUSD/JPY on the 30-minute timeframe, showing a rejection from resistance zones and a potential move toward lower support levels.
---
Analysis Breakdown
Technical Components:
1. Resistance Zones:
Primary Resistance: Near 145.500 (upper yellow box), which has previously been rejected multiple times (red arrows).
FVG (Fair Value Gap) Resistance Level: Around 144.400, also acting as strong resistance, especially near the EMA 200.
2. Downtrend Line:
The price is moving below a downward trendline, respecting bearish structure.
Last rejection from both the trendline and FVG zone confirms selling pressure.
3. EMA 200 (144.075):
Price is hovering around this level, showing indecision.
Bearish bias remains unless price breaks and holds above it.
4. Target Zone:
A clearly marked support level around 142.543, shown as the bearish target.
Includes multiple event markers (potential news catalysts or key dates), suggesting added volatility.
5. RSI (14):
Currently near 55.23, with a prior rejection from higher RSI levels.
Bearish divergence not clear, but no overbought conditions.
---
Bearish Idea Summary:
Thesis: Rejection from resistance zones + trendline + EMA suggests continuation to downside.
Expecting: Price to either:
Retest the upper resistance zone (around 145.000–145.500) and reject again, or
Break below current levels and continue lower toward 142.543.
---
Trade Idea Concept:
Entry Option 1: Sell on confirmed rejection from FVG zone or upper resistance.
Entry Option 2: Sell on break and retest below 144.000.
Target: 142.543 (support zone).
Stop Loss: Above the resistance zone or trendline (e.g., >145.600).
Mr SMC Trading point
Risks to Watch:
Invalidation: Clean break and close above 145.500 would invalidate the bearish setup.
News Impact: Note the icons near the target zone – monitor economic releases around that time.
---
Please support boost 🚀 this analysis)
USDJPY Trading RangeUSDJPY saw some corrections late on Friday. Overall, the pair remains sideways in a wide range of 143,000-145,100 and has yet to establish a clear continuation trend.
The wider band in the sideways trend is extended at 146,000 and 142,000.
The trading strategy will be based on the band that is touched.
Pay attention to the breakout as it may continue the strong trend and avoid trading against the trend when breaking.
Support: 143,000, 142,000
Resistance: 145,000, 146,000

Nasdaq Oro EurUsd UsdJpyPost analysis of the entries this Friday, market compress the week and today gave us the respite to have a good weekend

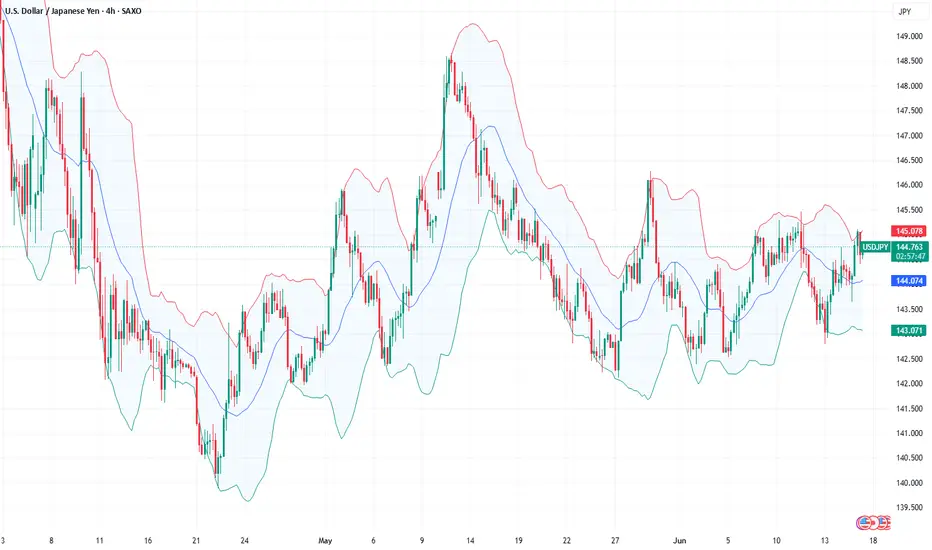
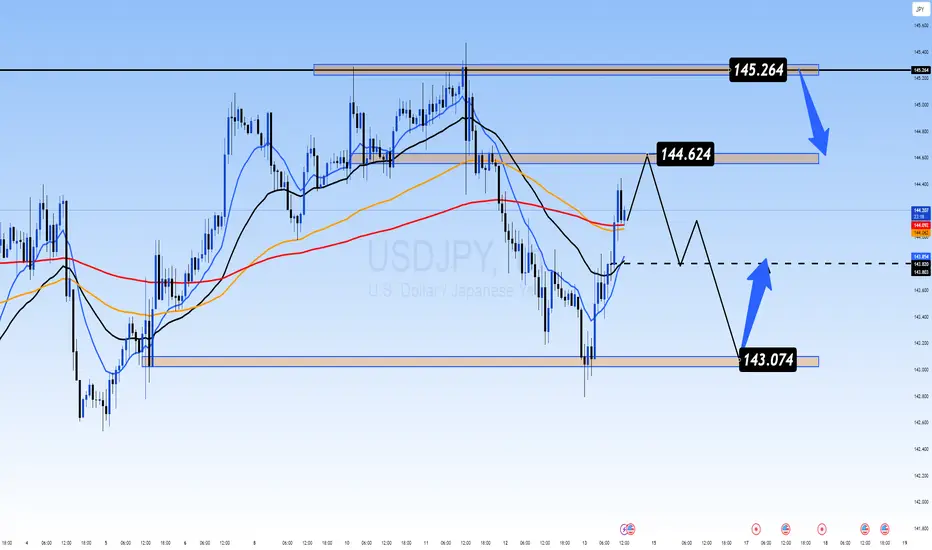
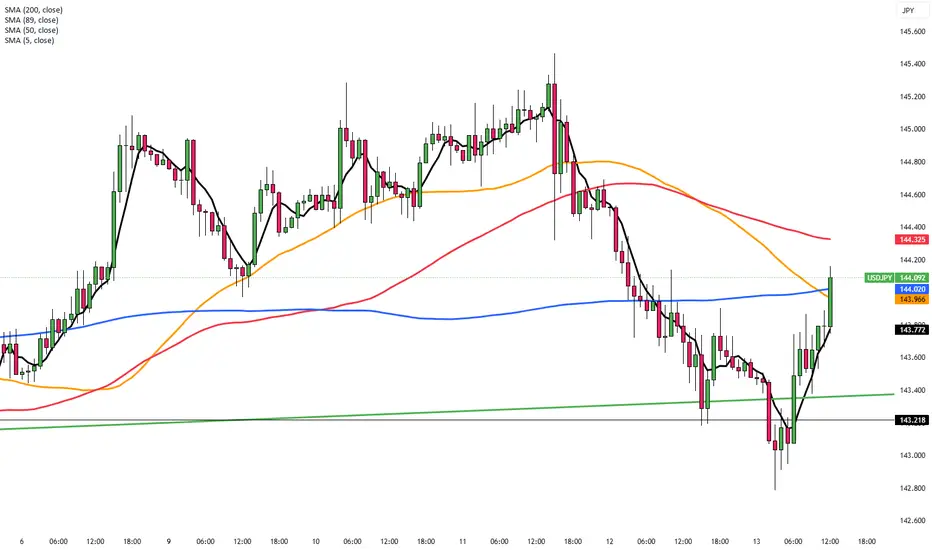
Dollar Momentum Fades | Can 143.07 Hold as Support?USDJPY – Dollar Momentum Fades | Can 143.07 Hold as Support?
🌍 Fundamental & Macro Outlook
USDJPY has faced strong downside pressure recently as risk-off sentiment boosts demand for the Japanese Yen, following escalating tensions between Israel and Iran.
The US Dollar Index (DXY) rallied on geopolitical concerns but is struggling to sustain momentum near the 98.30 resistance zone.
Despite the Bank of Japan's ultra-loose monetary policy, JPY is acting as a safe haven in current global risk conditions.
Traders are awaiting next week’s monetary policy decisions from both the Federal Reserve and the Bank of Japan. Both central banks are expected to keep rates unchanged, but forward guidance could spark major volatility.
According to UOB Group, the dollar's recovery potential is weakening, and further downside toward 142.20 is possible, unless price reclaims the 144.60–144.95 resistance zone.
📉 Technical Analysis – H1 Chart
🔸 Trend Structure
USDJPY remains in a mild downtrend, but price has bounced from the 143.074 key support zone.
A recovery towards 144.624 is in play, but that zone must be cleared for bullish continuation.
🔸 EMA Outlook
Price is currently testing the EMA 89 and 200 — a rejection from this area could trigger another move down.
EMA 13 & 34 are now acting as short-term dynamic support.
🔸 Key Price Zones
Resistance: 144.60 – 145.26
Support: 143.07 – 142.20
🧠 Market Sentiment
Risk aversion continues to dominate as geopolitical headlines drive sentiment.
The Yen is benefitting from capital protection flows despite Japan’s dovish stance.
Large funds may be starting to hedge by rotating into JPY from elevated USD levels.
🎯 Trading Scenarios for June 13
📌 Scenario 1 – Short Setup (Rejection at Resistance)
Entry: 144.60 – 144.90
Stop-Loss: 145.30
Take-Profit: 143.60 → 143.07 → 142.50
📌 Scenario 2 – Long Setup (Rebound from Support)
Entry: 143.10 – 143.20
Stop-Loss: 142.70
Take-Profit: 144.00 → 144.60
✅ Wait for confirmation at key levels — avoid trading in the middle of the range when volatility is headline-driven.
✅ Conclusion
USDJPY remains trapped between strong resistance at 145.26 and buying interest at 143.07. If risk sentiment persists, the Yen may continue to strengthen. However, central bank decisions next week (Fed & BoJ) will be the major catalysts for any medium-term breakout.
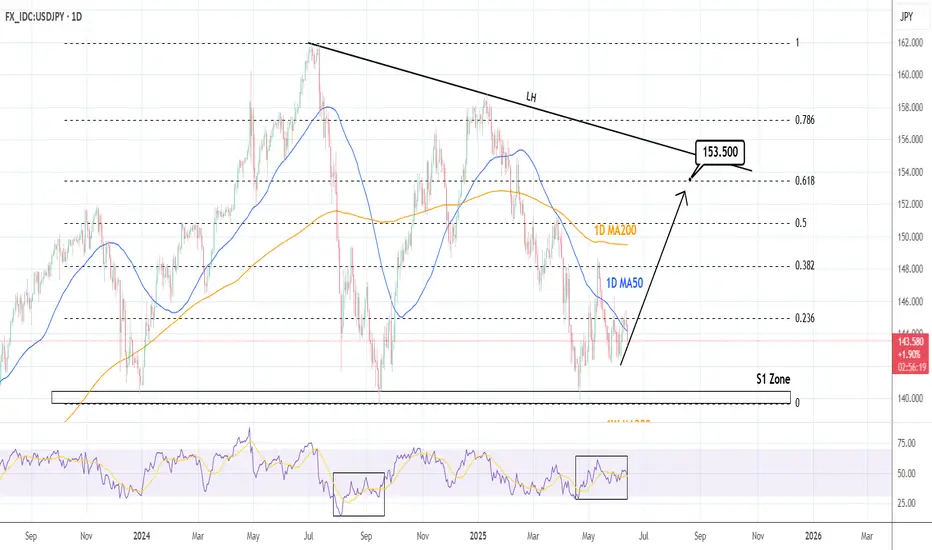
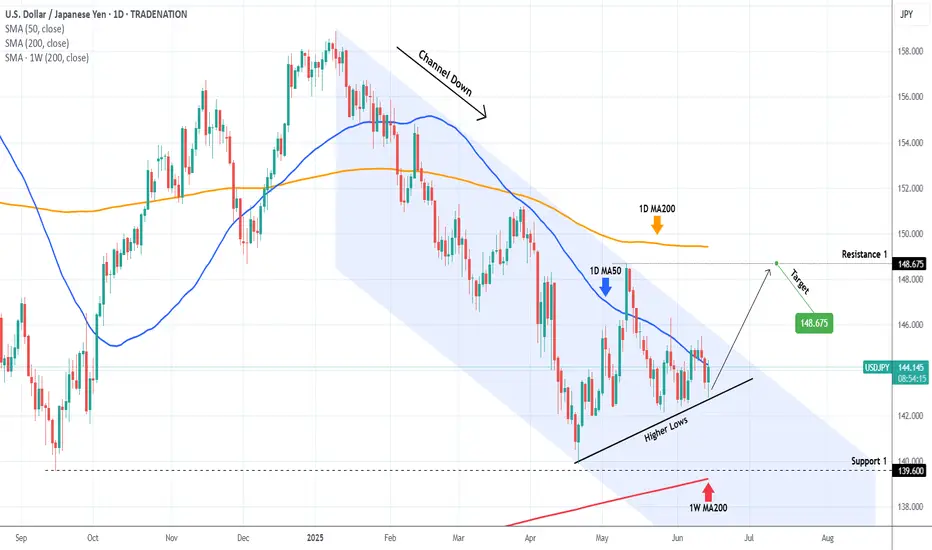
USDJPY Strong support formed. Excellent buy opportunity.The USDJPY pair is trading within a Channel Down since the start of the year but following the April 22 Low, it has been rising on Higher Lows. Today that trend-line was tested and again produced a rebound (so far).
Since the April 22 Low was very close to the 139.600 Support (from the September 16 2024 Low), there are higher probabilities that we will have a trend change to bullish, at least for the medium-term.
The natural Resistance now is the 1D MA200 (orange trend-line), so we will target just below it at 148.675 (Resistance 1).
-------------------------------------------------------------------------------
** Please LIKE 👍, FOLLOW ✅, SHARE 🙌 and COMMENT ✍ if you enjoy this idea! Also share your ideas and charts in the comments section below! This is best way to keep it relevant, support us, keep the content here free and allow the idea to reach as many people as possible. **
-------------------------------------------------------------------------------
Disclosure: I am part of Trade Nation's Influencer program and receive a monthly fee for using their TradingView charts in my analysis.
💸💸💸💸💸💸
👇 👇 👇 👇 👇 👇
Yen Rallies as Risk Aversion ReturnsThe Japanese yen strengthened to approximately 143 per dollar, marking a third consecutive day of gains as investors turned to safe-haven assets following Israel’s preemptive strike on Iran. The operation, aimed at nuclear facilities, heightened global risk aversion. Adding to market uncertainty were renewed U.S. tariff threats by Trump. Meanwhile, BoJ Governor Ueda reiterated the bank’s readiness to raise interest rates if inflation nears the 2% target.
Resistance is at 145.30, while support stands near 142.50.
Potential bearish drop?USD/JPY is rising towards the resistance level which is a pullback resistance that aligns with the 38.2% Fibonacci retracement and could drop from this level to ur take profit.
Entry: 144.11
Why we like it:
There is a pullback resistance level that lines up with the 38.2% Fibonacci retracement.
Stop loss: 145.07
Why we like it:
There is a pullback resistance level that lines up with the 78.6% Fibonacci retracement.
Take profit: 142.00
Why we like it:
There is a pullback support level that is slightly below the 78.6% Fibonacci projection.
Enjoying your TradingView experience? Review us!
Please be advised that the information presented on TradingView is provided to Vantage (‘Vantage Global Limited’, ‘we’) by a third-party provider (‘Everest Fortune Group’). Please be reminded that you are solely responsible for the trading decisions on your account. There is a very high degree of risk involved in trading. Any information and/or content is intended entirely for research, educational and informational purposes only and does not constitute investment or consultation advice or investment strategy. The information is not tailored to the investment needs of any specific person and therefore does not involve a consideration of any of the investment objectives, financial situation or needs of any viewer that may receive it. Kindly also note that past performance is not a reliable indicator of future results. Actual results may differ materially from those anticipated in forward-looking or past performance statements. We assume no liability as to the accuracy or completeness of any of the information and/or content provided herein and the Company cannot be held responsible for any omission, mistake nor for any loss or damage including without limitation to any loss of profit which may arise from reliance on any information supplied by Everest Fortune Group.

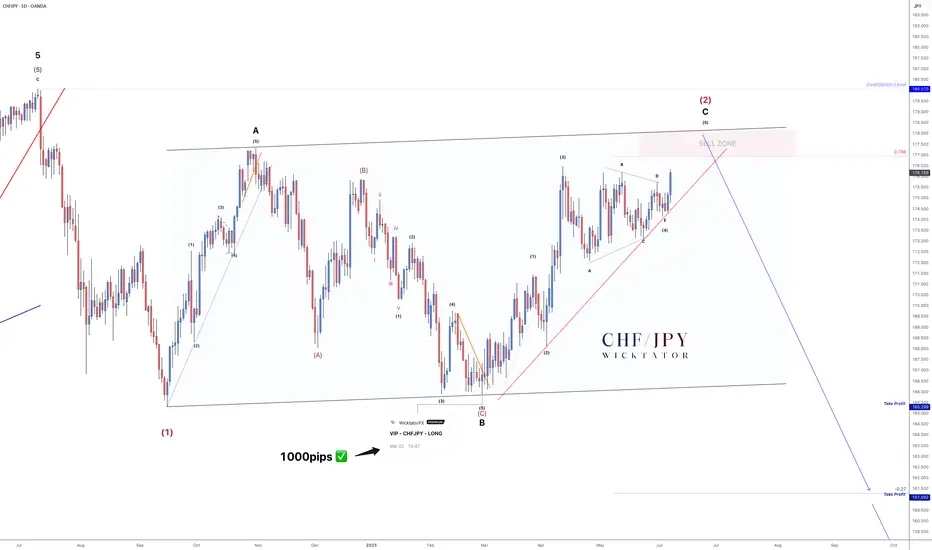
CHFJPY - How To Enter This MASSIVE 1700pip Swing Trade!As promised - here’s the lower timeframe breakdown after hitting 100+ likes.
We’re in wave 5, currently moving cleanly into the swing zone. Since wave 5 typically forms 5 subwaves, all we needed was to connect points 2 and 4 to draw our entry trendline.
Trade Idea:
- Entry on break of the orange trendline
- Stops above recent highs after entry
- Aggressive option: Enter inside the sell zone with stops above invalidation
Targets:
- TP1: 165.00 (≈1300 pips)
- TP2: 161.50 (≈1700 pips)
- Optional: Leave a runner for the longer swing move
Scroll down for the full 4H breakdown.
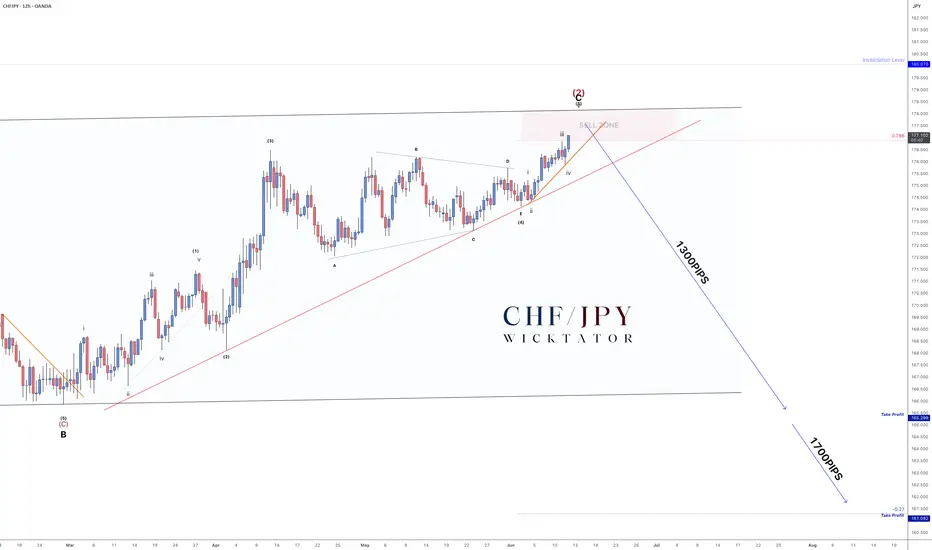
CHFJPY - 1700 Pip Reversal Incoming!The last time we looked at CHFJPY was back in October 2024, where we forecasted a large ABC correction. Fast forward to now - that correction is nearly complete!
We're currently in the 5th subwave of wave C, and everything points toward a massive drop setting up. We expect a move of at least 1500 pips.
On the Daily timeframe, structure is clear:
- Clean 5-3-5 ABC correction
- Price is approaching a key sell zone
- A clear entry trendline is in place — couldn’t ask for a cleaner setup
Trade Idea:
- Watch for rejection within the sell zone
- Aggressive entry: Inside sell zone with stops above invalidation
- Conservative entry: On break of trendline, stops above the break candle
Targets:
TP1: 165.00 (≈1300 pips)
TP2: 161.50 (≈1700 pips)
Optional: Leave a runner for a long-term swing
Let me know what you think in the comments.
See below for our last VIP setup for CHFJPY which played out perfectly. 1000pips secured!
Good luck and as always, trade safe!
USDJPY: Bottom formation successful. Strong buy.USDJPY is neutral on its 1D technical outlook (RSI = 46.191, MACD = -0.020, ADX = 12.744) as it is consolidating around the 1D MA50. This is the bottom formation process straight after rebounding on the S1 Zone. The wider pattern is a Descending Triangle and the bottom formation suggests that the new bullish wave is about to be initiated. Go long and target the 0.618 Fibonacci level (TP = 153.500).
## If you like our free content follow our profile to get more daily ideas. ##
## Comments and likes are greatly appreciated. ##