DeGRAM | USDJPY Reached the Lower Channel Boundary📊 Technical Analysis
Descending channel
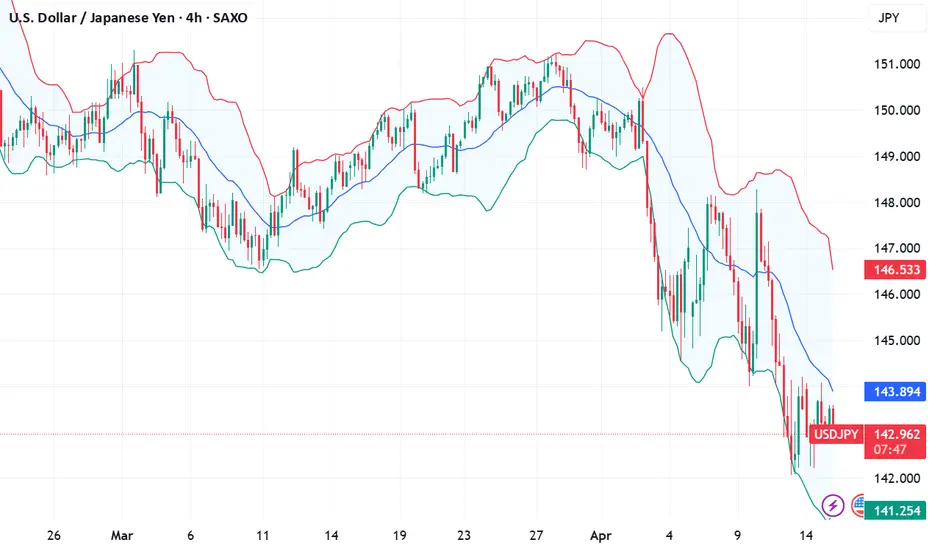
USD/JPY is trading within a downward channel, recently bouncing off support near 142.00.
Key resistance
The upper boundary near 146 serves as key resistance; a breakout would indicate a trend reversal.
Predictive scenario
Price may retest resistance with potential for further upside if bullish momentum holds.
💡 Fundamental Analysis
The Fed maintains high rates, while the BoJ remains dovish. The yield gap favors USD strength. Steady US data supports recovery, while global risks may limit JPY demand.
✨ Summary
A bounce from support within the channel aligns with USD-positive fundamentals. Watch 146 for a breakout signal.
-------------------
Share your opinion in the comments and support the idea with like. Thanks for your support!
USDJPY
USDCAD and USDJPY Analysis todayHello traders, this is a complete multiple timeframe analysis of this pair. We see could find significant trading opportunities as per analysis upon price action confirmation we may take this trade. Smash the like button if you find value in this analysis and drop a comment if you have any questions or let me know which pair to cover in my next analysis.

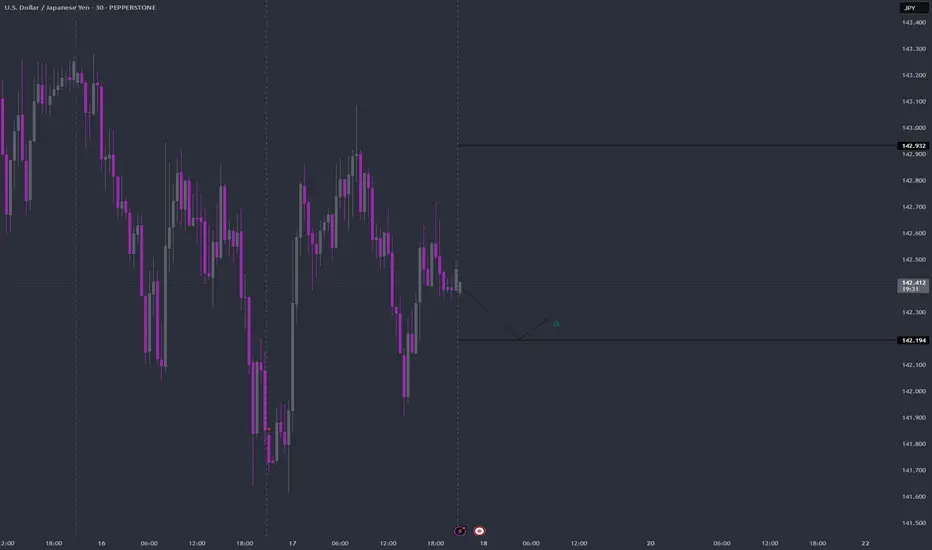
18-04-25 USDJPY Pivot LevelSimple and yet effective. Price did retrace from upper pivot level yesterday.
Today the upper trend should continue with bounce off lower pivot of 142.194, though most banks are on holiday
Fundamental Market Analysis for April 18, 2025 USDJPYThe USD/JPY pair is down to 142.25 in thin trading session on Friday. The US Dollar (USD) is declining against the Japanese Yen (JPY) amid concerns over the economic impact of tariffs.
Data released by the Statistics Bureau of Japan on Friday showed that the national consumer price index (CPI) rose 3.6% in March, up from the previous reading of 3.7%. Meanwhile, the national CPI excluding fresh food was 3.2% y/y in March, up from 3.0% previously. The reading was in line with the market consensus.
Finally, the consumer price index excluding fresh food and energy rose 2.9% y/y in March vs. the previous reading of 2.6%. The Japanese Yen remains strong against the US Dollar as an immediate reaction to Japanese inflation data.
However, JPY gains may be limited as Bank of Japan (BoJ) officials signalled a pause in the consideration of interest rate hikes, emphasising the need to monitor uncertainty heightened by US tariff measures.
Economic data from the US on Thursday was mixed. US initial jobless claims fell to their lowest level in two months, signalling a stable labour market. In addition, the Philadelphia Fed index fell short of expectations, a warning shot from the manufacturing sector.
Trade recommendation: SELL 142.05, SL 143.40, TP 139.80
6J1!: Yen Steady as Dollar Recovers: Reversal WatchThe Japanese Yen maintains its strength in relation to the recovering US Dollar. However, recent improvements in global risk sentiment are beginning to weaken the JPY's appeal as a safe-haven currency. At this point, the Yen is positioned within a significant supply zone, where we are closely monitoring for potential reversal opportunities.
According to the latest COT report, retailers are predominantly holding long positions, which adds an interesting dynamic to the current market environment. As we evaluate the situation, our focus is on the possibility of a reversal, especially as the US Dollar shows signs of regaining momentum. This scenario could lead to notable shifts in currency dynamics, and we are keen to see how these factors will unfold in the near term.
✅ Please share your thoughts about 6J1! in the comments section below and HIT LIKE if you appreciate my analysis. Don't forget to FOLLOW ME; you will help us a lot with this small contribution.

Dollar-Yen Compression Coil: A Breakout is Brewing🧠 Why This Matters Right Now
USD/JPY has been tightly range-bound for the past 7 sessions, hugging the underside of 154.50, a historically significant resistance level. With U.S. inflation coming in hotter than expected and the Bank of Japan stepping back from policy tightening, this tug-of-war has compressed price action into a tight coil. A volatility eruption is right around the corner.
🔍 Breakdown of the Strategy
This is a volatility compression breakout setup based on the logic that low volatility precedes expansion. The ingredients:
Bollinger Bands (20, 2) for detecting squeeze zones
ADX (14) under 15 to confirm low trend strength
Price range compressing within 0.5%
Entry Logic:
📈 Long: Close above upper Bollinger Band + ADX > 20
📉 Short: Close below lower Bollinger Band + ADX > 20
Stops & Targets:
Stop Loss: Just inside the opposite Bollinger Band
Take Profit: 2× ATR(14)
🚀 Why This Works in Today’s Market
The policy divergence between the U.S. and Japan is creating a classic fundamental standoff, but the price can't stay neutral for long. Volatility is compressed to its limits. When the breakout comes, it's likely to run fast and clean in the direction of the imbalance.
🤖 Automate It with PineScriptAI
With PineScriptAI, you can instantly:
Detect when Bollinger Band width narrows
Monitor ADX thresholds
Set up conditional breakout logic with smart alerts and backtests
Create a dual-trigger script that catches either direction — no need to guess the breakout side.
⚡ From Trend to Code — Instantly
This isn’t just a chart pattern — it’s a recurring market phenomenon. With PineScriptAI, you can adapt this same logic to GBP/JPY, EUR/JPY, or even gold compressions with zero manual tweaking.
🧭 Final Insight FX:USDJPY
When price coils, energy builds. Don’t just watch it break — code it, trade it, and scale it across markets with PineScriptAI.

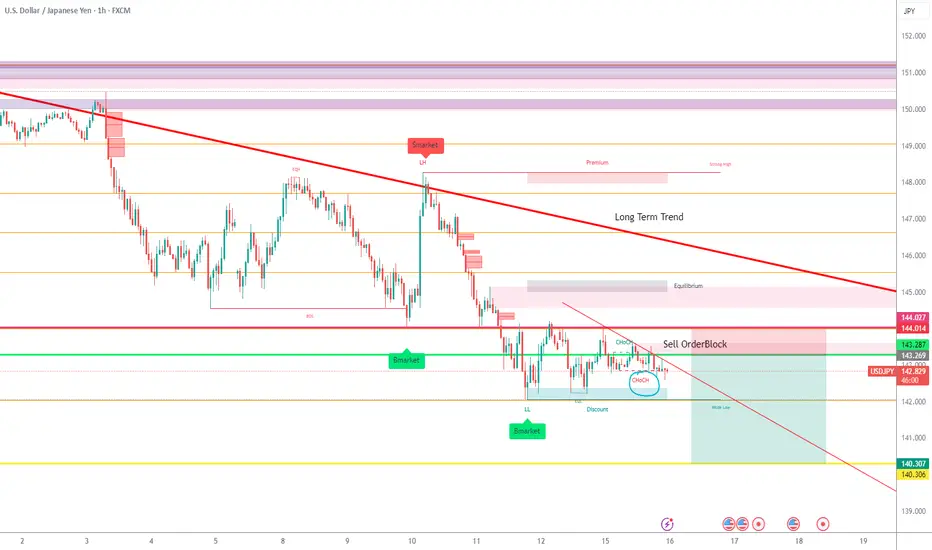
USD/JPY) demand and supply analysis ); Read The ChaptianSMC Trading point update
shows a bearish setup for USD/JPY on the 1-hour timeframe. Here’s a breakdown
---
1. Trend Context:
Downtrend: The pair is clearly in a bearish channel, forming lower highs and lower lows.
200 EMA (~146.297) is above price and sloping down — confirms bearish bias.
---
2. Key Zones Identified:
Supply Zone (~144.800–145.200): A strong area of resistance where sellers may re-enter. If price returns here, it’s a potential short setup.
Demand Zone (~142.800–143.100): A possible reaction point where short-term buyers may provide a bounce.
Target Point (~141.168): A projected target if the downtrend continues and demand zone fails.
---
3. Expected Scenarios:
Primary Bearish Move:
Price may react from current levels or from the demand zone.
A pullback to the supply zone is expected before continuation downward.
Then, sell-off toward the target zone around 141.168.
Alternate Play:
Price could bounce between the demand and supply zones a bit more before breaking down.
---
4. Indicators:
RSI (~46.37): Shows room to the downside before oversold, aligning with bearish momentum.
Mild bullish divergence in RSI recently, suggesting potential for a small pullback or bounce.
Mr SMC Trading point
---
Summary of Idea:
This is a sell setup:
Sell entries: Ideal around the supply zone (144.8–145.2).
First target: Demand zone (~143.0)
Final target: 141.168
Invalidation: Break above 146.30 (200 EMA and channel resistance).
pales support boost 🚀 analysis follow,)

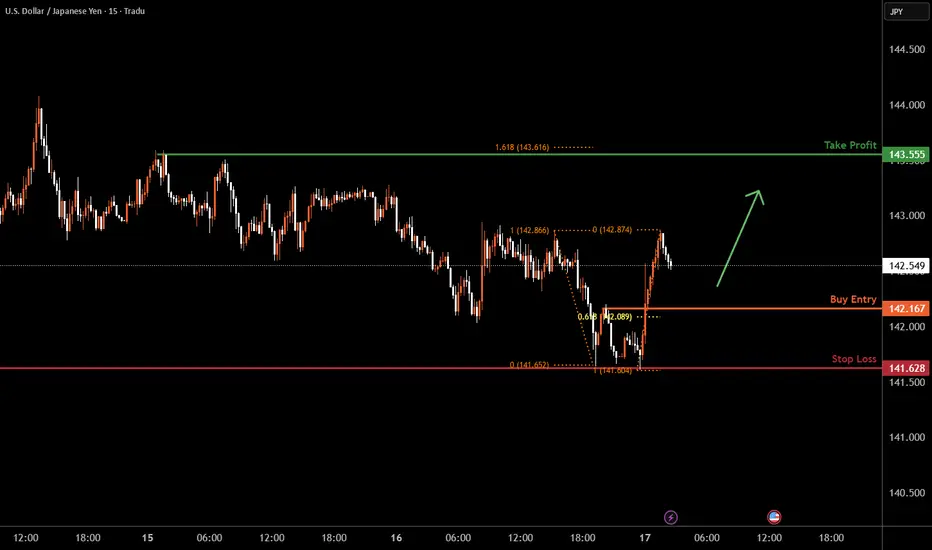
USDJPY M15 | Bullish Bounce Based on the M15 chart analysis, the price is falling toward our buy entry level at 142.16, a pullback support that aligns with the 61.8% Fibonacci retracement.
Our take profit is set at 143.55, a swing high resistance.
The stop loss is placed at 141.62, a swing low support.
High Risk Investment Warning
Trading Forex/CFDs on margin carries a high level of risk and may not be suitable for all investors. Leverage can work against you.
Stratos Markets Limited (tradu.com):
CFDs are complex instruments and come with a high risk of losing money rapidly due to leverage. 63% of retail investor accounts lose money when trading CFDs with this provider. You should consider whether you understand how CFDs work and whether you can afford to take the high risk of losing your money.
Stratos Europe Ltd (tradu.com):
CFDs are complex instruments and come with a high risk of losing money rapidly due to leverage. 63% of retail investor accounts lose money when trading CFDs with this provider. You should consider whether you understand how CFDs work and whether you can afford to take the high risk of losing your money.
Stratos Global LLC (tradu.com):
Losses can exceed deposits.
Please be advised that the information presented on TradingView is provided to Tradu (‘Company’, ‘we’) by a third-party provider (‘TFA Global Pte Ltd’). Please be reminded that you are solely responsible for the trading decisions on your account. There is a very high degree of risk involved in trading. Any information and/or content is intended entirely for research, educational and informational purposes only and does not constitute investment or consultation advice or investment strategy. The information is not tailored to the investment needs of any specific person and therefore does not involve a consideration of any of the investment objectives, financial situation or needs of any viewer that may receive it. Kindly also note that past performance is not a reliable indicator of future results. Actual results may differ materially from those anticipated in forward-looking or past performance statements. We assume no liability as to the accuracy or completeness of any of the information and/or content provided herein and the Company cannot be held responsible for any omission, mistake nor for any loss or damage including without limitation to any loss of profit which may arise from reliance on any information supplied by TFA Global Pte Ltd.
The speaker(s) is neither an employee, agent nor representative of Tradu and is therefore acting independently. The opinions given are their own, constitute general market commentary, and do not constitute the opinion or advice of Tradu or any form of personal or investment advice. Tradu neither endorses nor guarantees offerings of third-party speakers, nor is Tradu responsible for the content, veracity or opinions of third-party speakers, presenters or participants.
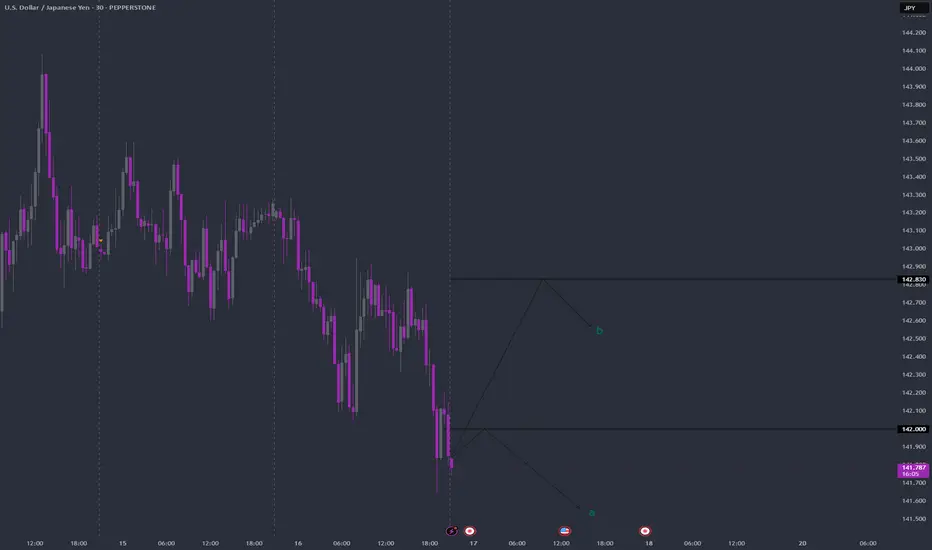
16-04-25 USDJPY Pivot Levela or b?. Most Likely a.
USDJPY in a slide.
These levels are my take on predetermined values by Market based on previous day High and Low.
As always price action determines trades
EUR/USD at Key Decision Zone – Breakout or Smart Money Trap?🟢 Current Context
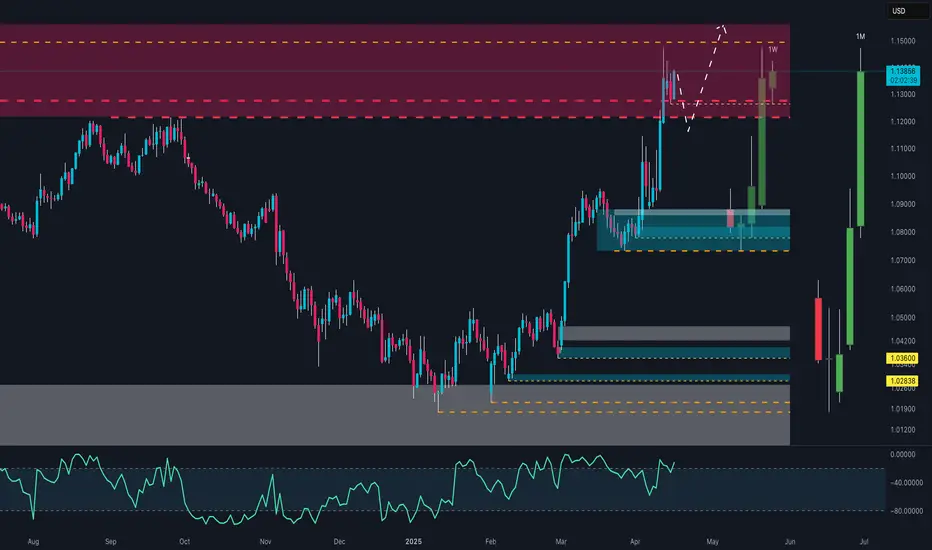
Price: 1.13820 USD
Trend: Strong bullish structure, with impulsive moves especially in April.
Main timeframe: Appears to be daily or weekly, with multi-timeframe zones (1W, 1M marked).
🧱 Key Zones
🔴 Supply Zone (1.13000–1.15000)
Well-defined area of historic selling pressure. Price reacted with a temporary drop but bounced right back into it.
🟦 Demand Zone (1.08500–1.10000)
Major order block where the current rally was initiated. Price used this as a base to launch higher.
⚫ Lower Supports
1.03600: Weekly support
1.02838: Monthly support
Broad accumulation zone (grey box) from which this trend began.
📈 Price Structure
Strong breakout above 1.10–1.11 resistance.
Currently pulling back inside the supply zone – the dashed arrows hint at potential liquidity sweeps before a continuation to 1.15+.
🔍 Momentum Indicator (likely RSI/CCI)
Currently elevated, but not yet in extreme overbought. No clear divergence. Momentum favors bulls.
📊 Scenarios
✅ Bullish:
Clean break above 1.14500–1.15000 opens the door to 1.1600 and 1.1800. Wait for a structural retest for safer long entries.
⚠️ Bearish (corrective):
Strong rejection from the supply zone → potential pullback to 1.10–1.0850 (blue zone).
Only below 1.0850 would a deeper bearish structure toward 1.03600 be confirmed.
🧠 Strategic Note
This is a zone of clear smart money activity: liquidity grabs on both ends.
Watch how this weekly candle closes – we’re either validating above 1.13 or setting up a trap for late longs.
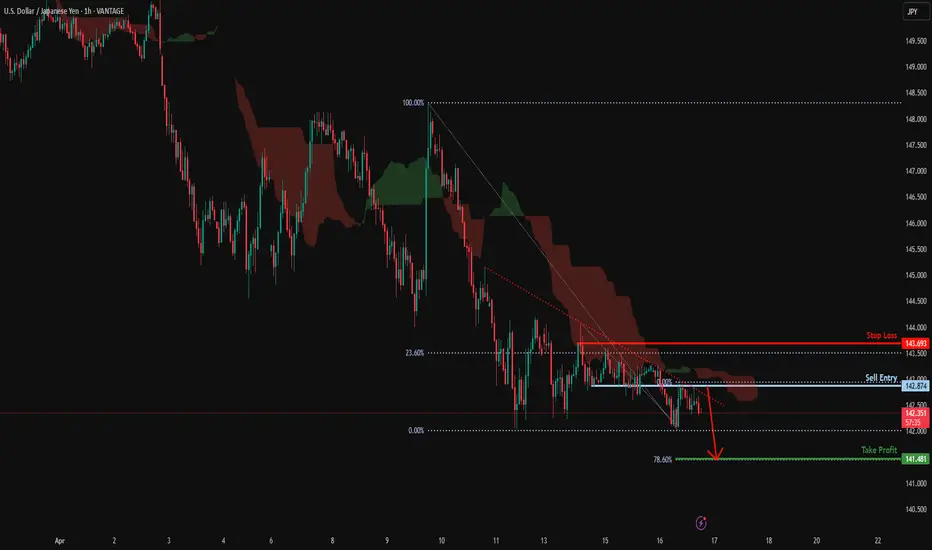
Bearish drop?USD/JPY has rejected off the resistance level which is a pullback resistance and could drop from this level to our take profit.
Entry: 142.87
Why we like it:
There is a pullback resistance level.
Stop loss: 143.69
Why we like it:
There is a pullback resistance level that is slightly above the 23.6% Fibonacci retracement.
Take profit: 141.48
Why we like it:
There is a support level at the 78.6% Fibonacci projection.
Enjoying your TradingView experience? Review us!
Please be advised that the information presented on TradingView is provided to Vantage (‘Vantage Global Limited’, ‘we’) by a third-party provider (‘Everest Fortune Group’). Please be reminded that you are solely responsible for the trading decisions on your account. There is a very high degree of risk involved in trading. Any information and/or content is intended entirely for research, educational and informational purposes only and does not constitute investment or consultation advice or investment strategy. The information is not tailored to the investment needs of any specific person and therefore does not involve a consideration of any of the investment objectives, financial situation or needs of any viewer that may receive it. Kindly also note that past performance is not a reliable indicator of future results. Actual results may differ materially from those anticipated in forward-looking or past performance statements. We assume no liability as to the accuracy or completeness of any of the information and/or content provided herein and the Company cannot be held responsible for any omission, mistake nor for any loss or damage including without limitation to any loss of profit which may arise from reliance on any information supplied by Everest Fortune Group.
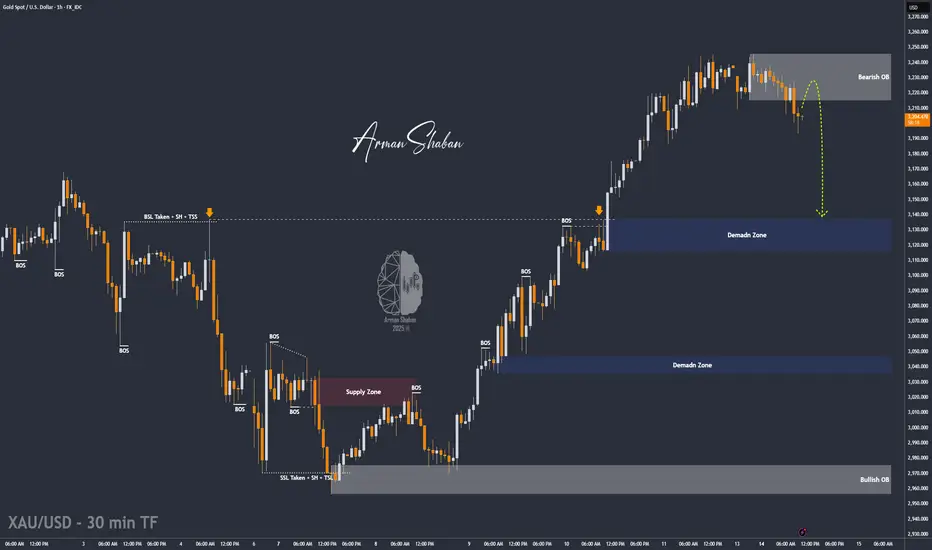
XAU/USD: Bull or Bear? (READ THE CAPTION)By analyzing the gold chart in the 1-hour timeframe, we can see that the price managed to register a new high at $3245, but after that, it was followed by a correction and created a change in market structure. I expect that if the price stabilizes below $3213, it will be accompanied by further decline.
The targets are respectively $3187, $3177, $3155, and $3138.
Please support me with your likes and comments to motivate me to share more analysis with you and share your opinion about the possible trend of this chart with me !
Best Regards , Arman Shaban
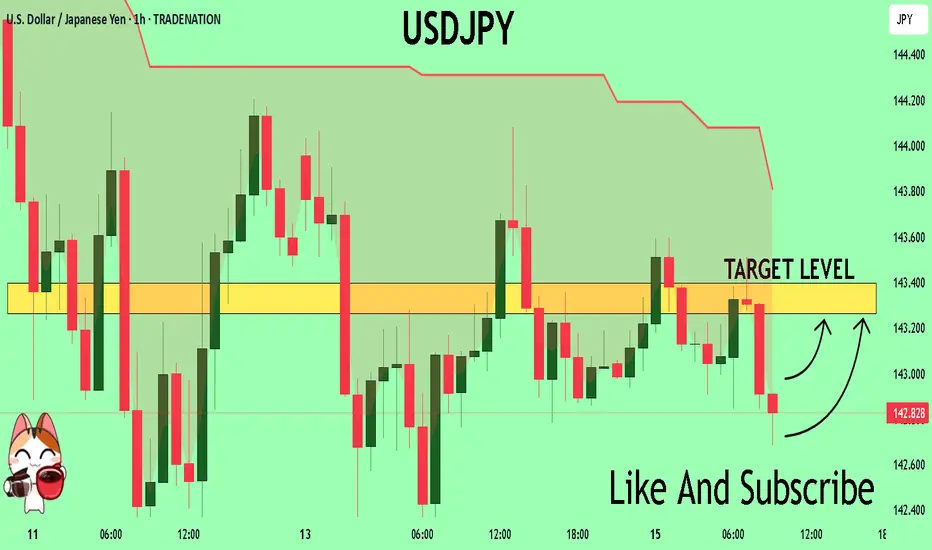
USDJPY INTRADAY bearish below 145.60The USDJPY pair is exhibiting a bearish sentiment, reinforced by the ongoing downtrend. The key trading level to watch is at 145.60, which represents the current intraday swing low and the falling resistance trendline level.
In the short term, an oversold rally from current levels, followed by a bearish rejection at the 145.60 resistance, could lead to a downside move targeting support at 141.00, with further potential declines to 139.50 and 138.40 over a longer timeframe.
On the other hand, a confirmed breakout above the 145.60 resistance level and a daily close above that mark would invalidate the bearish outlook. This scenario could pave the way for a continuation of the rally, aiming to retest the 147.90 resistance, with a potential extension to 149.00 levels.
Conclusion:
Currently, the USDJPY sentiment remains bearish, with the 145.60 level acting as a pivotal resistance. Traders should watch for either a bearish rejection at this level or a breakout and daily close above it to determine the next directional move. Caution is advised until the price action confirms a clear break or rejection.
This communication is for informational purposes only and should not be viewed as any form of recommendation as to a particular course of action or as investment advice. It is not intended as an offer or solicitation for the purchase or sale of any financial instrument or as an official confirmation of any transaction. Opinions, estimates and assumptions expressed herein are made as of the date of this communication and are subject to change without notice. This communication has been prepared based upon information, including market prices, data and other information, believed to be reliable; however, Trade Nation does not warrant its completeness or accuracy. All market prices and market data contained in or attached to this communication are indicative and subject to change without notice.

#USDJPY: Huge Risk To Buy Read The Description
Trading JPY pairs is risky due to the market’s volatility.
USDJPY fell below our buying zone due to JPY’s bullishness and USD’s weakness. While USD has yet to recover, JPY is consolidating. The market is undecided, leading to unusual market movements. We have three targets in this chart analysis. Use it as an alternative bias and have your own analysis and trade management.
Thanks for your support. We expect it to increase, helping us post more analysis.
Much Love🧡
Team Setupsfx
USDJPY Will Explode! BUY!
My dear followers,
This is my opinion on the USDJPY next move:
The asset is approaching an important pivot point 142.79
Bias - Bullish
Technical Indicators: Supper Trend generates a clear long signal while Pivot Point HL is currently determining the overall Bullish trend of the market.
Goal - 143.26
About Used Indicators:
For more efficient signals, super-trend is used in combination with other indicators like Pivot Points.
Disclosure: I am part of Trade Nation's Influencer program and receive a monthly fee for using their TradingView charts in my analysis.
———————————
WISH YOU ALL LUCK
USDJPY and USDCAD analysis todayHello traders, this is a complete multiple timeframe analysis of this pair. We see could find significant trading opportunities as per analysis upon price action confirmation we may take this trade. Smash the like button if you find value in this analysis and drop a comment if you have any questions or let me know which pair to cover in my next analysis.

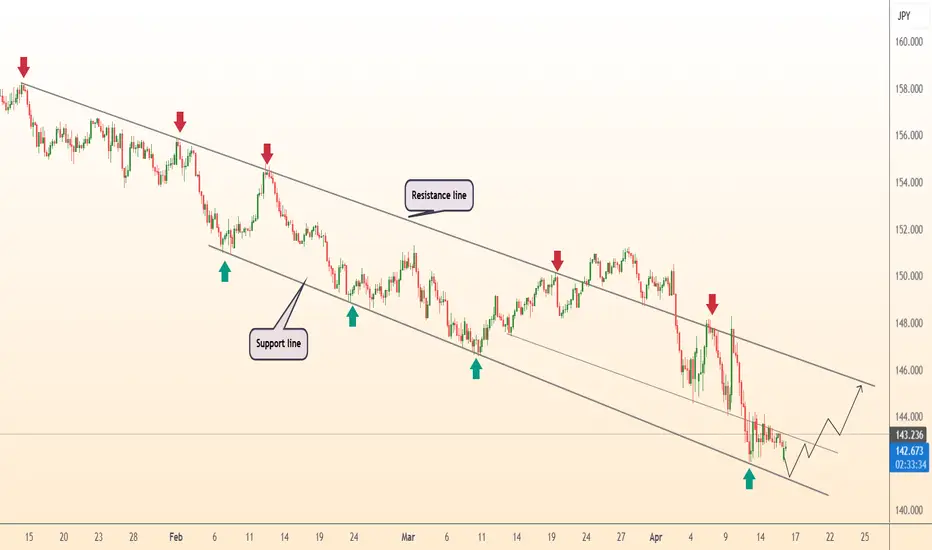
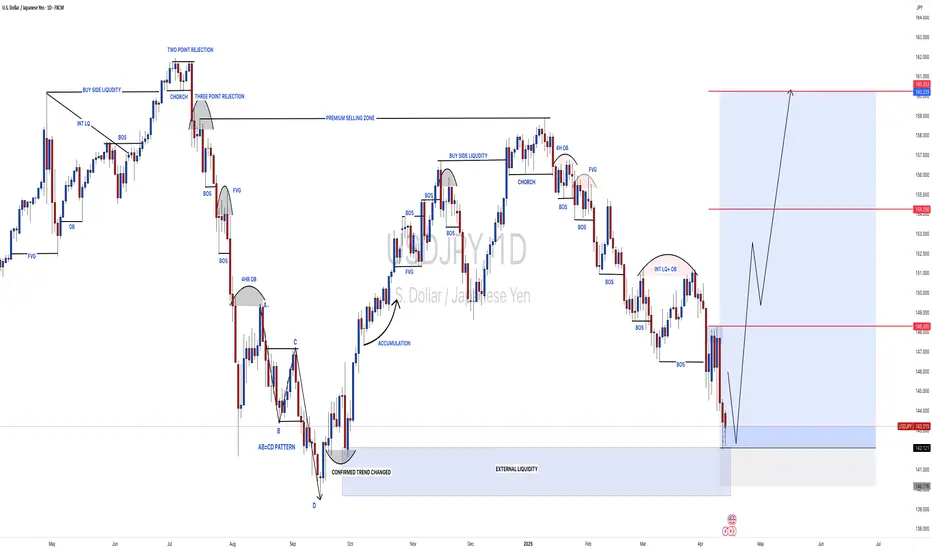
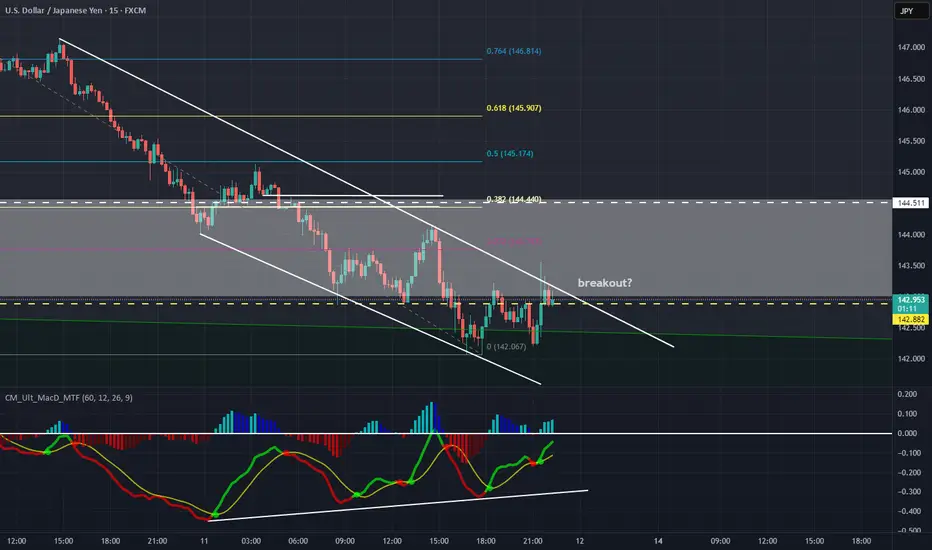
Usdjpy reversal coming 15 April 2025Using wave pattern, we can see that price is ranging in what appears to be a triangle
After which, there is a high probability price spike down lower towards 141 region to complete the waves.
Once the pattern is completed, price may start to reverse and retest previous high around 148 region. Hope this works and benefit your trades
Good luck.

USD/JPY - What to expect as price consolidates above support?Introduction
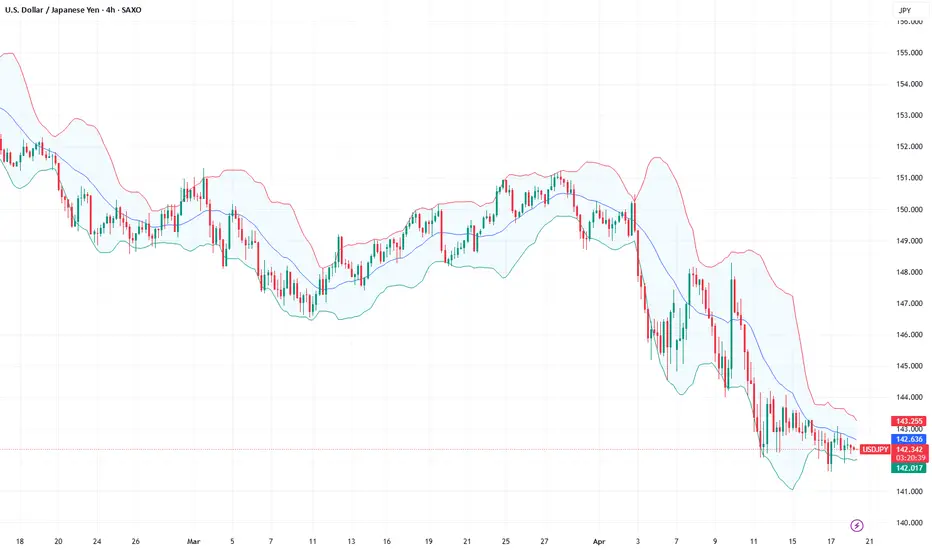
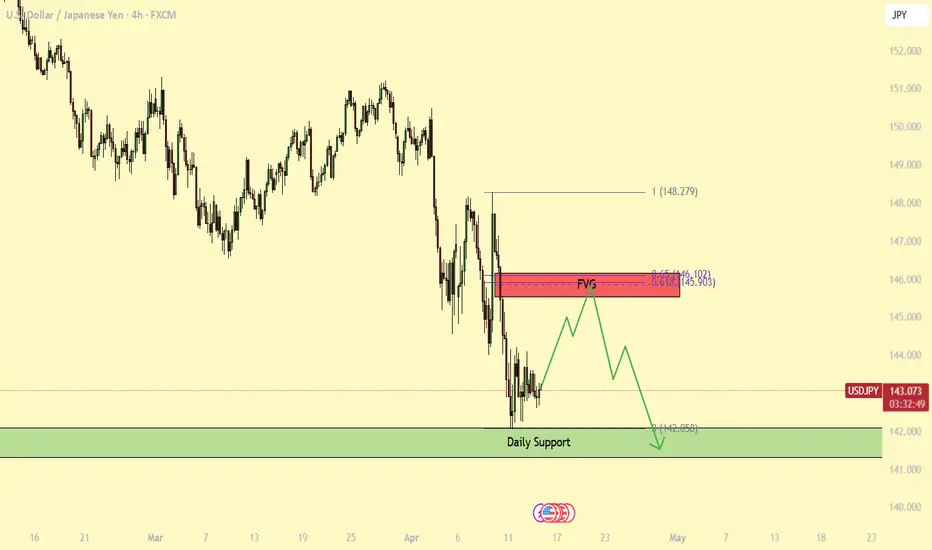
The USD/JPY pair has been in a clear daily downtrend, marked by a bearish market structure and strong downside momentum. Sellers remain firmly in control, consistently driving prices lower as the pair respects the prevailing trend. Each failed recovery attempt only reinforces the bearish structure, suggesting that the path of least resistance continues to be to the downside.
FVG
Following the most recent drop, the pair is now consolidating just above a key support level. A short-term relief bounce toward the 4-hour Fair Value Gap (FVG) wouldn't be unexpected. This particular FVG, formed during the last leg down, remains unfilled — and such gaps are often revisited before the trend resumes.
Confluences
Notably, this FVG aligns with the Golden Pocket Fibonacci retracement zone (0.618–0.65), adding further confluence and making it a potentially strong resistance area. If price does retrace into this zone, it could face significant selling pressure and resume its move back toward the daily support zone.
Conclusion
While a bounce from daily support is possible, I expect USD/JPY to encounter resistance at the 4H FVG level. This could cap any recovery attempts and signal a continuation of the broader bearish trend.
Thanks for your support.
- Make sure to follow me so you don't miss out on the next analysis!
- Drop a like and leave a comment!
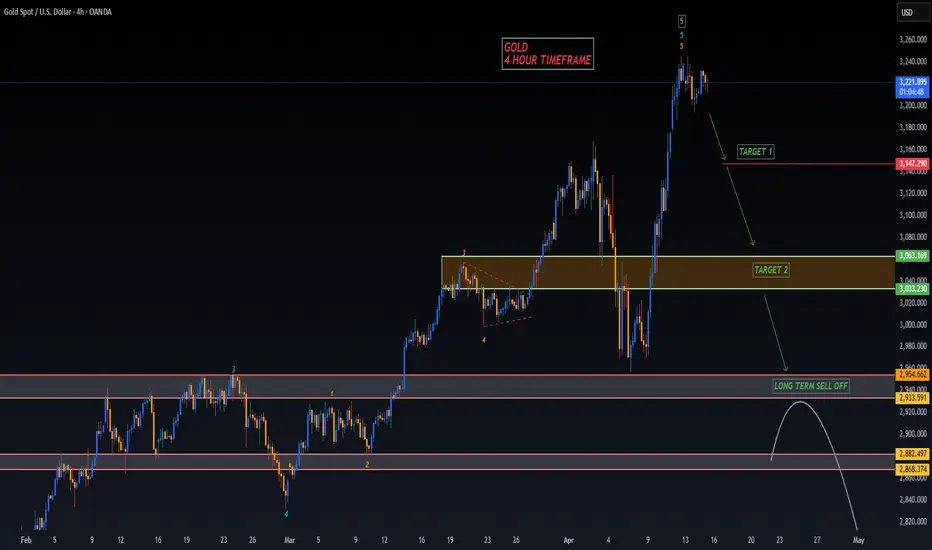
Gold Wave 5 Bull Complete?! (4H UPDATE)Today & yesterday's price action is the slowest movements we've seen in the market in the past few weeks, which in my eyes is a positive sign. It means Gold has either or is close enough to topping in the next week or two, after which we should see a bearish market sentiment kick in.
POI 1: $3,147📉
POI 2: $3,060📉
Markets are hugely volatile, so we need to monitor minor areas for any potential reversals or continuation of trends.
USDJPY (1h) Potential SellAll major time frames indicate this pair will keep going down.
3 point confluences:
1. Created lower highs in both long term & short term tend failing to break the trendlines
2. We've just got a CHoCH (change in character)
3. Sell order block has formed after going sideways for a couple of days which means price is most likely to revisit it before exploding down.
Entry strategy:
Wait for a pullback into the recent sell order block then enter when the stochastics indicator is overbought to help give us a tighter stop-loss.
Alternatively you can set a sell-limit order on the entry price (green line)
Note: price could keep travelling down without doing a pullback
GoodLuck!
Usdjpy 11 apr positive divergenceAnyone still dare to long usdjpy? If 90% dare not, most probably it can creep u.
Looking for price to close above to add more longs
Good luck to me.
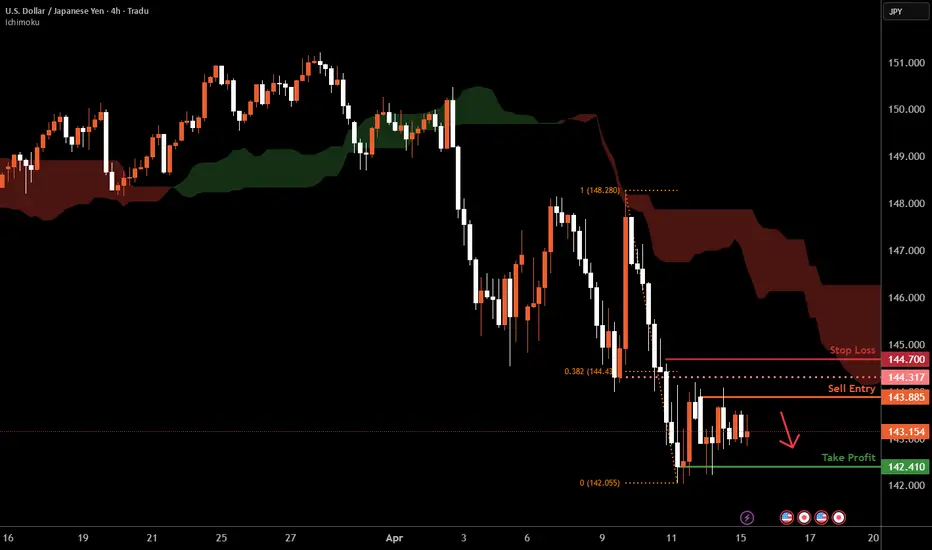
USD/JPY H4 | Approaching a multi-swing-high resistanceUSD/JPY is rising towards a multi-swing-high resistance and could potentially reverse off this level to drop lower.
Sell entry is at 143.88 which is a multi-swing-high resistance.
Stop loss is at 144.70 which is a level that sits above the 38.2% Fibonacci retracement and a pullback resistance.
Take profit is at 142.41 which is a multi-swing-low support.
High Risk Investment Warning
Trading Forex/CFDs on margin carries a high level of risk and may not be suitable for all investors. Leverage can work against you.
Stratos Markets Limited (tradu.com):
CFDs are complex instruments and come with a high risk of losing money rapidly due to leverage. 63% of retail investor accounts lose money when trading CFDs with this provider. You should consider whether you understand how CFDs work and whether you can afford to take the high risk of losing your money.
Stratos Europe Ltd (tradu.com):
CFDs are complex instruments and come with a high risk of losing money rapidly due to leverage. 63% of retail investor accounts lose money when trading CFDs with this provider. You should consider whether you understand how CFDs work and whether you can afford to take the high risk of losing your money.
Stratos Global LLC (tradu.com):
Losses can exceed deposits.
Please be advised that the information presented on TradingView is provided to Tradu (‘Company’, ‘we’) by a third-party provider (‘TFA Global Pte Ltd’). Please be reminded that you are solely responsible for the trading decisions on your account. There is a very high degree of risk involved in trading. Any information and/or content is intended entirely for research, educational and informational purposes only and does not constitute investment or consultation advice or investment strategy. The information is not tailored to the investment needs of any specific person and therefore does not involve a consideration of any of the investment objectives, financial situation or needs of any viewer that may receive it. Kindly also note that past performance is not a reliable indicator of future results. Actual results may differ materially from those anticipated in forward-looking or past performance statements. We assume no liability as to the accuracy or completeness of any of the information and/or content provided herein and the Company cannot be held responsible for any omission, mistake nor for any loss or damage including without limitation to any loss of profit which may arise from reliance on any information supplied by TFA Global Pte Ltd.
The speaker(s) is neither an employee, agent nor representative of Tradu and is therefore acting independently. The opinions given are their own, constitute general market commentary, and do not constitute the opinion or advice of Tradu or any form of personal or investment advice. Tradu neither endorses nor guarantees offerings of third-party speakers, nor is Tradu responsible for the content, veracity or opinions of third-party speakers, presenters or participants.
Fundamental Market Analysis for April 15, 2025 USDJPYThe Japanese yen (JPY) is declining during the Asian session on Tuesday, which, along with a modest rise in the US dollar (USD), is lifting the USD/JPY pair closer to the mid-143.00s. US President Donald Trump's cancellation of tariffs on major consumer electronics and the signal that he may temporarily exempt the auto industry from the 25 per cent duties continue to support market optimism. This in turn undermines demand for traditional safe-haven assets, including the yen.
However, the rapidly escalating trade war between the US and China and lingering concerns over the potential economic impact of Trump's crippling tariffs should temper market optimism. Meanwhile, expectations that the Bank of Japan (BoJ) will continue to raise interest rates are strongly at odds with bets on more aggressive policy easing by the Federal Reserve (Fed). This, along with hopes of a trade deal between the US and Japan, should limit losses for the low-yielding Yen.
Trade recommendation: SELL 142.80, SL 144.50, TP 140.50