USDJPY Will Go Lower! Sell!
Please, check our technical outlook for USDJPY.
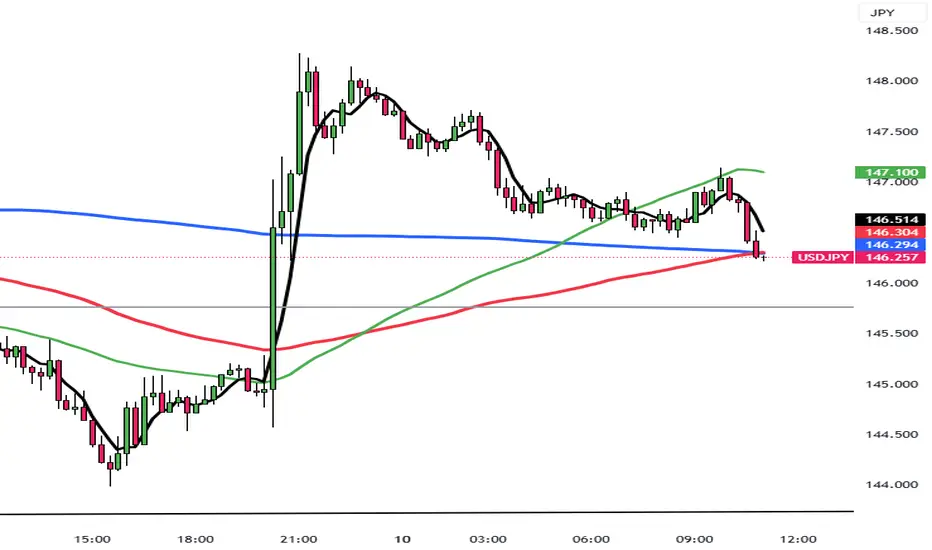
Time Frame: 1h
Current Trend: Bearish
Sentiment: Overbought (based on 7-period RSI)
Forecast: Bearish
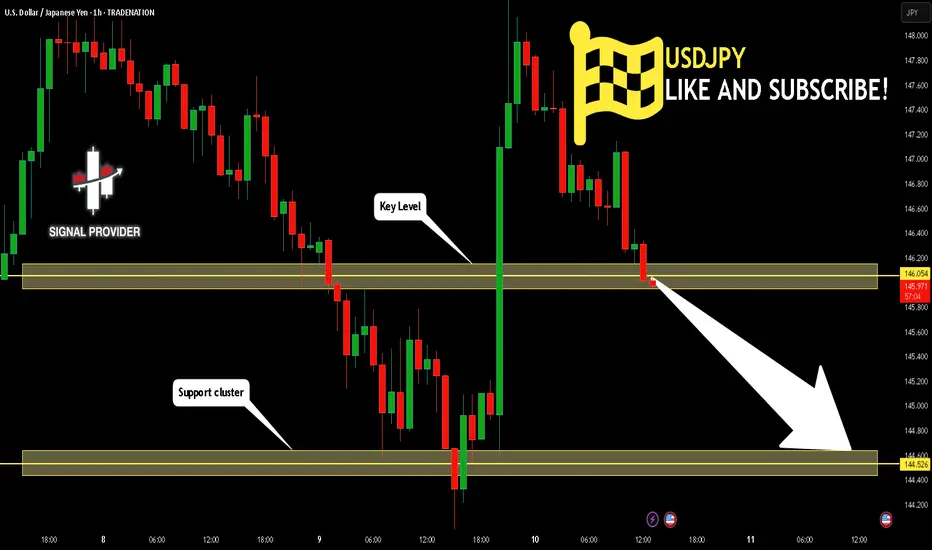
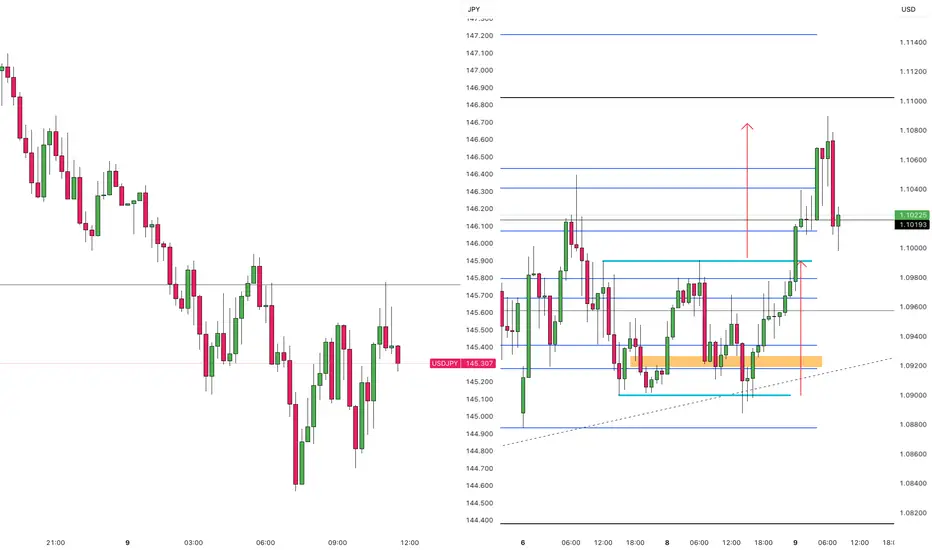
The price is testing a key resistance 146.054.
Taking into consideration the current market trend & overbought RSI, chances will be high to see a bearish movement to the downside at least to 144.526 level.
P.S
Overbought describes a period of time where there has been a significant and consistent upward move in price over a period of time without much pullback.
Disclosure: I am part of Trade Nation's Influencer program and receive a monthly fee for using their TradingView charts in my analysis.
Like and subscribe and comment my ideas if you enjoy them!
USDJPY
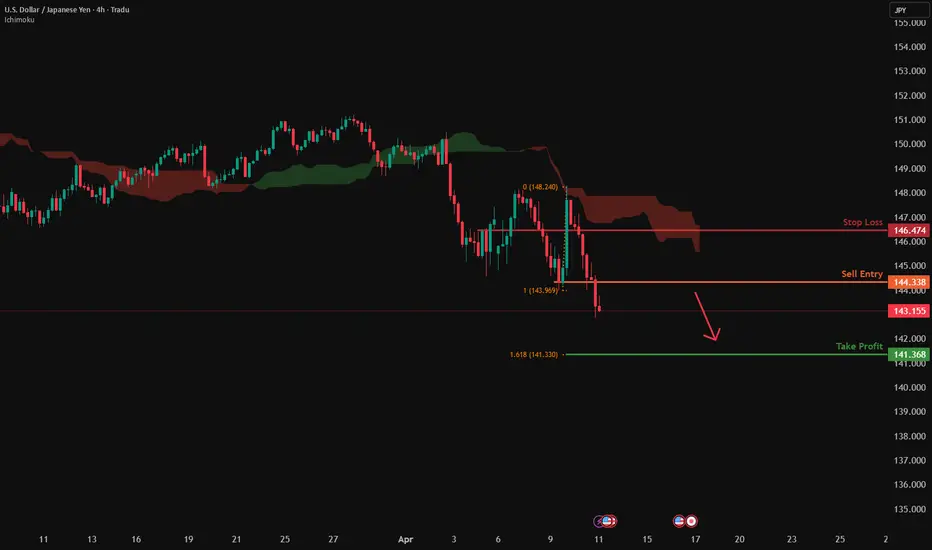
USDJPY H4 I Bearish ContinuationBased on the H4 chart analysis, the price could rise toward our sell entry at 144.33, which is a pullback resistance.
Our take profit will be at 1141.36, aligning with the 161.8% FIbonacci extension
The stop loss will be placed at 146.47, a pullback resistance.
High Risk Investment Warning
Trading Forex/CFDs on margin carries a high level of risk and may not be suitable for all investors. Leverage can work against you.
Stratos Markets Limited (tradu.com):
CFDs are complex instruments and come with a high risk of losing money rapidly due to leverage. 63% of retail investor accounts lose money when trading CFDs with this provider. You should consider whether you understand how CFDs work and whether you can afford to take the high risk of losing your money.
Stratos Europe Ltd (tradu.com):
CFDs are complex instruments and come with a high risk of losing money rapidly due to leverage. 63% of retail investor accounts lose money when trading CFDs with this provider. You should consider whether you understand how CFDs work and whether you can afford to take the high risk of losing your money.
Stratos Global LLC (tradu.com):
Losses can exceed deposits.
Please be advised that the information presented on TradingView is provided to Tradu (‘Company’, ‘we’) by a third-party provider (‘TFA Global Pte Ltd’). Please be reminded that you are solely responsible for the trading decisions on your account. There is a very high degree of risk involved in trading. Any information and/or content is intended entirely for research, educational and informational purposes only and does not constitute investment or consultation advice or investment strategy. The information is not tailored to the investment needs of any specific person and therefore does not involve a consideration of any of the investment objectives, financial situation or needs of any viewer that may receive it. Kindly also note that past performance is not a reliable indicator of future results. Actual results may differ materially from those anticipated in forward-looking or past performance statements. We assume no liability as to the accuracy or completeness of any of the information and/or content provided herein and the Company cannot be held responsible for any omission, mistake nor for any loss or damage including without limitation to any loss of profit which may arise from reliance on any information supplied by TFA Global Pte Ltd.
The speaker(s) is neither an employee, agent nor representative of Tradu and is therefore acting independently. The opinions given are their own, constitute general market commentary, and do not constitute the opinion or advice of Tradu or any form of personal or investment advice. Tradu neither endorses nor guarantees offerings of third-party speakers, nor is Tradu responsible for the content, veracity or opinions of third-party speakers, presenters or participants.
11-4-25 YEN Pivot LevelLevels are set
Price had swift breaks of yesterday's levels, but shows, it must react to them.

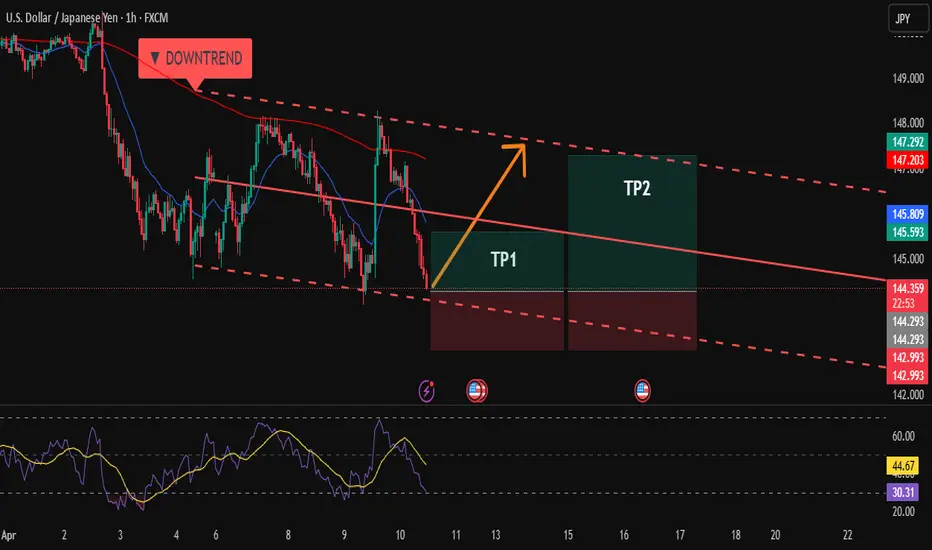
Explosive Rebound on USD/JPY? This Zone Has It ALL...Hi traders! Analyzing USD/JPY on the 1H timeframe, spotting a potential rebound within a descending channel:
🔹 Entry: 144.35
🔹 TP1: 145.59
🔹 TP2: 147.29
🔹 SL: 142.993
Price is currently testing the lower boundary of a well-structured descending channel — a zone that has held as dynamic support multiple times. The RSI is in oversold territory, suggesting the potential for a bullish correction.
If buyers defend this area again, we could see a strong bounce toward the midline and possibly the upper boundary of the channel. Wait for bullish confirmation (e.g., strong candle or volume spike) before entering.
⚠️ DISCLAIMER: This is not financial advice. Every trader must evaluate their own risk and strategy.
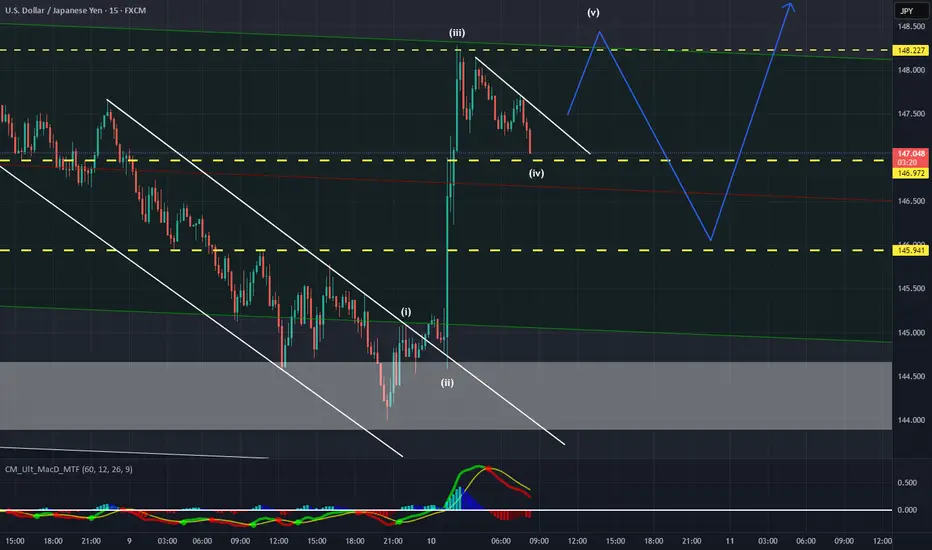
Usdjpy 10 AprWhat a spike up, my longs around the low booked me a handsome profit
Am now waiting for a minor new high to confirm a clear 5 waves move up
This will indicate price will go even higher
Hope this works and give me another few hundred pips of profit.
USDJPY: Long Signal with Entry/SL/TP
USDJPY
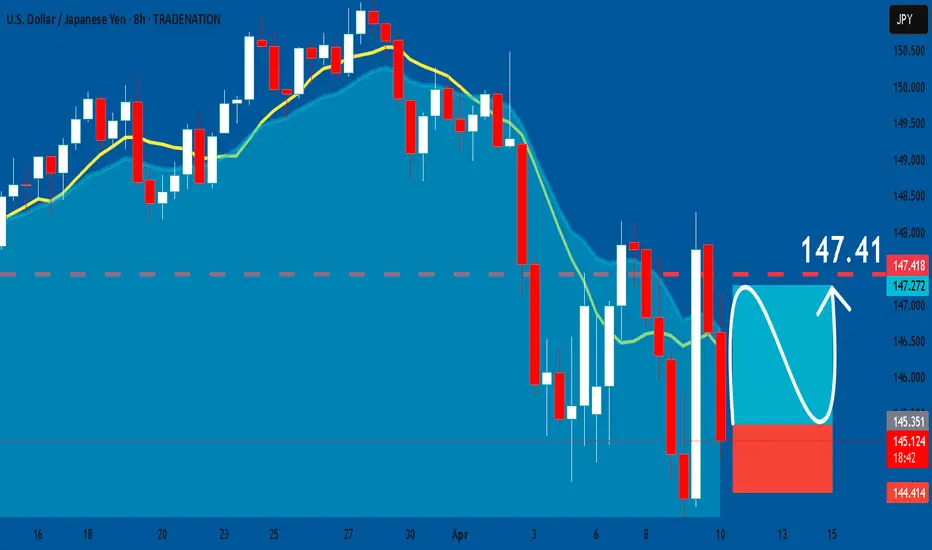
- Classic bullish formation
- Our team expects growth
SUGGESTED TRADE:
Swing Trade
Buy USDJPY
Entry Level - 145.33
Sl - 144.41
Tp - 147.41
Our Risk - 1%
Start protection of your profits from lower levels
Disclosure: I am part of Trade Nation's Influencer program and receive a monthly fee for using their TradingView charts in my analysis.
❤️ Please, support our work with like & comment! ❤️
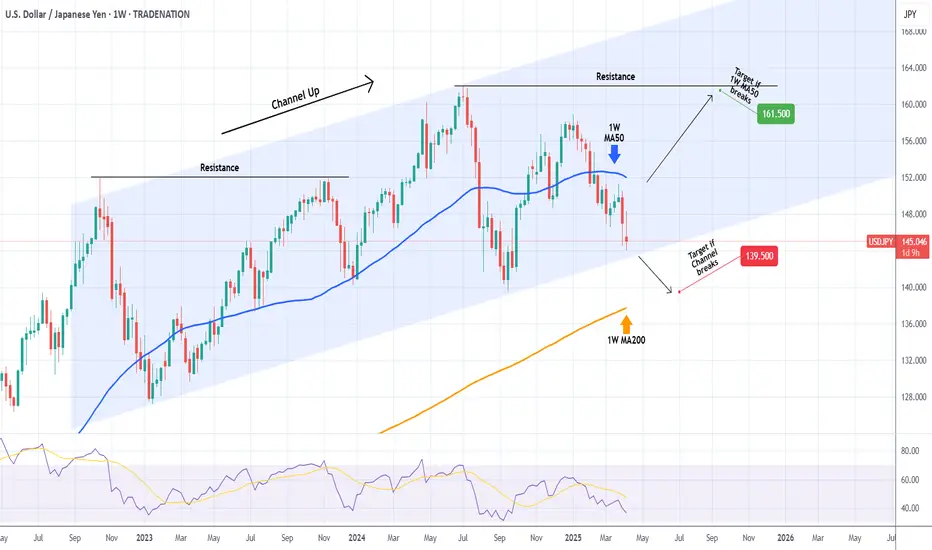
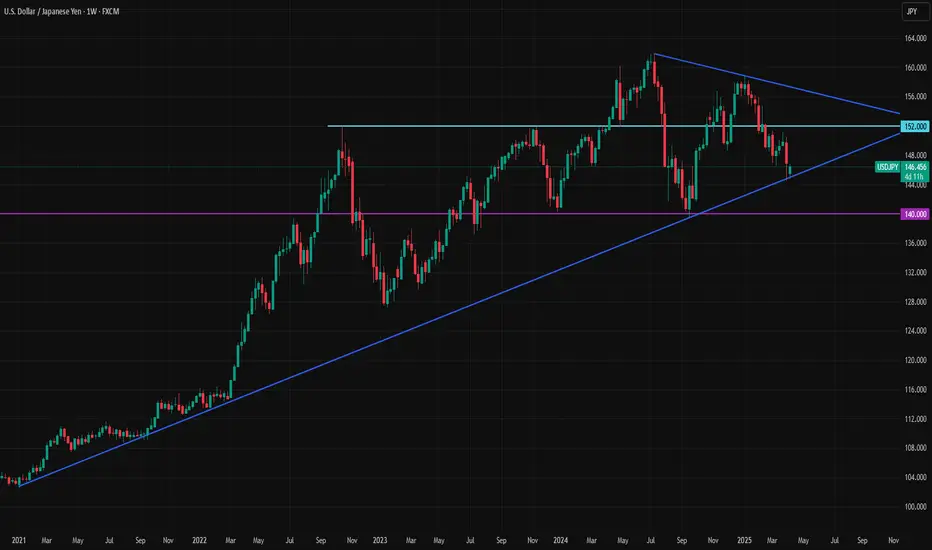
USDJPY Moment of truth for the long-term bullish trend.The USDJPY pair has been trading within a Channel Up since the October 17 2022 High and right now the current 1W candle is very close to its bottom (Higher Lows trend-line). This offers a low risk trading set-up.
Confirmed buy will be if the price breaks and closes a 1W candle above the 1W MA50 (blue trend-line), in which case our Target will be July's Resistance at 161.500 (similar to the 2023 Bullish Leg).
If on the other hand it breaks and closes a 1W candle below the Channel Up, turn short and target the 1W MA200 (orange trend-line) at 139.500.
-------------------------------------------------------------------------------
** Please LIKE 👍, FOLLOW ✅, SHARE 🙌 and COMMENT ✍ if you enjoy this idea! Also share your ideas and charts in the comments section below! This is best way to keep it relevant, support us, keep the content here free and allow the idea to reach as many people as possible. **
-------------------------------------------------------------------------------
Disclosure: I am part of Trade Nation's Influencer program and receive a monthly fee for using their TradingView charts in my analysis.
💸💸💸💸💸💸
👇 👇 👇 👇 👇 👇
USDJPY and GBPJPY Analysis todayHello traders, this is a complete multiple timeframe analysis of this pair. We see could find significant trading opportunities as per analysis upon price action confirmation we may take this trade. Smash the like button if you find value in this analysis and drop a comment if you have any questions or let me know which pair to cover in my next analysis.

Fundamental Market Analysis for April 10, 2025 USDJPYThe Japanese yen (JPY) showed strength during the Asian trading session on Thursday, reacting to the release of producer price index (PPI) data that exceeded market expectations. This macroeconomic signal reinforced speculation about possible further monetary policy tightening by the Bank of Japan (BoJ), keeping the probability of an interest rate hike in the future. Additional support for the yen was provided by positive expectations of a potential trade agreement between Japan and the United States.
Amid the weakening of the US dollar (USD), the USD/JPY pair showed a pullback and fell below the psychologically important level of 147.000, which was also supported by a limited correction of the US currency amid a general recovery in market confidence.
The divergence in monetary expectations between the Bank of Japan and the Federal Reserve remains significant. While Japan is increasingly likely to tighten monetary policy, markets in the US are pricing in a scenario of multiple cuts in the Fed's key interest rate in 2025. This discrepancy has prevented the US dollar from maintaining momentum after an overnight recovery from a weekly low, prompting a reallocation of capital in favor of the more stable yen despite its status as a low-yielding currency.
Improved global risk sentiment, driven by US President Donald Trump's announcement of a temporary suspension of retaliatory tariffs against key trading partners, may also help strengthen the yen as a safe haven asset, especially amid continued uncertainty in international markets.
Trade recommendation: SELL 146.800, SL 147.400, TP 145.400
Yen Climbs as Trump Softens Stance on Japan TariffsThe Japanese yen strengthened past 147 per dollar on Thursday, moving in a volatile range as trade tensions persisted. Markets reacted to President Trump’s 90-day pause on tariffs for non-retaliating countries, offering Japan some relief with a reduced 10% baseline tariff. However, tensions remained elevated as Trump raised tariffs on Chinese imports to 125% in response to Beijing’s retaliation. The EU may be excluded from the pause due to its own countermeasures. Meanwhile, the U.S. confirmed plans to begin trade talks with Japan after Trump’s call with Prime Minister Shigeru Ishiba.
Key resistance is at 148.70, with further levels at 152.70 and 157.70. Support stands at 145.60, followed by 143.00 and 141.80.
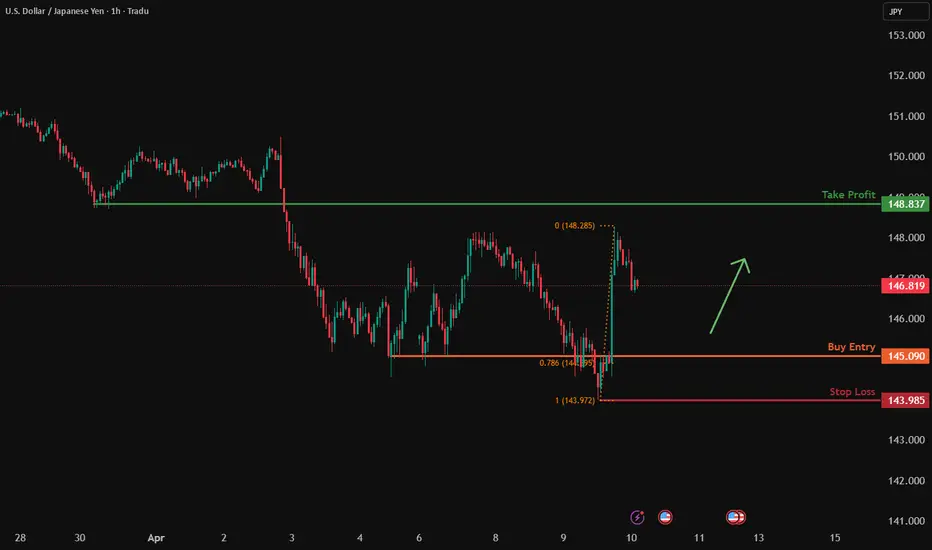
USDJPY H1 I Bullish Bounce Off Based on the H1 chart, the price is falling toward our buy entry level at 145.09, a pullback support that aligns with the 78.6% Fibo retracement.
Our take profit is set at 148.83, a pullback resistance.
The stop loss is set at 143.98, a swing low support.
High Risk Investment Warning
Trading Forex/CFDs on margin carries a high level of risk and may not be suitable for all investors. Leverage can work against you.
Stratos Markets Limited (tradu.com):
CFDs are complex instruments and come with a high risk of losing money rapidly due to leverage. 63% of retail investor accounts lose money when trading CFDs with this provider. You should consider whether you understand how CFDs work and whether you can afford to take the high risk of losing your money.
Stratos Europe Ltd (tradu.com):
CFDs are complex instruments and come with a high risk of losing money rapidly due to leverage. 63% of retail investor accounts lose money when trading CFDs with this provider. You should consider whether you understand how CFDs work and whether you can afford to take the high risk of losing your money.
Stratos Global LLC (tradu.com):
Losses can exceed deposits.
Please be advised that the information presented on TradingView is provided to Tradu (‘Company’, ‘we’) by a third-party provider (‘TFA Global Pte Ltd’). Please be reminded that you are solely responsible for the trading decisions on your account. There is a very high degree of risk involved in trading. Any information and/or content is intended entirely for research, educational and informational purposes only and does not constitute investment or consultation advice or investment strategy. The information is not tailored to the investment needs of any specific person and therefore does not involve a consideration of any of the investment objectives, financial situation or needs of any viewer that may receive it. Kindly also note that past performance is not a reliable indicator of future results. Actual results may differ materially from those anticipated in forward-looking or past performance statements. We assume no liability as to the accuracy or completeness of any of the information and/or content provided herein and the Company cannot be held responsible for any omission, mistake nor for any loss or damage including without limitation to any loss of profit which may arise from reliance on any information supplied by TFA Global Pte Ltd.
The speaker(s) is neither an employee, agent nor representative of Tradu and is therefore acting independently. The opinions given are their own, constitute general market commentary, and do not constitute the opinion or advice of Tradu or any form of personal or investment advice. Tradu neither endorses nor guarantees offerings of third-party speakers, nor is Tradu responsible for the content, veracity or opinions of third-party speakers, presenters or participants.
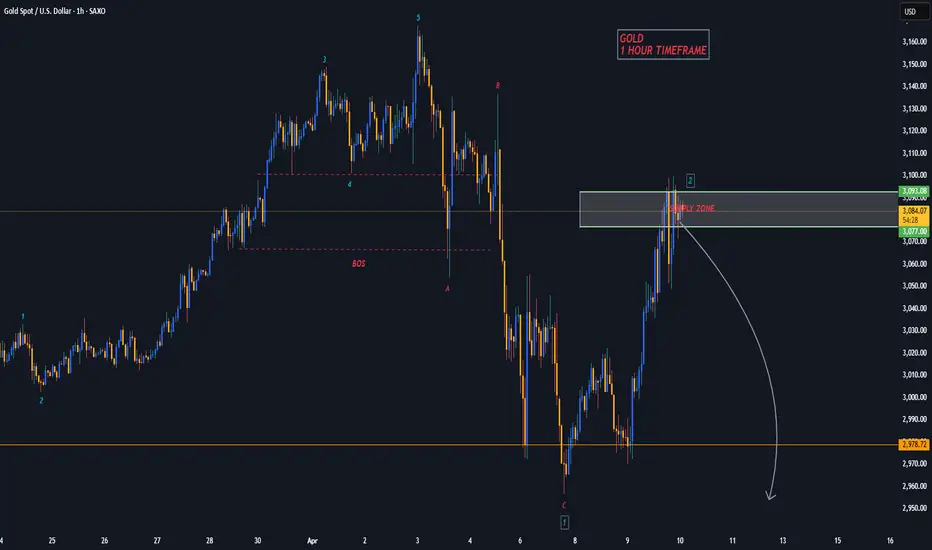
GOLD SELL - POSSIBLE 2ND ENTRYI’m selling XAUUSD here again for my 2nd entry. This is a HIGH RISK trade, due to the huge bullish momentum right now & Tariff wars.
If this ‘Wave 2 Zone’ gets taken out, it’s likely we will see a new ATH coming on Gold.
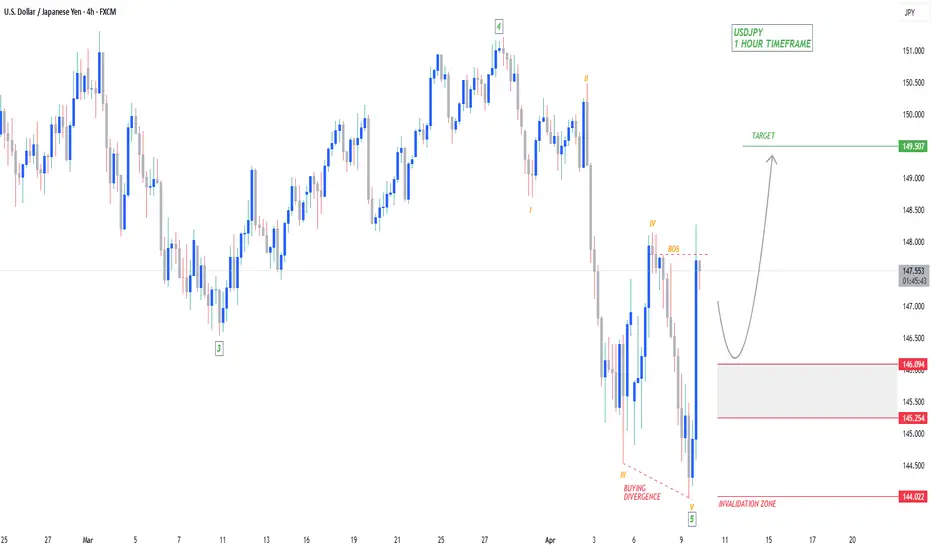
USDJPY Bullish to $149.500Rather than buying at the top of the ‘Impulse Wave’, wait for a ‘Wave 2’ or ‘Wave B’ correction towards the support zone, so you can buy back at a cheaper price.
⭕️5 Major Wave Bearish Move Complete.
⭕️5 Minor Waves Complete in Wave 5.
⭕️BOS Confirming Bullish Structure Now Valid.
10-4-25 YEN Pivot LevelObserve again the function of pivot levels.
Use in conjunction with good money management plan

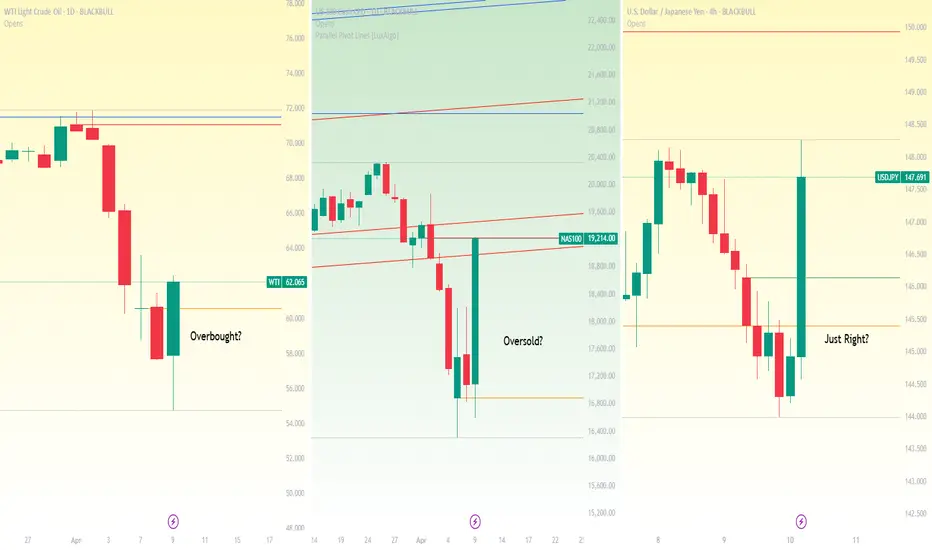
Another tariff u-turn: Oil overbought on news? President Trump announced a 90-day pause on reciprocal tariffs for countries that have not retaliated, sparking a sharp rally in U.S. markets. The Nasdaq 100 led gains with a 12.2% surge. The U.S. dollar also strengthened against safe-haven currencies such as the Japanese yen and Swiss franc.
Crude oil prices rebounded alongside equities, with oil futures rising more than 4% to trade above $62 per barrel.
However, the strength of the oil rally may be overstated. China, one of the world’s largest oil consumers, was among the first to retaliate against U.S. tariffs. Tensions between Washington and Beijing have worsened, prompting the U.S. to raise tariffs on Chinese goods to 125%.
Adding to the caution, analysts at Goldman Sachs revised down their 2026 average price forecasts for Brent and WTI, citing rising recession risks. The bank now expects Brent to average $58 per barrel and WTI to average $55.
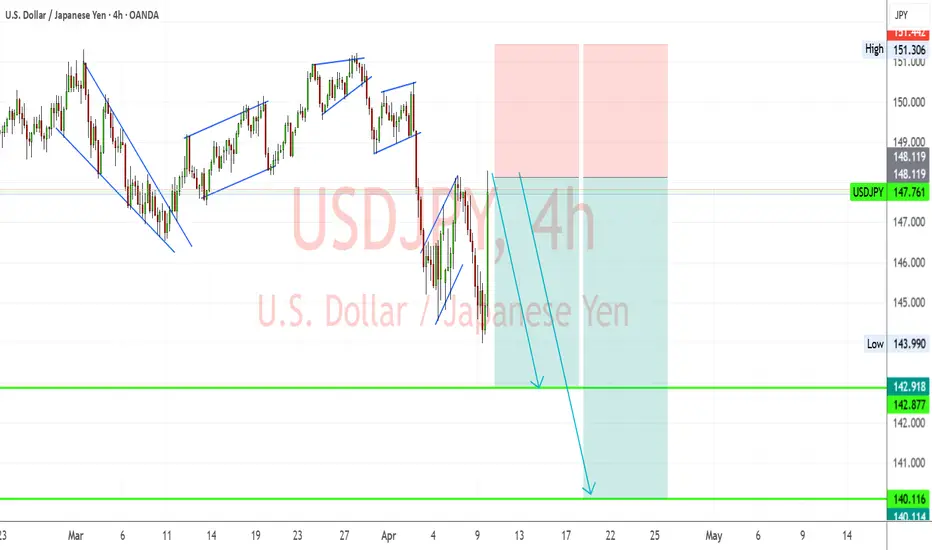
USDJPY Bearish Flag Breakdown – Eyes on 140.11 Support ZoneUSDJPY is showing signs of a bearish continuation, following a breakdown from a rising wedge pattern. The recent strong drop confirms a shift in momentum from bullish to bearish, with price now forming a bear flag just below a key structure.
Key Technical Zones:
Current Price: 147.78
Resistance Area (Invalidation Zone): 148.11 – 151.44
Support Targets:
TP1: 142.87
TP2: 140.11
Technical Confluence & Patterns:
✅ Series of Rising Wedges followed by sharp breakdowns
✅ Bear Flag Pattern forming after recent drop
✅ Lower highs & lower lows confirming downtrend
✅ Volume spike during breakdown, low volume on pullback
Trade Outlook:
📉 Bias: Bearish below 148.11
📌 Entry Zone: On confirmation of flag breakdown
🎯 Target 1: 142.87 – Previous horizontal support
🎯 Target 2: 140.11 – Major swing support / demand zone
🛑 Invalidation: Break above 151.44 (major resistance zone)
Conclusion:
USDJPY is set up for a potential bearish continuation as it respects a textbook flag breakdown setup. A close below 147.50 would reinforce bearish pressure with further downside toward 142.87 and 140.11. Traders should monitor momentum and structure confirmation before entering positions.
Let me know if you want a short caption or video script version! 📉
Yen surges to six-month high, BoJ cautiousThe Japanese yen continues to make inroads against the US dollar. In the North American session, USD/JPY is up 1.1% on Wednesday, trading at 144.60. Earlier, the yen strengthened to 143.98, its strongest level since Sept. 2024.
Bank of Japan Governor Kazuo Ueda said on Wednesday that the central bank will have to determine the impact of US trade policy on growth and inflation in Japan. Ueda said that US tariffs had created new uncertainty and signaled that the BoJ might hold off on further interest rates until the situation became more clear.
Ueda repeated that the BoJ would raise rates if the economy continued to improve, and currently, underlying inflation was rising and moving closer to 2% target. The uptake is that the BoJ is being very cautious with all the turmoil in the markets and is dampening expectations of a rate hike at the May 1 meeting.
FOMC minutes - still relevant?
The Federal Reserve will post its minutes of the March rate meeting. Investors scrutinize the minutes for policy clarity but global economic developments are unfolding so quickly that it's questionable if the minutes will be relevant with the massive market sell-off and the trade war between the US and China.
Earlier today, the US lifted tariffs on China to an astounding 104% and China has retaliated with an 84% counter-tariff. The turmoil in the financial markets has nervous investors looking for safer shores, and are parking their funds in safe-haven assets like the Japanese yen and the Swiss franc. In April, the yen has jumped 3.3% against the US dollar, while the Swiss franc has soared 5% against the greenback.
USD/JPY has pushed below support at 145.46 and is putting pressure on support at 144.64
There is resistance at 146.79 and 147.61

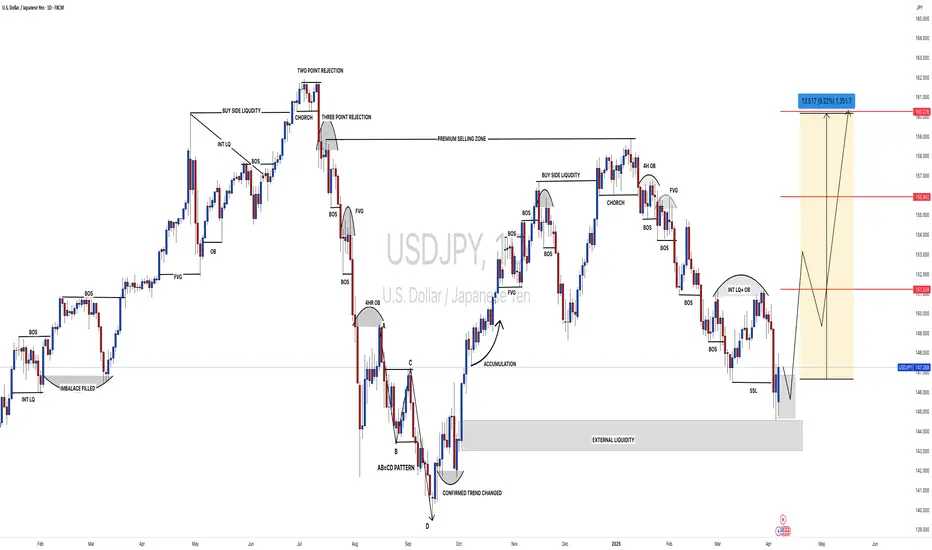
#USDJPY:1351+ Bullish Move One Not To Miss| Three TPs| JPY has been bullish since the dollar strengthened, potentially leading to a trade war that would make the Japanese yen more valuable to global investors. However, we may see a strong correction on all XXXJPY pairs, potentially returning stronger with a major bullish correction. We’re not sure if the price will hit all three take profit zones, but we’re interested in how far it goes.
Use accurate risk management. This analysis is purely for educational purposes only. Use your own knowledge and analysis before taking any entries.
Team Setupsfx_
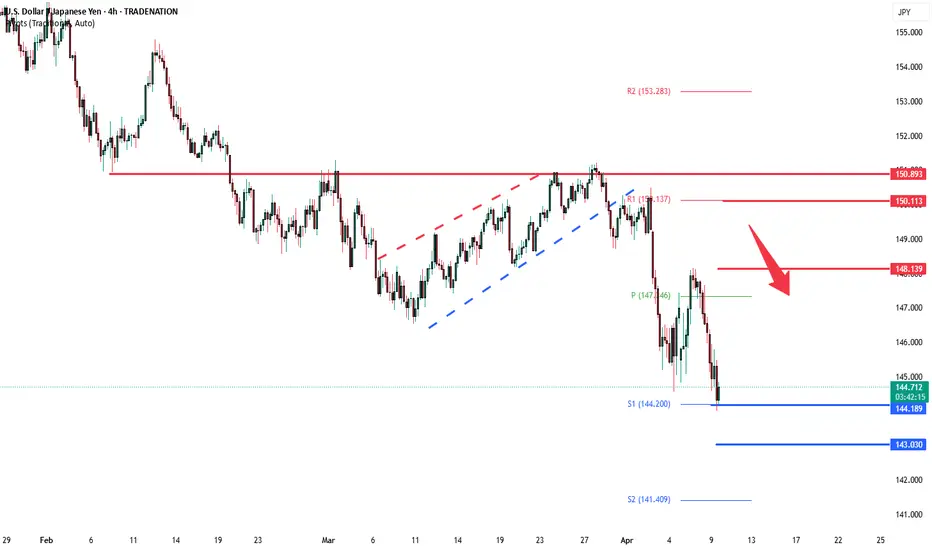
USDJPY Bearish continuation below 148.10The USDJPY currency pair remains in a bearish trend, with the recent price action showing signs of an oversold bounce. While a temporary rebound is in play, the broader sentiment remains weak unless a decisive breakout occurs.
Key Levels to Watch:
Resistance Levels: 148.10 (critical level), 150.10, 150.90
Support Levels: 144.20, 143.00, 141.40
Bearish Scenario:
A rejection from the 148.10 resistance level could reaffirm the downside bias, leading to a continuation of the bearish move toward 142.20, with extended declines targeting 143.00 and 141.40 over the longer timeframe.
Bullish Scenario:
A breakout above 148.10 with a daily close above this level would challenge the bearish sentiment, opening the door for further gains toward 150.10, followed by 150.90.
Conclusion:
The market sentiment remains bearish, with 148.10 acting as a critical resistance zone. A rejection from this level could reinforce the downtrend, while a confirmed breakout would shift the outlook to bullish, favouring further upside. Traders should closely monitor price action at this key level for confirmation.
This communication is for informational purposes only and should not be viewed as any form of recommendation as to a particular course of action or as investment advice. It is not intended as an offer or solicitation for the purchase or sale of any financial instrument or as an official confirmation of any transaction. Opinions, estimates and assumptions expressed herein are made as of the date of this communication and are subject to change without notice. This communication has been prepared based upon information, including market prices, data and other information, believed to be reliable; however, Trade Nation does not warrant its completeness or accuracy. All market prices and market data contained in or attached to this communication are indicative and subject to change without notice.
USD/JPY(20250409)Today's AnalysisMarket news:
The U.S. Customs and Border Protection Agency reiterated that the specific tax rates for each country will be announced at 12:01 a.m. on April 9.
Technical analysis:
Today's buying and selling boundaries:
146.77
Support and resistance levels
148.90
148.10
147.59
145.95
145.43
144.63
Trading strategy:
If the price breaks through 145.95, consider buying, the first target price is 146.77
If the price breaks through 145.43, consider selling, the first target price is 144.63

Yen Appreciates with Trade TurmoilThe Japanese yen rose above 146 per dollar on Wednesday, extending gains as Trump's looming tariffs drove safe-haven flows. The dollar weakened on recession fears tied to escalating trade tensions and potential Fed rate cuts. New U.S. tariffs include a 24% duty on Japanese goods and a 25% car import levy. Trump confirmed that Japan will send a delegation to renegotiate terms, while PM Ishiba urged a policy rethink. Domestically, Japan's current account surplus hit a record in February, supported by strong exports and reduced imports, boosting the yen further.
Key resistance is at 148.70, with further levels at 152.70 and 157.70. Support stands at 145.60, followed by 143.00 and 141.80.
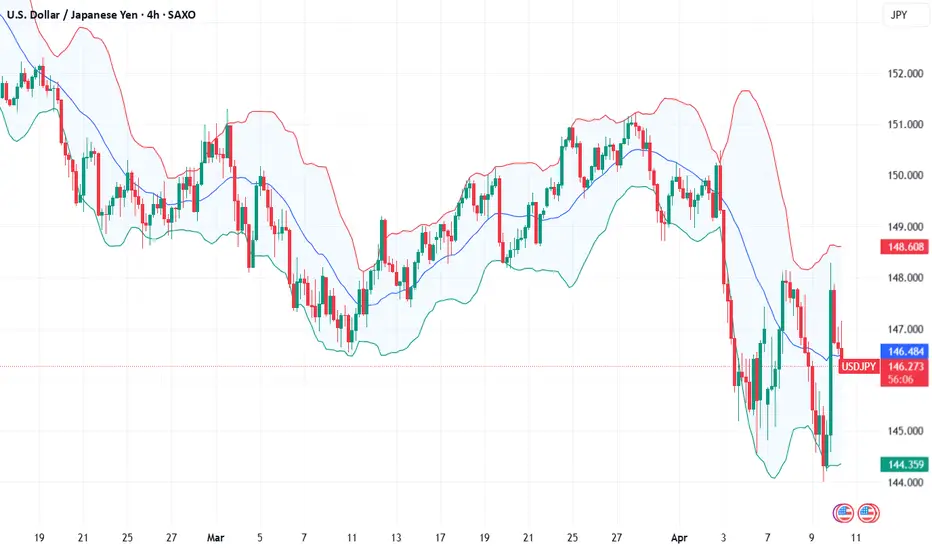
Possible Battle Between USDJPY Bulls and Bears at TrendlineUSDJPY is currently testing its weekly trendline, but recent data from Japan may challenge the possibility of a downward break.
Market turmoil has increased demand for long-term U.S. bonds, and the resulting drop in the TVC:US10Y has kept the TVC:DXY under pressure, conditions that have supported Yen bulls. However, the latest wage data out of Japan may shift the short-term outlook just as the trendline is being tested.
Base full-time wage growth dropped to 1.9% year-over-year, down from 3%. This slowdown may give the Bank of Japan more justification to hold rates steady at its next meeting. If tariff-related panic subsides with any calming news from the White House, USDJPY could see renewed upside potential.
In the short term, two resistance levels are crucial: 146.50 and 147.50. The battle between bulls and bears is likely to play out between these resistance levels and the weekly trendline near 145.
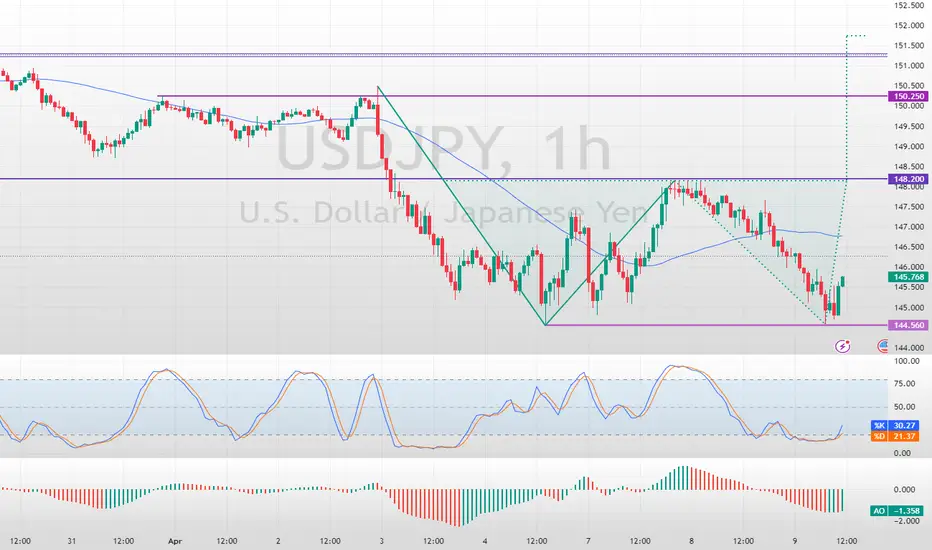
USDJPY Double Bottom PatternFenzoFx—USDJPY formed a double bottom pattern, which is a bullish signal. The immediate support is at 144.56. If this level holds, the currency pair could rise toward 148.2. Traders should monitor this level for bearish signals.
Please note that the bullish outlook should be invalidated if USD/JPY dips below the immediate support.