Yen Appreciates with Trade TurmoilThe Japanese yen rose above 146 per dollar on Wednesday, extending gains as Trump's looming tariffs drove safe-haven flows. The dollar weakened on recession fears tied to escalating trade tensions and potential Fed rate cuts. New U.S. tariffs include a 24% duty on Japanese goods and a 25% car import levy. Trump confirmed that Japan will send a delegation to renegotiate terms, while PM Ishiba urged a policy rethink. Domestically, Japan's current account surplus hit a record in February, supported by strong exports and reduced imports, boosting the yen further.
Key resistance is at 148.70, with further levels at 152.70 and 157.70. Support stands at 145.60, followed by 143.00 and 141.80.
USDJPY
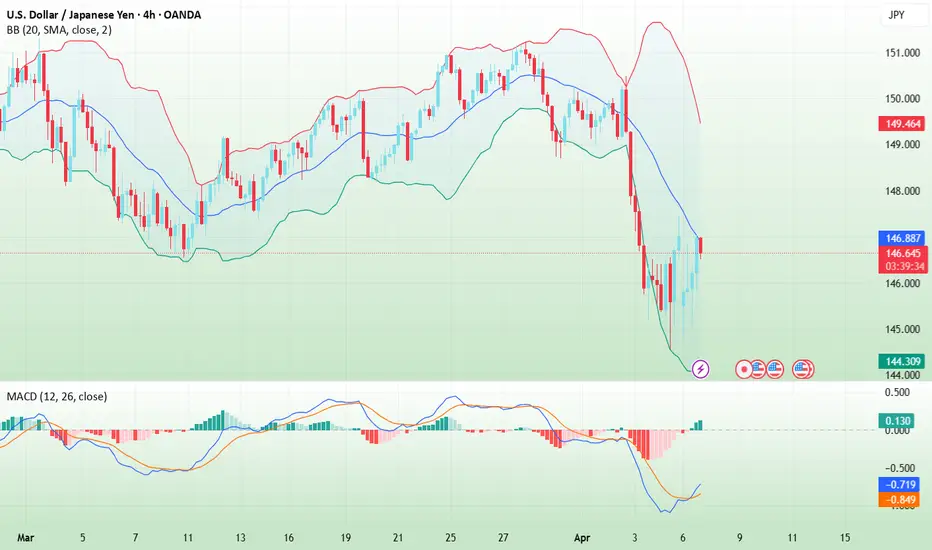
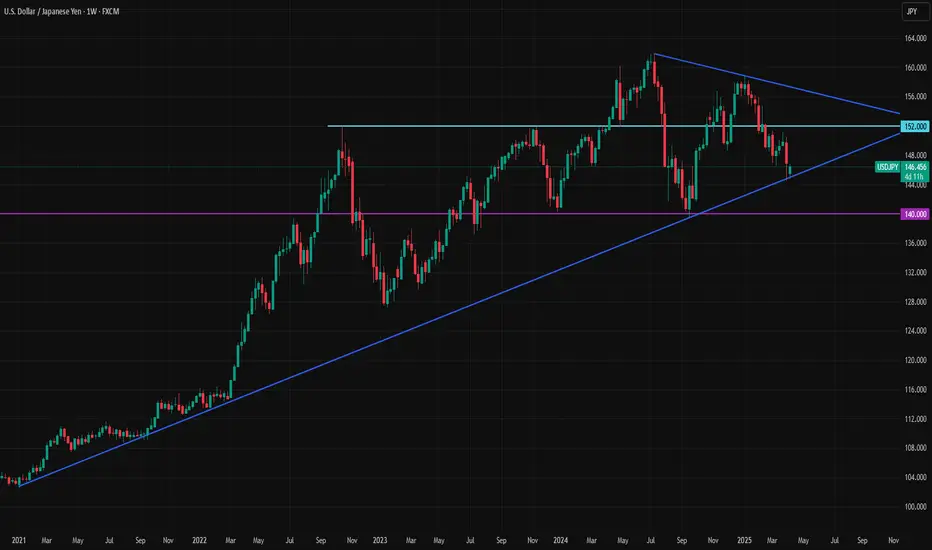
Possible Battle Between USDJPY Bulls and Bears at TrendlineUSDJPY is currently testing its weekly trendline, but recent data from Japan may challenge the possibility of a downward break.
Market turmoil has increased demand for long-term U.S. bonds, and the resulting drop in the TVC:US10Y has kept the TVC:DXY under pressure, conditions that have supported Yen bulls. However, the latest wage data out of Japan may shift the short-term outlook just as the trendline is being tested.
Base full-time wage growth dropped to 1.9% year-over-year, down from 3%. This slowdown may give the Bank of Japan more justification to hold rates steady at its next meeting. If tariff-related panic subsides with any calming news from the White House, USDJPY could see renewed upside potential.
In the short term, two resistance levels are crucial: 146.50 and 147.50. The battle between bulls and bears is likely to play out between these resistance levels and the weekly trendline near 145.
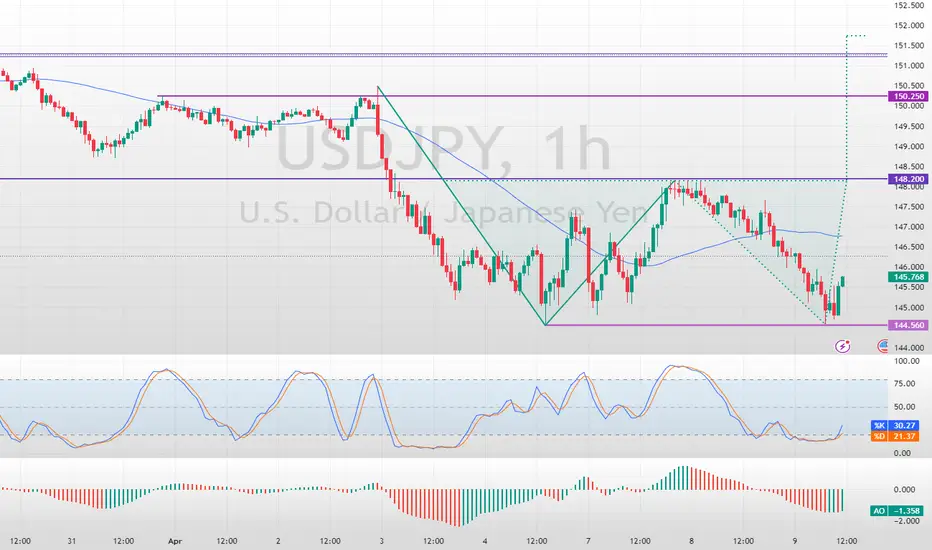
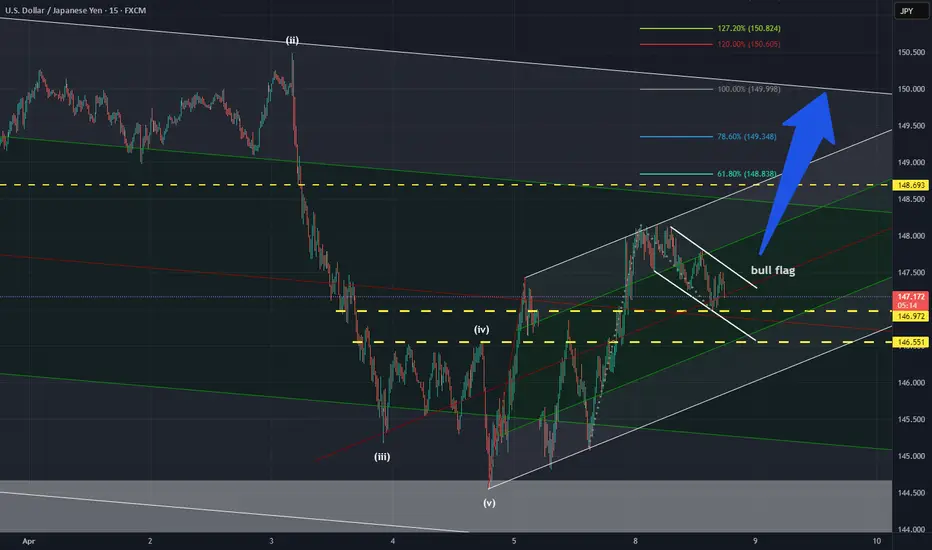
USDJPY Double Bottom PatternFenzoFx—USDJPY formed a double bottom pattern, which is a bullish signal. The immediate support is at 144.56. If this level holds, the currency pair could rise toward 148.2. Traders should monitor this level for bearish signals.
Please note that the bullish outlook should be invalidated if USD/JPY dips below the immediate support.
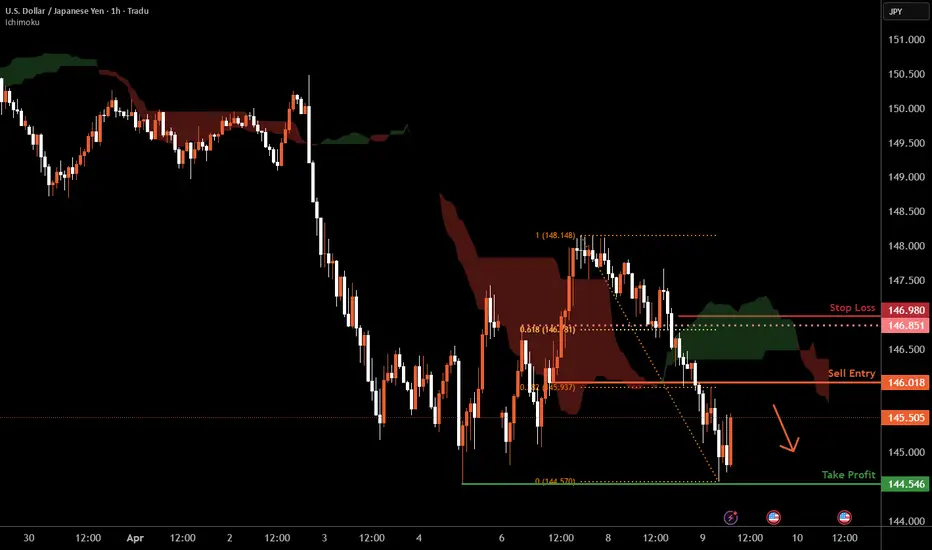
USD/JPY H1 | Pullback resistance at 38.2% Fibonacci retracementUSD/JPY is rising towards a pullback resistance and could potentially reverse off this level to drop lower.
Sell entry is at 146.018 which is a pullback resistance that aligns with the 38.2% Fibonacci retracement.
Stop loss is at 146.98 which is a level that sits above the 61.8% Fibonacci retracement and an overlap resistance.
Take profit is at 144.54 which is a multi-swing-low support.
High Risk Investment Warning
Trading Forex/CFDs on margin carries a high level of risk and may not be suitable for all investors. Leverage can work against you.
Stratos Markets Limited (tradu.com):
CFDs are complex instruments and come with a high risk of losing money rapidly due to leverage. 63% of retail investor accounts lose money when trading CFDs with this provider. You should consider whether you understand how CFDs work and whether you can afford to take the high risk of losing your money.
Stratos Europe Ltd (tradu.com):
CFDs are complex instruments and come with a high risk of losing money rapidly due to leverage. 63% of retail investor accounts lose money when trading CFDs with this provider. You should consider whether you understand how CFDs work and whether you can afford to take the high risk of losing your money.
Stratos Global LLC (tradu.com):
Losses can exceed deposits.
Please be advised that the information presented on TradingView is provided to Tradu (‘Company’, ‘we’) by a third-party provider (‘TFA Global Pte Ltd’). Please be reminded that you are solely responsible for the trading decisions on your account. There is a very high degree of risk involved in trading. Any information and/or content is intended entirely for research, educational and informational purposes only and does not constitute investment or consultation advice or investment strategy. The information is not tailored to the investment needs of any specific person and therefore does not involve a consideration of any of the investment objectives, financial situation or needs of any viewer that may receive it. Kindly also note that past performance is not a reliable indicator of future results. Actual results may differ materially from those anticipated in forward-looking or past performance statements. We assume no liability as to the accuracy or completeness of any of the information and/or content provided herein and the Company cannot be held responsible for any omission, mistake nor for any loss or damage including without limitation to any loss of profit which may arise from reliance on any information supplied by TFA Global Pte Ltd.
The speaker(s) is neither an employee, agent nor representative of Tradu and is therefore acting independently. The opinions given are their own, constitute general market commentary, and do not constitute the opinion or advice of Tradu or any form of personal or investment advice. Tradu neither endorses nor guarantees offerings of third-party speakers, nor is Tradu responsible for the content, veracity or opinions of third-party speakers, presenters or participants.
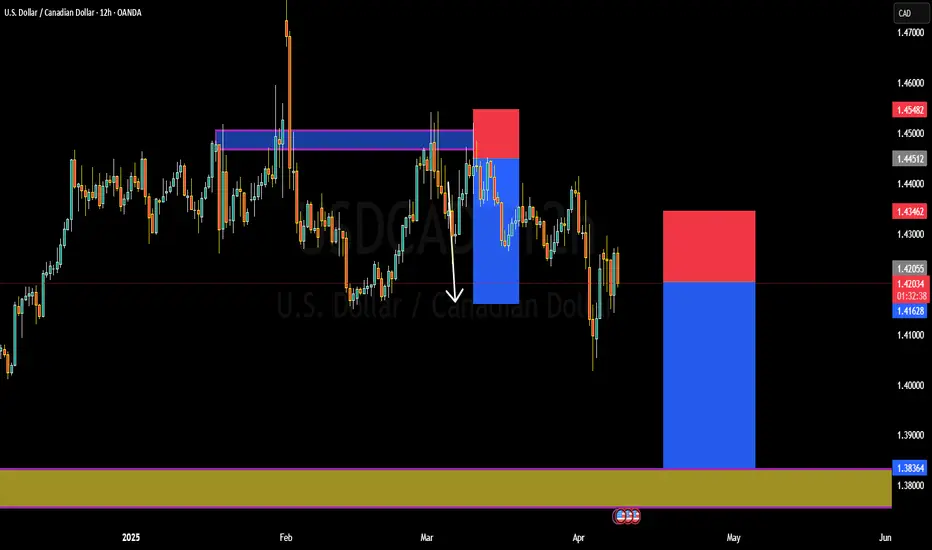
USDCAD IS DRROPPING. DETAILED TECHNICAL AND FUNDAMENTALSUSDCAD is currently trading around 1.4200 after a clean retest of a previously broken support zone, which has now turned into a strong resistance level. Price action is confirming the bearish structure as we see a gradual yet consistent drop from the highs of 1.4540. With the rejection seen from the supply zone and recent lower high formation, momentum is shifting further in favor of the sellers. I am now targeting 1.3800 for the next key level, aligning with both technical confluence and fundamental sentiment.
Technically, the structure is clear: we had a failed breakout above 1.4450, followed by a decisive bearish engulfing move. The market then completed a textbook retest at the 1.4340–1.4450 supply zone before resuming the downside move. The current formation on the 12H chart shows a lower low and lower high sequence intact, signaling a trend continuation to the downside. The highlighted zones also provide ideal reward-to-risk setups for continuation traders.
From a fundamental perspective, the Canadian dollar is gaining strength due to rising oil prices, with WTI crude now climbing back above the $85 mark. This directly supports the loonie given Canada’s oil-export-driven economy. Meanwhile, US economic uncertainty around upcoming CPI data and shifting Fed rate cut expectations continue to weigh on the dollar’s upside momentum. Additionally, recent risk-on sentiment in global markets is pushing flows into commodity-linked currencies like CAD.
With technicals and fundamentals aligning, I remain firmly bearish on USDCAD. As long as price remains below the 1.4340 resistance, I’m looking for continuation toward the major demand zone near 1.3830–1.3800. This setup offers a clean 1:3+ risk-to-reward profile, and I will be scaling in further on bearish confirmations as the market progresses.
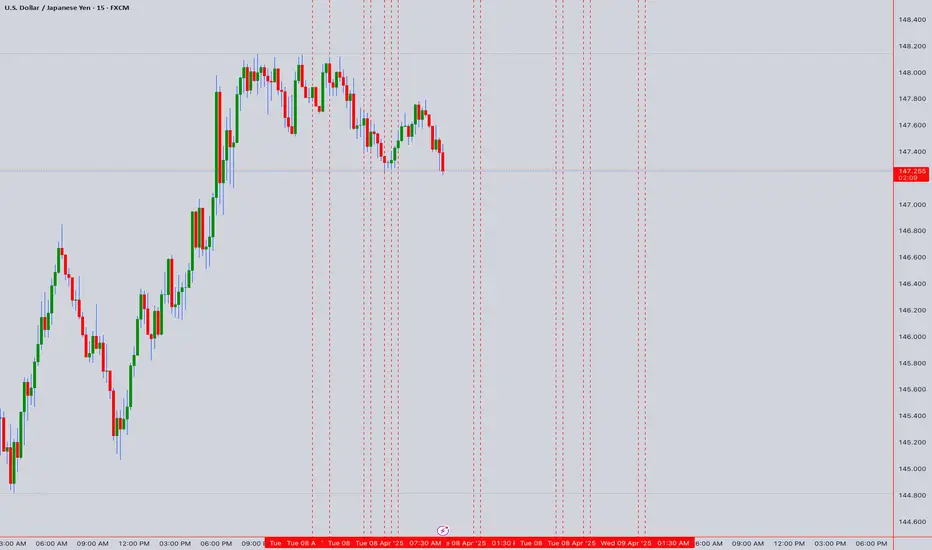
USDJPY Analysis: Reversal Estimations Based on Trading MathDear Trader,
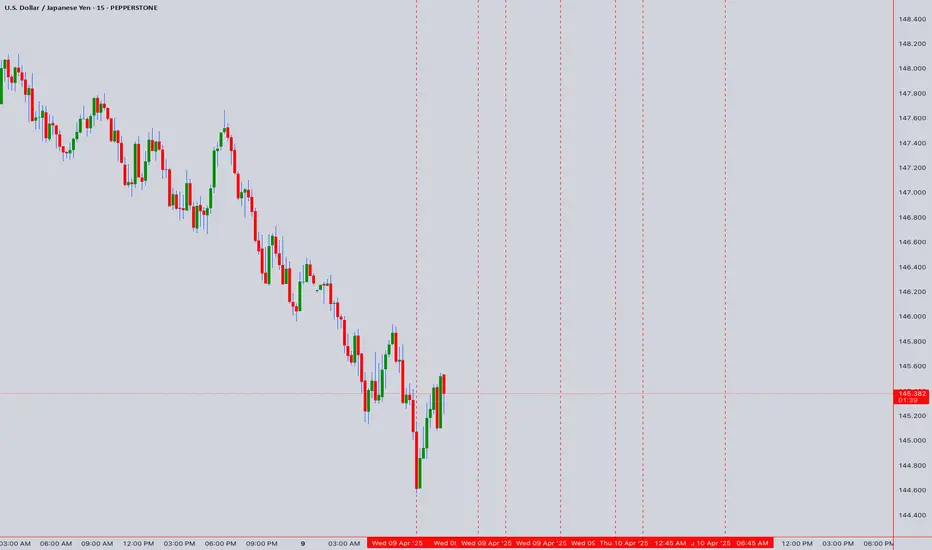
Please find attached my analysis of $Subject, which uses mathematical calculations to identify potential reversal times and price levels. The analysis details projected south and north price targets (horizontal lines on the chart), along with estimated time frames for possible reversals (vertical lines on the chart, accurate to within +/- 1-2 candles). Please note that all times indicated on the chart, including the vertical lines representing potential reversal times, are based on the UTC+4 time zone.
To increase the probability of these analyses, I recommend monitoring the 5-minute and 15-minute charts for the following key reversal candlestick patterns:
Doji’s
Double Bottom/Top
Engulfing Bullish /Bearish
Hanging Man
Hammer/Inverted Hammer
Morning Star
Shooting Star
Triple Top/Bottom
For those interested in further developing their trading skills based on these types of analyses, consider exploring the mentoring program offered by Shunya Trade.
I welcome your feedback on this analysis, as it will inform and enhance my future work.
Regards,
Shunya Trade
Price levels
Price DH Price DL
144.52194 144.63007
144.48096 144.67107
144.38595 144.76618
144.19602 144.95648
144.00622 145.14691
143.81654 145.33746
143.62698 145.52814
143.43756 145.71894
143.24825 145.90987
143.05907 146.10093
142.30361 146.86639
141.55015 147.63385
140.79868 148.40332
140.04922 149.17478
139.30176 149.94824
138.55630 150.72370
137.81283 151.50117
137.07137 152.28063
⚠️ Disclaimer: This post is educational content and does not constitute investment advice, financial advice, or trading recommendations. The views expressed here are based on technical analysis and are shared solely for informational purposes. The stock market is subject to risks, including capital loss, and readers should exercise due diligence before investing. We do not take responsibility for decisions made based on this content. Consult a certified financial advisor for personalized guidance.
Eur/Usd sell setup update!!Good day traders, we back again we another beauty of a setup well Atleast I like to believe that😂.
Eur/Usd a set was posted here by me on TradingView before market opened on Monday and if you go look at that set up today’s move was seen before hand and now that price went higher, we can now expect to see price move lower for the rest of the week to our liquidity resting below(equal lows). On the 4 hour price just broke structure higher solidifying a low that we want to see get broken during today trading day.
As soon as price breaks structure lower on the LTF’s than we have a alert to enter our shorts, good luck and have a wonderful day✌️
My name is Teboho Matla but you don’t know me yet…

Usdjpy 8 Apr updateAs per last usdjpy post, price formed 5 waves down which signal end of a phase.
Price indeed move up and now formed a more bullish outlook.
Maybe mr market is trapping all those bears and going to hunt their stops, as traders thought shorting usdjpy is easy money for risk aversion(Tariffs war).
Anyway, the move up had given a few hundred pips of profit, closed most and running the rest up, "if it works...lol"

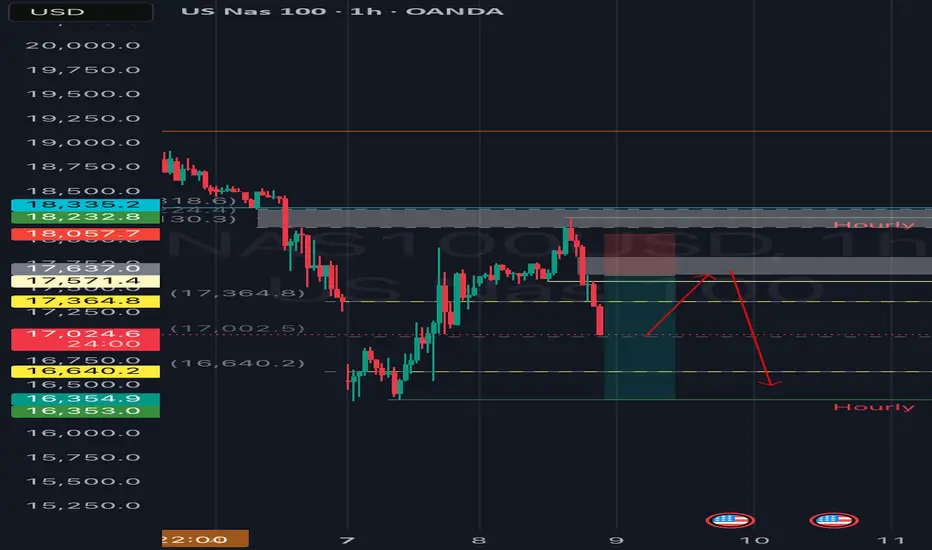
Nas100 continuation lower?Good evening traders, I am busy with my market recap and I saw this beautiful idea on nas100/US100 or whatever name your broker uses.
Indices have been pretty bearish from our understanding as we saw price crush, well my thought process when analysing chart is question based, question like did price move above our weekly opening price to give us our manipulation phase in the power of 3, and in this case or in the case of this analysis the answer is yes it moved higher following this week’s open. Today in the 1 hour TF we have a structure shift lower and before we can do anything we need to see price come higher to Atleast the FVG that is marked on the chart, I know ICT teaches deeper about FVG but for me it’s fine for price to completely cover it. Or if maybe the OTE(optimal trade entry) is the method you use to enter trades it’s still fine or even order blocks if maybe you can see any than it’s also completely fine.
Currently price is showing momentum lower and maybe it’ll close prices lower but if we close the daily candle above the midpoint of the weekly gap we can expect price go than trigger the limit.
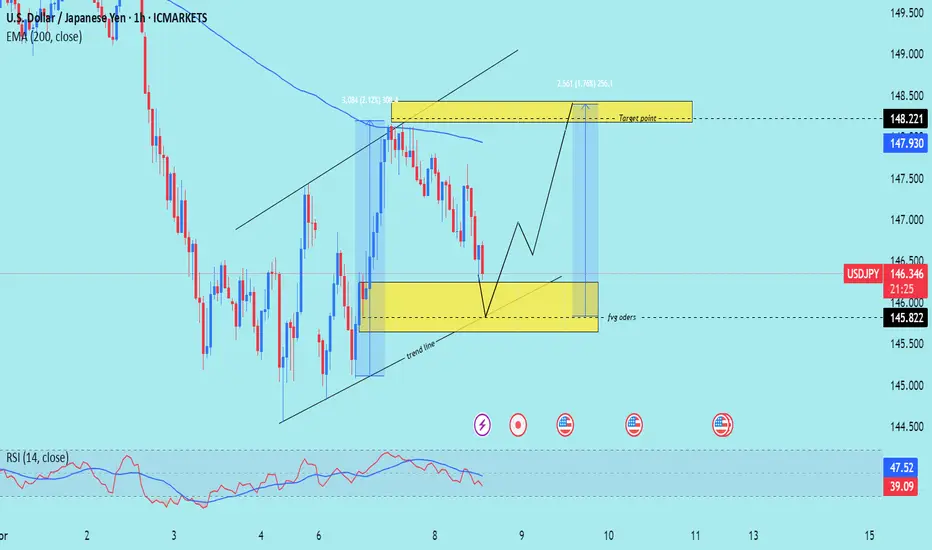
USD/JPY) Bullish reversal analysis Read The ChaptianSMC Trading point update
This chart is for USD/JPY on the 1-hour timeframe, and it presents a bullish trade setup. Let’s break down the idea
---
Key Observations:
1. Current Price:
USD/JPY is trading around 146.281.
2. Overall Bias:
Bullish setup expecting a bounce from demand into a higher target zone.
3. EMA 200:
Price is currently below the 200 EMA (147.942), which usually suggests a bearish trend — but this setup is aiming for a short-term bullish retracement.
4. Demand Zone (Buy Area):
Marked in yellow between 145.822 and slightly above.
Labeled as "FVG orders" (Fair Value Gap), suggesting institutional interest or imbalance fill.
5. Trendline Support:
The price is approaching a rising trendline, adding confluence for a potential bounce.
6. Expected Move:
Price is expected to bounce from the demand zone, form a higher low, and then move up toward the target zone at 148.221.
Two upside targets are drawn:
First Move: ~1.12% (30.6 pips)
Full Target: ~1.76% (256.1 pips)
Mr SMC Trading point
7. RSI (Relative Strength Index):
RSI is around 37.66, nearing oversold territory, supporting a bullish reversal idea.
---
Trade Idea Summary:
Bias: Bullish
Entry Zone: Around 145.822 (fair value gap & trendline support)
Target Zone: 148.221
Stop Loss: Likely just below the demand zone or trendline
Confluence Factors:
Trendline support
RSI nearing oversold
Fair value gap zone
EMA 200 overhead (target acts as resistance)
---
Pelas support boost 🚀 analysis follow
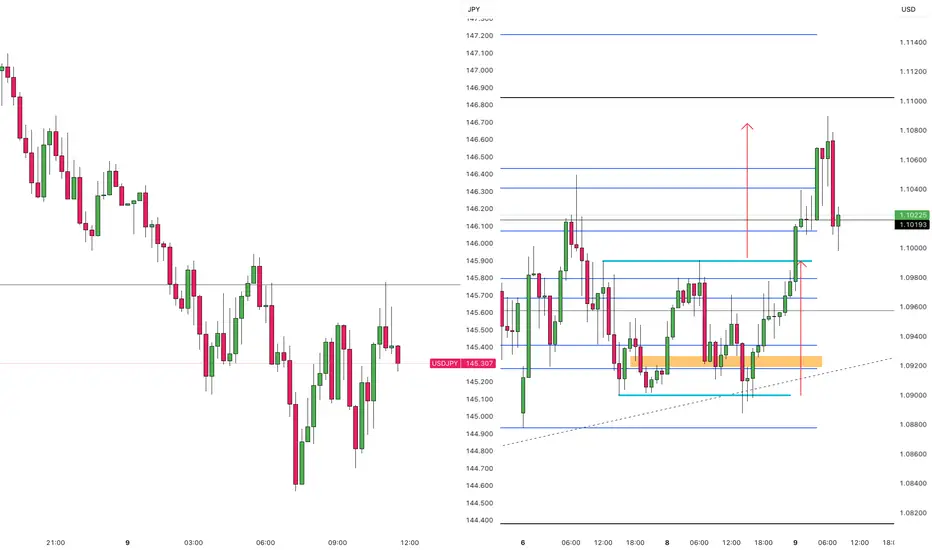
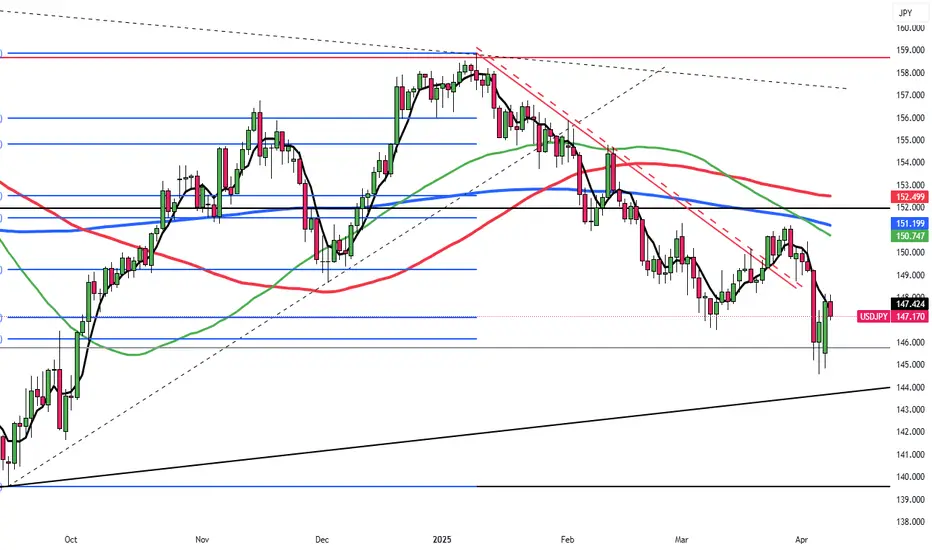
USDJPY Breakdown?Hello traders, this is a complete multiple timeframe analysis of this pair. We see could find significant trading opportunities as per analysis upon price action confirmation we may take this trade. Smash the like button if you find value in this analysis and drop a comment if you have any questions or let me know which pair to cover in my next analysis.

Yen Climbs on Trade Talks, Record SurplusThe Japanese yen climbed toward 147 per dollar on Tuesday, reversing losses as trade uncertainty lifted safe-haven demand. Trump agreed to begin trade talks with Japan after speaking with PM Shigeru Ishiba and Treasury Secretary Scott Bessent to lead talks covering tariffs, currency, and subsidies. Trump denied delaying tariffs, saying they may stay indefinitely. Domestically, Japan’s current account surplus hit a record high in February, backed by strong exports and lower imports, further supporting the yen.
Key resistance is at 148.70, with further levels at 152.70 and 157.70. Support stands at 145.60, followed by 143.00 and 141.80.
USD/JPY M30 | Falling to overlap supportUSD/JPY is falling towards an overlap support and could potentially bounce off this level to climb higher.
Buy entry is at 146.62 which is an overlap support that aligns with the 38.2% Fibonacci retracement.
Stop loss is at 145.71 which is a level that lies underneath a swing-low support and the 61.8% Fibonacci retracement.
Take profit is at 148.09 which is a multi-swing-high resistance that aligns with the 61.8% Fibonacci retracement.
High Risk Investment Warning
Trading Forex/CFDs on margin carries a high level of risk and may not be suitable for all investors. Leverage can work against you.
Stratos Markets Limited (www.fxcm.com):
CFDs are complex instruments and come with a high risk of losing money rapidly due to leverage. 63% of retail investor accounts lose money when trading CFDs with this provider. You should consider whether you understand how CFDs work and whether you can afford to take the high risk of losing your money.
Stratos Europe Ltd (www.fxcm.com):
CFDs are complex instruments and come with a high risk of losing money rapidly due to leverage. 63% of retail investor accounts lose money when trading CFDs with this provider. You should consider whether you understand how CFDs work and whether you can afford to take the high risk of losing your money.
Stratos Trading Pty. Limited (www.fxcm.com):
Trading FX/CFDs carries significant risks. FXCM AU (AFSL 309763), please read the Financial Services Guide, Product Disclosure Statement, Target Market Determination and Terms of Business at www.fxcm.com
Stratos Global LLC (www.fxcm.com):
Losses can exceed deposits.
Please be advised that the information presented on TradingView is provided to FXCM (‘Company’, ‘we’) by a third-party provider (‘TFA Global Pte Ltd’). Please be reminded that you are solely responsible for the trading decisions on your account. There is a very high degree of risk involved in trading. Any information and/or content is intended entirely for research, educational and informational purposes only and does not constitute investment or consultation advice or investment strategy. The information is not tailored to the investment needs of any specific person and therefore does not involve a consideration of any of the investment objectives, financial situation or needs of any viewer that may receive it. Kindly also note that past performance is not a reliable indicator of future results. Actual results may differ materially from those anticipated in forward-looking or past performance statements. We assume no liability as to the accuracy or completeness of any of the information and/or content provided herein and the Company cannot be held responsible for any omission, mistake nor for any loss or damage including without limitation to any loss of profit which may arise from reliance on any information supplied by TFA Global Pte Ltd.
The speaker(s) is neither an employee, agent nor representative of FXCM and is therefore acting independently. The opinions given are their own, constitute general market commentary, and do not constitute the opinion or advice of FXCM or any form of personal or investment advice. FXCM neither endorses nor guarantees offerings of third-party speakers, nor is FXCM responsible for the content, veracity or opinions of third-party speakers, presenters or participants.

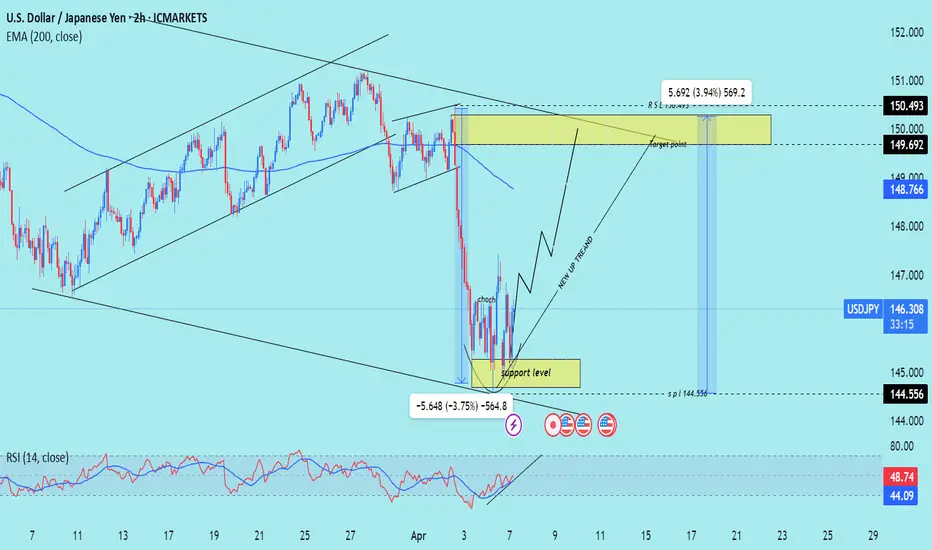
USD/JPY) bullish trend analysis Read The ChaptianSMC Trading point update
This chart is an analysis of the USD/JPY currency pair on a 2-hour timeframe, and it presents a possible bullish scenario. Here’s a breakdown of the idea:
---
Key Points of the Analysis:
1. Support Level & Change of Character (ChoCH):
Price found strong support around 144.556.
A ChoCH (Change of Character) is noted, indicating a potential shift from a bearish to a bullish trend.
2. Bullish Reversal Setup:
The price is forming higher lows, suggesting the start of a "New Up Trend".
There's a clear zig-zag bullish projection, suggesting potential long opportunities.
3. Target Zones:
The first target point is in the range of 149.692 – 150.493.
This area is also marked with a resistance zone, making it a logical TP (Take Profit) level.
4. Risk/Reward Ratio:
The risk is around -3.75% (-564.8 pips), and the reward is around +3.94% (+569.2 pips), suggesting a 1:1.05 R/R ratio.
5. RSI Indicator (Below):
RSI is showing a bullish divergence (price made lower lows while RSI made higher lows).
This divergence supports the idea of a possible bullish reversal.
6. 200 EMA:
The 200 EMA is at 148.767, acting as a dynamic resistance. Price may react around that level before hitting the final target zone.
Mr SMC Trading point
---
Conclusion:
This analysis suggests a potential long trade setup on USD/JPY based on:
A support zone,
Bullish RSI divergence,
Market structure shift (ChoCH),
And projected movement toward 149.692–150.493.
Idea: Buy near the support zone (~144.556) and target the resistance zone (~150.493) while managing risk carefully.
---
Pales support boost 🚀 analysis follow)
USDJPY Analysis: Reversal Forecasts Based on Trading MathDear Trader,
Please find attached my analysis of $Subject, which uses mathematical calculations to identify potential reversal times and price levels.
The analysis details projected south and north price targets (horizontal lines on the chart), along with estimated time frames for possible reversals (vertical lines on the chart, accurate to within +/- 1-2 candles). Please note that all times indicated on the chart, including the vertical lines representing potential reversal times, are based on the UTC+4 time zone.
To increase the probability of these analyses, I recommend monitoring the 5-minute and 15-minute charts for the following key reversal candlestick patterns:
Doji’s
Hammer/Inverted Hammer
Double/Triple Bottom/Top
Shooting Star
Morning Star
Hanging Man
For those interested in further developing their trading skills based on these types of analyses, consider exploring the mentoring program offered by Shunya Trade.
I welcome your feedback on this analysis, as it will inform and enhance my future work.
Regards,
Shunya Trade
151.17 145.09
154.26 142.09
160.53 136.19
166.93 130.42
173.45 124.77
180.10 119.25
186.87 113.85
193.77 108.58
⚠️ Disclaimer: This post is educational content and does not constitute investment advice, financial advice, or trading recommendations. The views expressed here are based on technical analysis and are shared solely for informational purposes. The stock market is subject to risks, including capital loss, and readers should exercise due diligence before investing. We do not take responsibility for decisions made based on this content. Consult a certified financial advisor for personalized guidance.
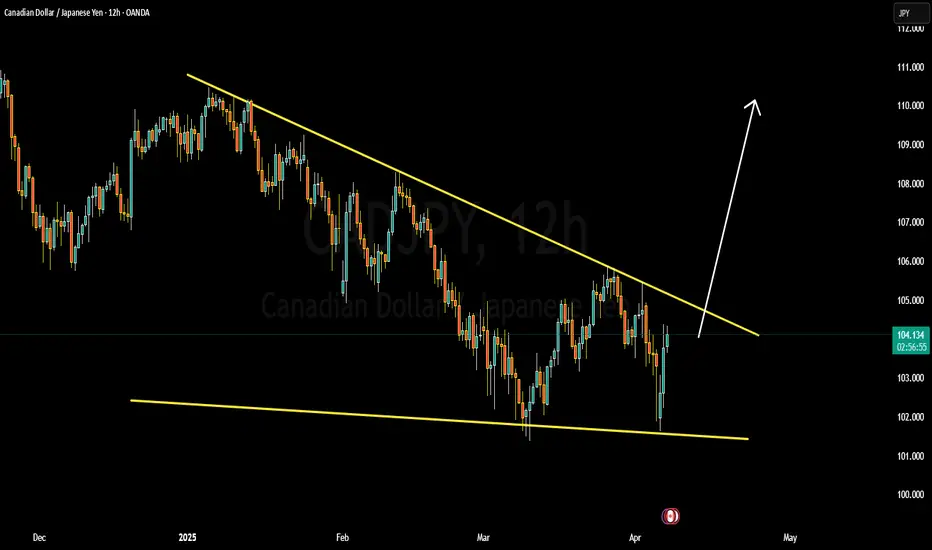
WHY CADJPY IS BULLISH ?? DETAILED ANALYSIS CAD/JPY is currently trading around 104.200, forming a falling wedge pattern—a technical indicator often suggestive of a potential bullish reversal. Traders are closely monitoring this setup for a breakout, which could potentially propel the pair toward the target price of 107.000, indicating a prospective gain of approximately 300 pips.
Fundamentally, the Canadian dollar's performance is closely tied to global oil prices, given Canada's status as a major oil exporter. Recent stability in oil markets has provided underlying support to the loonie. Conversely, the Japanese yen, traditionally viewed as a safe-haven currency, has experienced fluctuations influenced by shifts in global risk sentiment and the Bank of Japan's monetary policy stance. The divergence in economic indicators and central bank policies between Canada and Japan may contribute to the anticipated bullish momentum in the CAD/JPY pair.
Technical analysis reinforces this outlook. The falling wedge pattern observed on the charts is characterized by converging trendlines sloping downward, indicating diminishing bearish momentum. A decisive breakout above the upper trendline of the wedge, accompanied by increased trading volume, would serve as a confirmation of the bullish reversal. Key resistance levels to monitor include 105.000 and 106.000, with a sustained move above these thresholds enhancing the likelihood of reaching the 107.000 target.
Traders should exercise prudent risk management strategies, such as setting appropriate stop-loss orders, to mitigate potential market volatility. Additionally, staying informed about upcoming economic data releases and central bank communications from both Canada and Japan will be crucial in navigating this trade effectively. By aligning technical insights with fundamental developments, traders can position themselves to capitalize on the potential bullish breakout in the CAD/JPY pair.
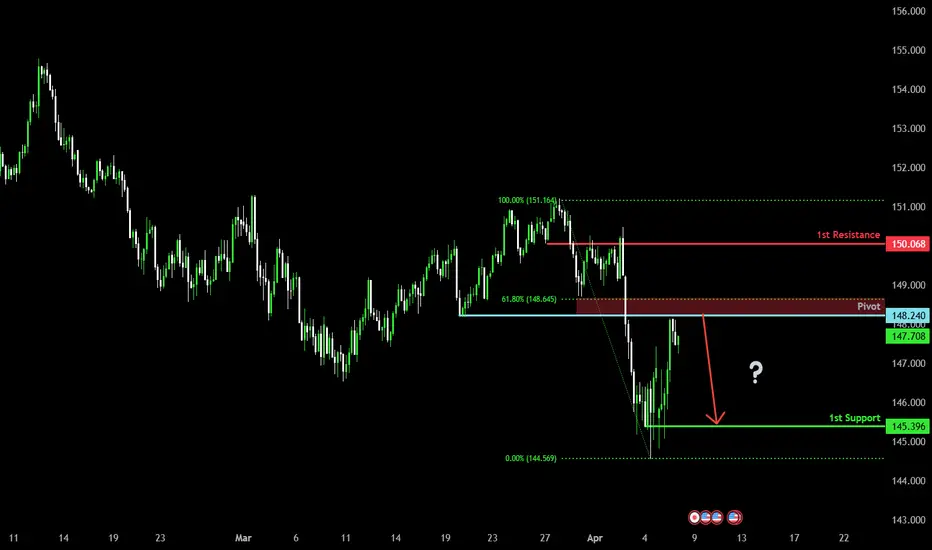
Bearish drop?USD/JPY has reacted off the pivot and could drop to the 1st support which has been identified as a pullback support.
Pivot: 148.24
1st Support: 145.39
1st Resistance: 150.06
Risk Warning:
Trading Forex and CFDs carries a high level of risk to your capital and you should only trade with money you can afford to lose. Trading Forex and CFDs may not be suitable for all investors, so please ensure that you fully understand the risks involved and seek independent advice if necessary.
Disclaimer:
The above opinions given constitute general market commentary, and do not constitute the opinion or advice of IC Markets or any form of personal or investment advice.
Any opinions, news, research, analyses, prices, other information, or links to third-party sites contained on this website are provided on an "as-is" basis, are intended only to be informative, is not an advice nor a recommendation, nor research, or a record of our trading prices, or an offer of, or solicitation for a transaction in any financial instrument and thus should not be treated as such. The information provided does not involve any specific investment objectives, financial situation and needs of any specific person who may receive it. Please be aware, that past performance is not a reliable indicator of future performance and/or results. Past Performance or Forward-looking scenarios based upon the reasonable beliefs of the third-party provider are not a guarantee of future performance. Actual results may differ materially from those anticipated in forward-looking or past performance statements. IC Markets makes no representation or warranty and assumes no liability as to the accuracy or completeness of the information provided, nor any loss arising from any investment based on a recommendation, forecast or any information supplied by any third-party.
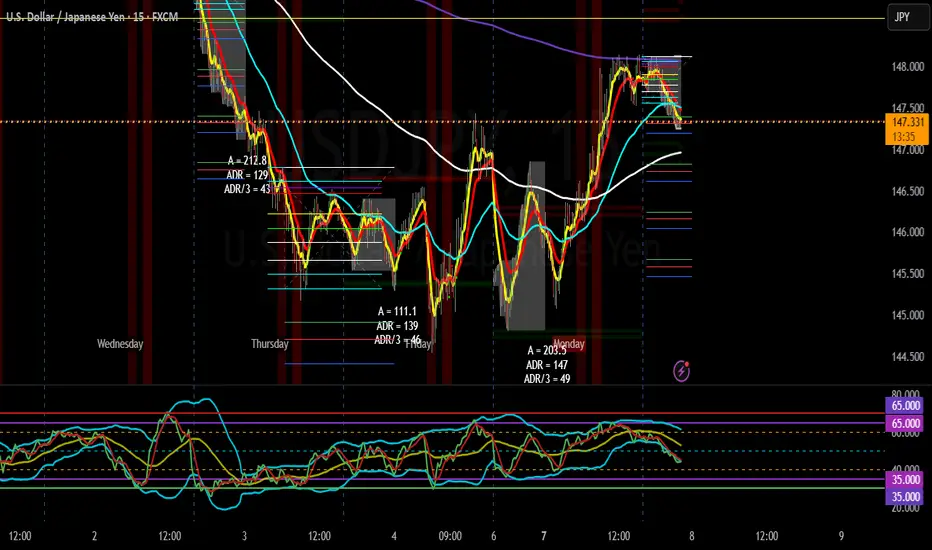
Tyree Thomas Jr USD/JPY Bias 4/7/25I believe that U/J will sell to my take profit at the green Fib extension. I will be posting my trade ideas every evening. I use the Fibonacci Retracement tool, the Fibonacci Extension tool, Six EMA's, Market Structure, and the TDIGM in my trading strategy to create my Bias.
USD/JPY(20250408)Today's AnalysisToday's buying and selling boundaries:
146.92
Support and resistance levels
150.22
148.99
148.18
145.65
144.85
143.61
Trading strategy:
If the price breaks through 148.18, consider buying, the first target price is 148.99
If the price breaks through 146.92, consider selling, the first target price is 145.65

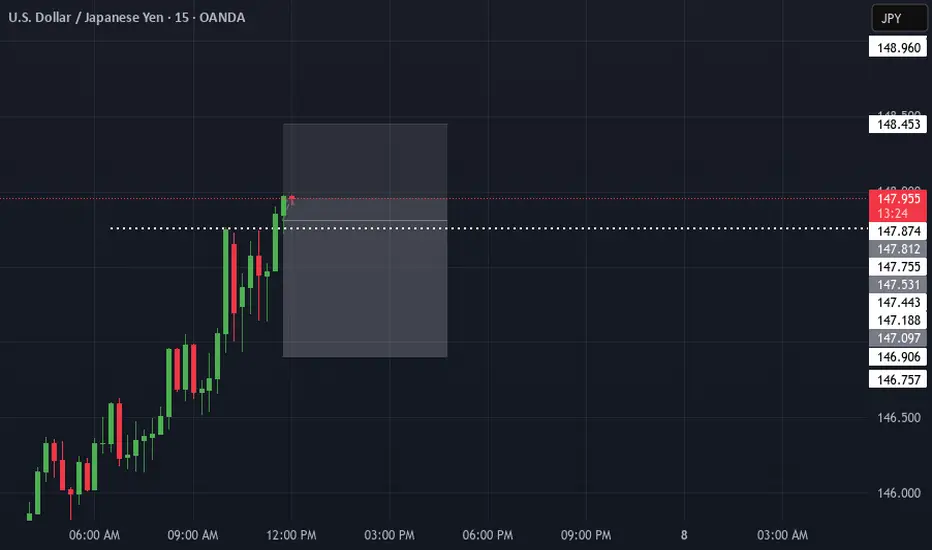
Usdjpy BuyUsdjpy just had some heavy sell at 10:15 but still had enough bulls in it to break that high at 10:00. it just also broke 147.770 which was an important key level.
USDJPY Will Collapse! SELL!
My dear friends,
My technical analysis for USDJPY is below:
The market is trading on 147.18 pivot level.
Bias - Bearish
Technical Indicators: Both Super Trend & Pivot HL indicate a highly probable Bearish continuation.
Target - 146.37
About Used Indicators:
A pivot point is a technical analysis indicator, or calculations, used to determine the overall trend of the market over different time frames.
Disclosure: I am part of Trade Nation's Influencer program and receive a monthly fee for using their TradingView charts in my analysis.
———————————
WISH YOU ALL LUCK

USD/JPY(20250407)Today's AnalysisMarket news:
Fed Chairman Powell: Wait for clearer news before considering adjusting policy stance. One year later, as the impact of Trump's policies becomes clearer, uncertainty should be greatly reduced. Intends to complete the entire term. Potential tariffs may have a lasting impact on inflation. The impact of tariffs on the economy may be greater than expected. Downside risks have increased, but the economy is still in good shape.
Technical analysis:
Today's buying and selling boundaries:
146.32
Support and resistance levels
149.17
148.11
147.41
145.22
144.53
143.46
Trading strategy:
If the price breaks through 146.32, consider buying, the first target price is 147.41
If the price breaks through 145.22, consider selling, the first target price is 144.53