DXY to 80? ...Tariffs the First Domino in a Multi-Year Collapse?This is a pure technical walkthrough of the U.S. Dollar Index—no fluff, no indicators, no fundamentals. Just market structure, smart money, and liquidity concepts.
Back on January 14th , I posted about a potential 20%+ drop in the DXY — you can view it here . This video builds on that thesis and walks you through the full technical story from 1986 to today , including accumulation cycles, yearly trap zones, and my long-term target of 80. Am I crazy? Maybe. Let's see if I can convince you to be crazy too 😜
There is a video breakdown above, and a written breakdown below.
Here are timestamps if you want to jump around the video:
00:00 – The Case for $80: Not as Crazy as It Sounds
02:30 – The 0.786 Curse: Why the Dollar Keeps Faking Out
06:15 – How Smart Money Really Moves: The 4-Phase Playbook
12:30 – The Trap Is Set: Yearly Highs as Liquidity Bait
20:00 – Inside the Mind of the Market: 2010–2025 Unpacked
25:00 – The Bear Channel No One’s Talking About
36:00 – The First Domino: Is the Dollar’s Slide Just Beginning?
👇 If you're a visual learner, scroll down—each chart tells part of the story.
Chart: Monthly View – Three Highs, .786 Retraces, and Trendline Breaks
History doesn’t repeat, but it sure rhymes.
Each major DXY rally has formed a sequence of three swing highs right after a break of trendline structure. In both instances, price retraced to the .786 level on the yearly closes—an often overlooked fib level that institutional players respect.
We’re now sitting at a high again. You’ll notice price has already reversed from that zone. That doesn’t guarantee a collapse, but when we line it up with other confluences (next charts), the probability of a deeper markdown becomes hard to ignore.
I'd also like to note that all of the highlighted moves, are 2-3 year trend runs. Which means if we are bearish, this could be the exact start of a 2-3 bear market.
Market Phases Since 1986
This chart illustrates how DXY has moved through repeating cycles of:
🟡 Accumulation: Smart money building positions quietly.
🔵 Markup: Price accelerates with buy orders + media hype.
🟣 Distribution: Smart money sells to latecomers.
🔴 Markdown: Public panic → smart money reloads.
If we are indeed entering another markdown phase, this would align perfectly with the pattern seen over the past 40 years.
You’ll also notice the "Point of Control" (POC) zones—volume-based magnets that price often returns to. These spots often act as the origin of the move, and as such, they make for strong targets and areas of interest.
Liquidity Zones and Stop Loss Traps
This is where it gets juicy.
The majority of breakout traders placed long entries at the blue lines—above swing highs, thinking resistance was broken. But what’s under those highs? Stop loss clusters.
Institutions use these areas as liquidity harvests.
Several key levels are marked as “OPEN” in this chart, meaning price has yet to return to sweep those orders. That’s why I’m expecting price to begin seeking out that liquidity over the coming months.
There's also an imbalance gap (thin price action) around the 85–86 zone. If price falls into that trap door, there’s nothing to stop it until the 80s.
The 2025 Outlook
Here’s how I’m approaching this year:
✅ Bearish bias under 105
🎯 Targets at 100, 95, and 90
🚪 Trap door under 86 if volume is thin
Price is currently stuck under the recent point of control and showing signs of distribution. If that level continues to hold as resistance, we could see a multi-leg push downward, with the 100 and 95 zones acting as check-in points.
If we break under the 90s and enter the imbalance zone, 80 becomes more than just possible—it becomes probable.
🗣️ Let’s Sharpen Together
Do you see this unfolding the same way?
Do you disagree with the 80 target?
Drop a comment with your view or share your own markup—this is why we trade!
Stay safe,
⚠️ Risk Disclaimer
This post is for educational purposes only and reflects my personal analysis and opinions. It is not financial advice. Trading involves significant risk and may not be suitable for all investors. Always do your own research, manage your risk appropriately, and never trade money you can’t afford to lose.
USDJPY

USD/JPY - ShortWeekly (Bias Validation)
- Price between EMAs → ❌ Ranging
- Major Swing Point High: 158.880 Low: 146.543
D1 (Daily): Trend Bias
- Price below 200EMA & 50EMA on D1 → ✅ Bearish Bias
- Major Swing Point High: 154.804 Low: 146.543
- ✅ Break of Structure (BoS) + Volume Imbalance
- Price below Weekly VWAP → ✅ Bearish Bias
H4 (4-Hour): Trend Bias
- Price below 200EMA & 50EMA on D1 → ✅ Bearish Bias
- Major Swing Point High: 151.214 Low: 149.684
- ✅ Break of Structure (BoS) + Volume Imbalance
- Price below Weekly VWAP → ✅ Bearish Bias
- High-Probability Entry Zones (H4 OTE)
- H4 OB (OTE)
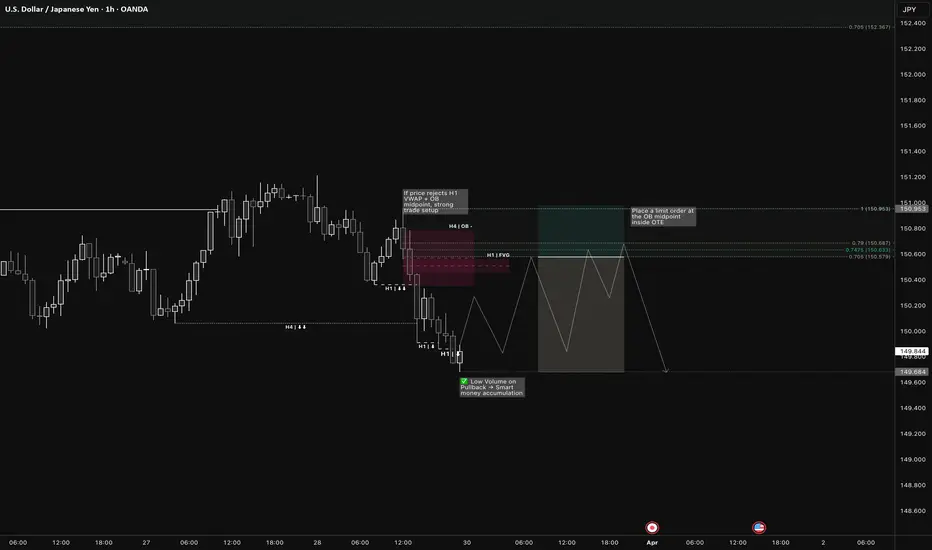
H1 (1-Hour): Trend Bias
- Swing Point High: 150.953 Low: 149.684
- ✅ Break of Structure (BoS) + Volume Imbalance
- H4 OB → (OTE)
- H1 OB → (OTE)
🔲 Validate with VWAP:
✔ ✅ H1 VWAP must align with H4 OTE before entry
✔ ✅ If price rejects H1 VWAP + OB midpoint, strong trade setup
🔲 Entry Options:
✔ Option 1 (Limit Order Entry):
* Place a limit order at the OB midpoint inside OTE
* Set stop-loss below OB (for longs) / above OB (for shorts)
✔ Option 2 (EMA Confirmation Entry):
* ✅ Enter when 9EMA crosses 21EMA near OTE
* ✅ Must have Volume Imbalance Confirmation
🔲 Final Confirmation:
✔ ✅ High Volume on Structure Break → Confirms strong move
✔ ✅ Low Volume on Pullback → Smart money accumulation
USD/JPY (Short)Daily:
Price < 200EMA
Swing Period 10
Swing High: 158.880
Swing Low: 146.543
Volume Imbalance: 5 Candles
Daily Order Block: 155.223 / 153.916
H4:
Price < 200EMA
Swing Period: 7
Swing High: 152.315
Swing Low: 146.597
Volume Imbalance: 3 Candles
H4 Order Block: 152.762 / 151.242
H1:
Swing Period: 5
Swing High: 152.315
Swing Low: 146.597
Volume Imbalance: 3 Candles
H1 Order Block: 151.762 / 151.628
Model 1:
Entry Price: 151.692
Stop Loss: 152.447
TP1: 150.115 @ 1:2 / 50%
TP2: 149.363 @ 1:3 / 25%
SL: Breakeven
TP3: 146.552 @ 1:5 / 25%
Model 2:
Entry Price: 151.108 - 150.141
Entry Trigger: 9EMA X 21EMA
SL: Above recent swing high
TP1: 1:2
SL: Trailing 9EMA

"Goooo...!!! Get to the safe-haven choppa!"And there we go... Market participants are in panic mode as tariff show kicks off. Everyone is trying to find a safe-haven like CHF and JPY. However, gold and silver are not the ones, where you need to be now.
Let's dig in!
TVC:GOLD
MARKETSCOM:USDCHF
MARKETSCOM:USDJPY
MARKETSCOM:JAPAN225
Let us know what you think in the comments below.
Thank you.
77.3% of retail investor accounts lose money when trading CFDs with this provider. You should consider whether you understand how CFDs work and whether you can afford to take the high risk of losing your money. Past performance is not necessarily indicative of future results. The value of investments may fall as well as rise and the investor may not get back the amount initially invested. This content is not intended for nor applicable to residents of the UK. Cryptocurrency CFDs and spread bets are restricted in the UK for all retail clients.

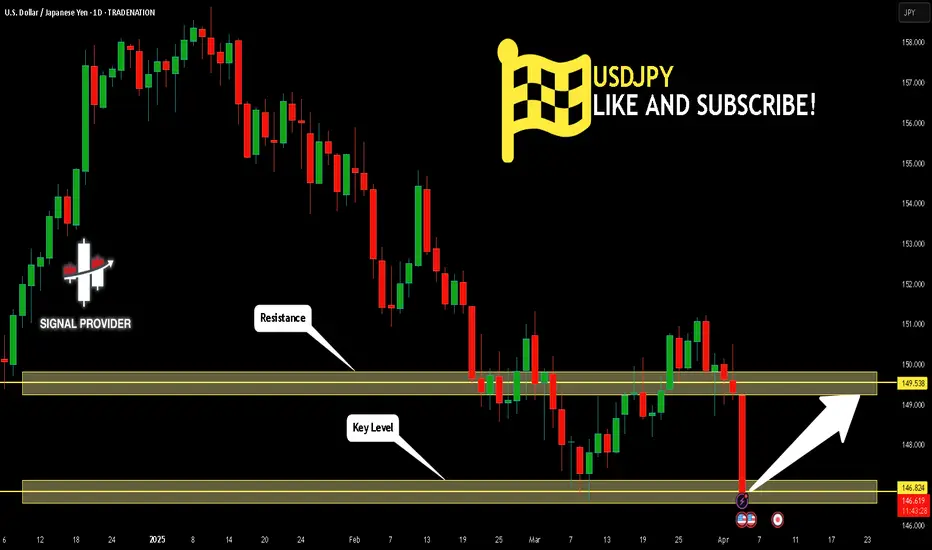
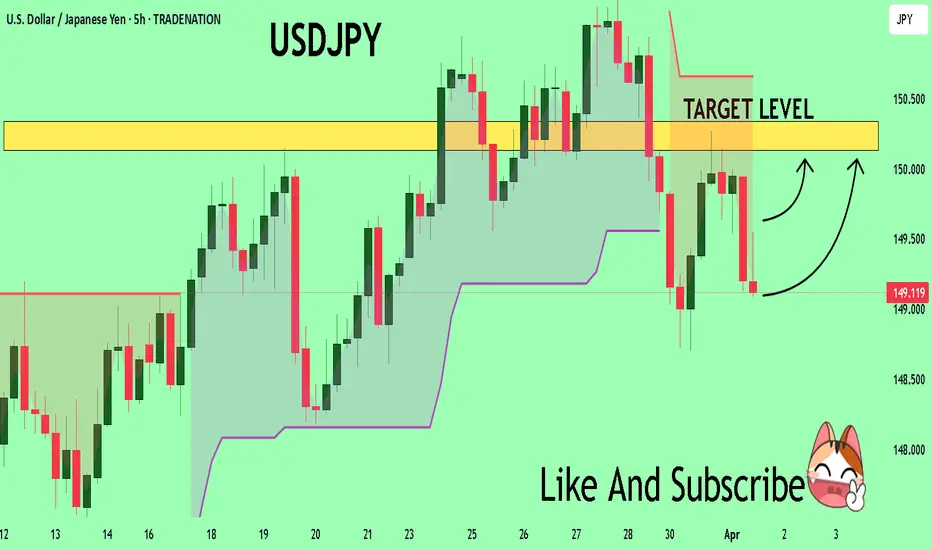
USDJPY Is Going Up! Buy!
Please, check our technical outlook for USDJPY.
Time Frame: 1D
Current Trend: Bullish
Sentiment: Oversold (based on 7-period RSI)
Forecast: Bullish
The market is approaching a key horizontal level 146.824.
Considering the today's price action, probabilities will be high to see a movement to 149.538.
P.S
Please, note that an oversold/overbought condition can last for a long time, and therefore being oversold/overbought doesn't mean a price rally will come soon, or at all.
Disclosure: I am part of Trade Nation's Influencer program and receive a monthly fee for using their TradingView charts in my analysis.
Like and subscribe and comment my ideas if you enjoy them!

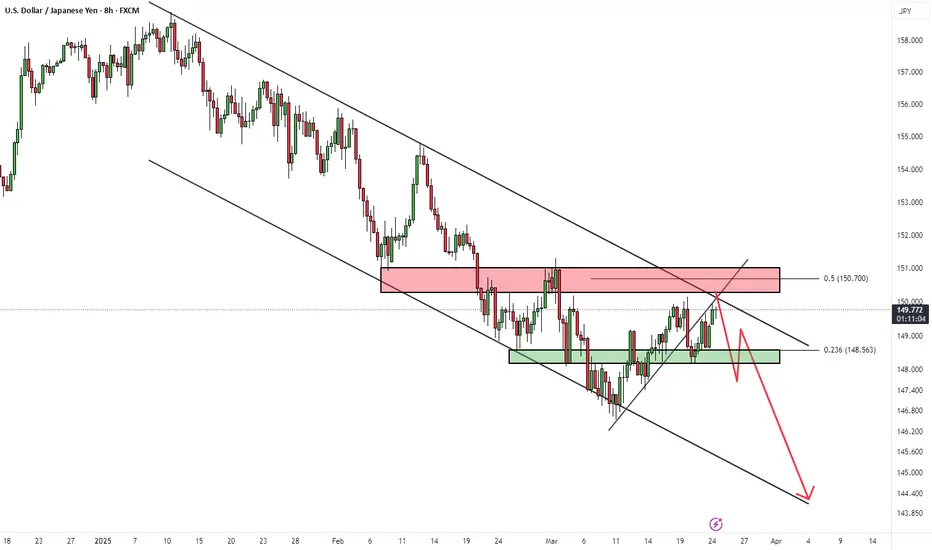
USDJPYHello Traders! 👋
What are your thoughts on USDJPY?
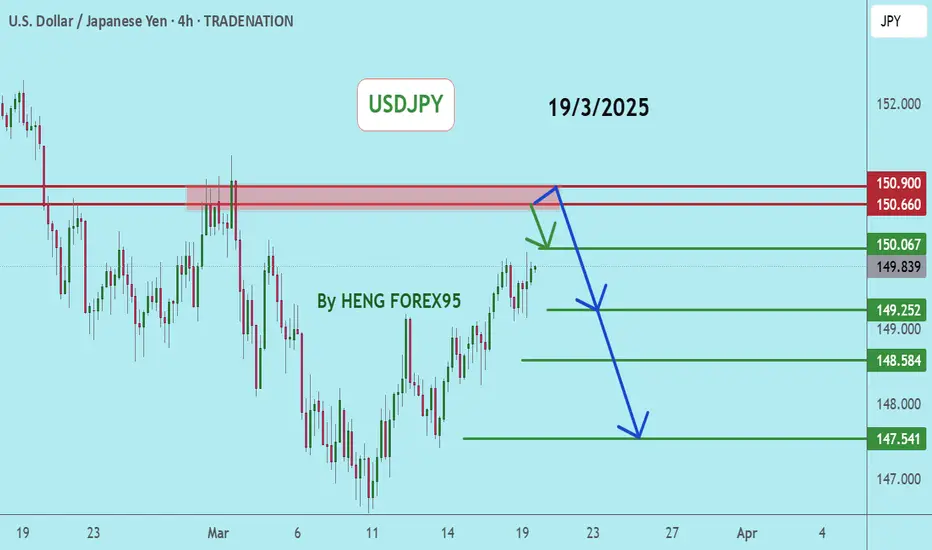
USDJPY is moving within a descending channel and has currently reached the top of the channel, just below a resistance zone.
We anticipate some consolidation in this area, followed by a potential drop toward the bottom of the channel.
For a safer sell entry, it’s better to wait for a break below the specified support level.
After the breakout, a pullback to the broken support could offer a good sell opportunity.
💡Will USD/JPY respect the channel and head lower, or break out to the upside? Share your view below! 👇
Don’t forget to like and share your thoughts in the comments! ❤️
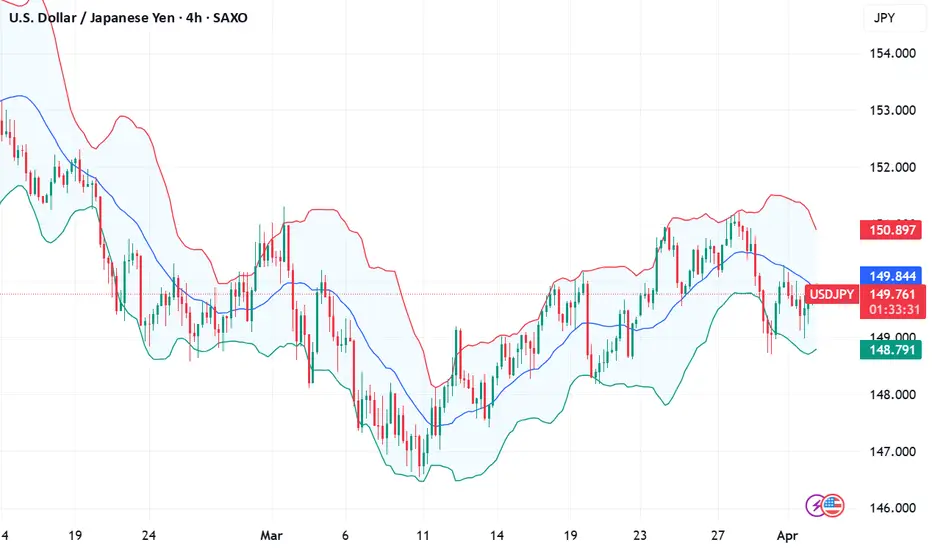
USD/JPY Stands Firm, But Volatility ExpectedVolatility has receded with less than 20-hours to go until Trump's tariffs are officially implemented, with traders now clearly in watch-and-wait mode. So while headline risks around tariffs remain in place, moves could remain limited unless traders are treated to any last-minute negotiations.
Typically, risk has benefitted when it has been expected that tariffs have been watered down. If that turns out to be the case by Trump's speech at 4pm ET Wednesday, indices could rise alongside the US dollar and the yen weaken.
Bit of course, the opposite is true. And that could weigh on USD/JPY. Rightly or wrongly, I'm feeling optimistic and now seeing a bounce on USD/JPY.
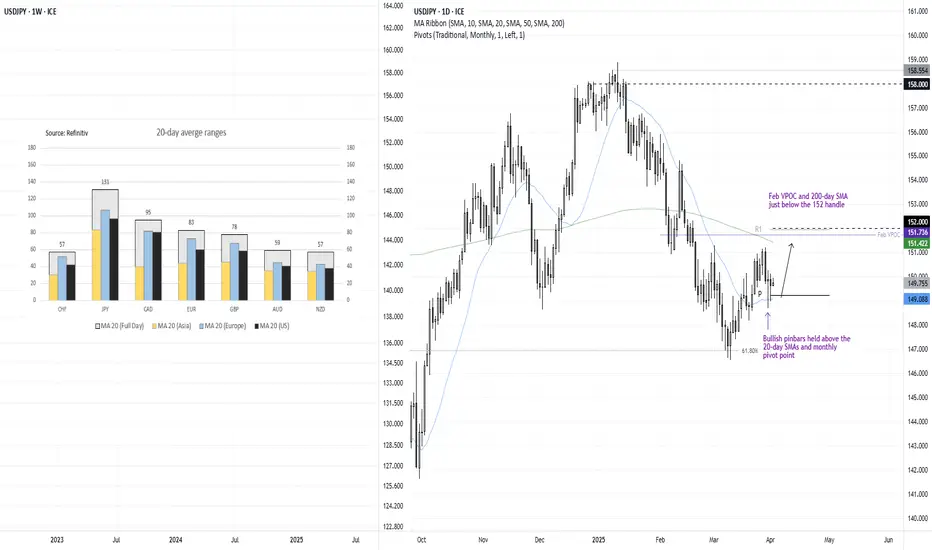
Two bullish pinbars found support and close above the 20-day SMA and monthly pivot point. The bias remains bullish while prices remain above Monday's low, and a break above 150 brings the 200-day SMA, February VPOPC and 152 handle into focus.
Matt Simpson, Market Analyst at City Index and Forex.com
USDJPYUSDJPY price is still in a downtrend. If the price cannot break through 150.97, it is expected that the price will drop. Consider selling the red zone.
🔥Trading futures, forex, CFDs and stocks carries a risk of loss.
Please consider carefully whether such trading is suitable for you.
>>GooD Luck 😊
❤️ Like and subscribe to never miss a new idea!
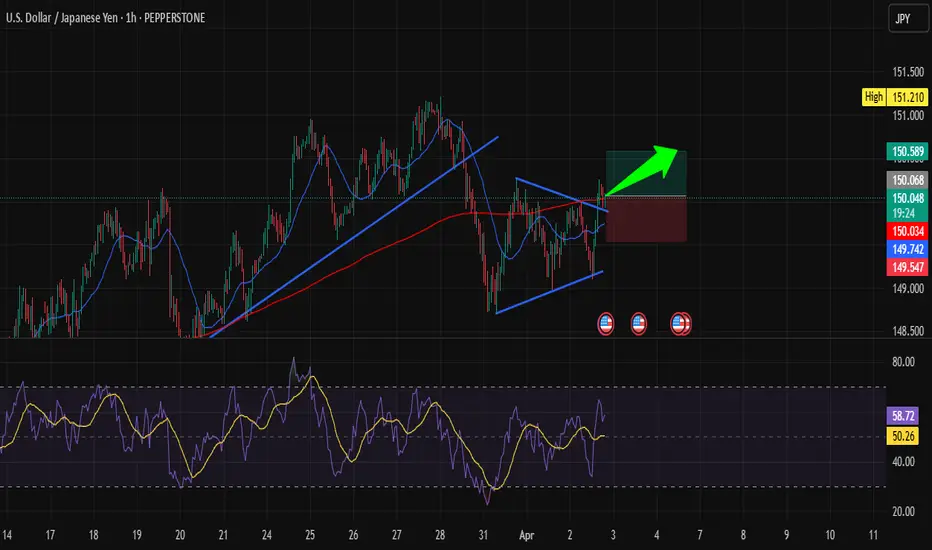
USD/JPY Ready to Take Off: Golden Opportunity on 1H!Hi traders! Analyzing USD/JPY on the 1H timeframe, spotting a potential entry:
🔹 Entry: 150.08
🔹 TP: 150.589
🔹 SL: 149.547
USD/JPY is breaking out of a bullish pennant pattern, suggesting a potential upward move. The RSI is holding above 50, indicating bullish momentum building up. If the price sustains above 150.08, we could see a push toward 150.589. Keep your eyes on price action and manage your risk!
⚠️ DISCLAIMER: This is not financial advice. Trade responsibly.
USDJPY: Long Signal with Entry/SL/TP
USDJPY
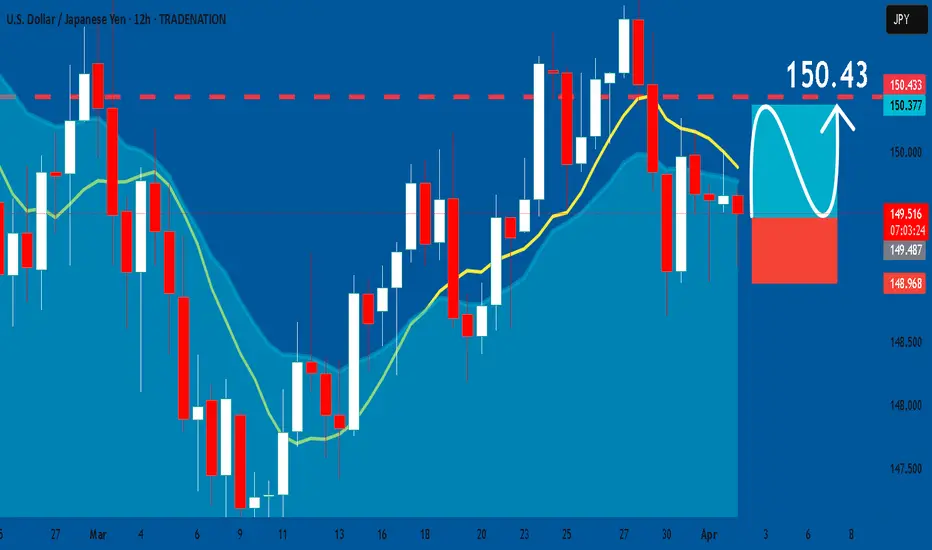
- Classic bullish setup
- Our team expects bullish continuation
SUGGESTED TRADE:
Swing Trade
Long USDJPY
Entry Point - 149.48
Stop Loss - 148.96
Take Profit - 150.43
Our Risk - 1%
Start protection of your profits from lower levels
Disclosure: I am part of Trade Nation's Influencer program and receive a monthly fee for using their TradingView charts in my analysis.
❤️ Please, support our work with like & comment! ❤️
USDJPY INTRADAY capped bearish below 151.20 awaits tariff dataThe USDJPY currency pair remains in a bearish trend, with the recent price action showing signs of an oversold bounce. While a temporary rebound is in play, the broader sentiment remains weak unless a decisive breakout occurs.
Key Levels to Watch:
Resistance Levels: 151.21 (critical level), 152.20, 153.04
Support Levels: 149.17, 148.26, 147.22
Bearish Scenario:
A rejection from the 151.21 resistance level could reaffirm the downside bias, leading to a continuation of the bearish move toward 149.17, with extended declines targeting 148.26 and 147.22 over the longer timeframe.
Bullish Scenario:
A breakout above 151.21 with a daily close above this level would challenge the bearish sentiment, opening the door for further gains toward 152.20, followed by 153.04.
Conclusion:
The market sentiment remains bearish, with 151.21 acting as a critical resistance zone. A rejection from this level could reinforce the downtrend, while a confirmed breakout would shift the outlook to bullish, favouring further upside. Traders should closely monitor price action at this key level for confirmation.
This communication is for informational purposes only and should not be viewed as any form of recommendation as to a particular course of action or as investment advice. It is not intended as an offer or solicitation for the purchase or sale of any financial instrument or as an official confirmation of any transaction. Opinions, estimates and assumptions expressed herein are made as of the date of this communication and are subject to change without notice. This communication has been prepared based upon information, including market prices, data and other information, believed to be reliable; however, Trade Nation does not warrant its completeness or accuracy. All market prices and market data contained in or attached to this communication are indicative and subject to change without notice.

USDJPY Short OpportunityPoint and Figure charting is the OG technical analysis method—no fancy candlesticks or bar charts needed. Unlike other charts, Point and Figure ignores time and focuses purely on price action, offering clarity amid market noise.
If candlestick charts look too chaotic for your taste, Point and Figure usually clears things up. Its simplicity is its best feature: fewer patterns and straightforward trade execution rules, compared to the 150+ patterns of Japanese Candlesticks.
On the USDJPY 40-pip/3-box reversal P&F chart, a bear flag pattern is currently being tested and acting as solid resistance. This creates an aggressive but appealing short entry opportunity at 148.80. Below this entry, there are multiple potential profit targets, with T3 (141.60) marking the maximum realistic expectation.
Now, before you get too excited about a single-column collapse from 148.80 down to 141.60—hold your horses. The odds of USDJPY making such a dramatic drop in one swift move are slim to none. But given the current international trade tensions, stranger things have happened.
Think of the area between 148.80 and 141.60 as a zone where it's easier for USDJPY to drift downward rather than grind upward.

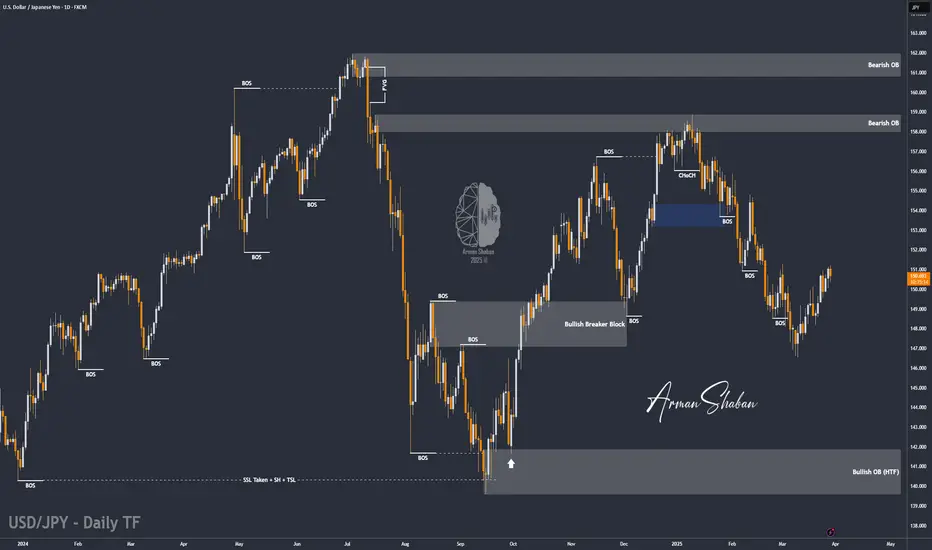
USD/JPY : Bulls are coming back?! Let's See! (READ THE CAPTION)Upon analyzing the USD/JPY daily chart, we observe that the price precisely hit our previously forecasted target of 148.65 before declining further to 146.5. Following that, USDJPY rallied back up to 151 and is currently trading around 150.680. Should the price manage to stabilize above 150.5, we can anticipate further gains in this pair. This analysis will be updated accordingly.
Please support me with your likes and comments to motivate me to share more analysis with you and share your opinion about the possible trend of this chart with me !
Best Regards , Arman Shaban
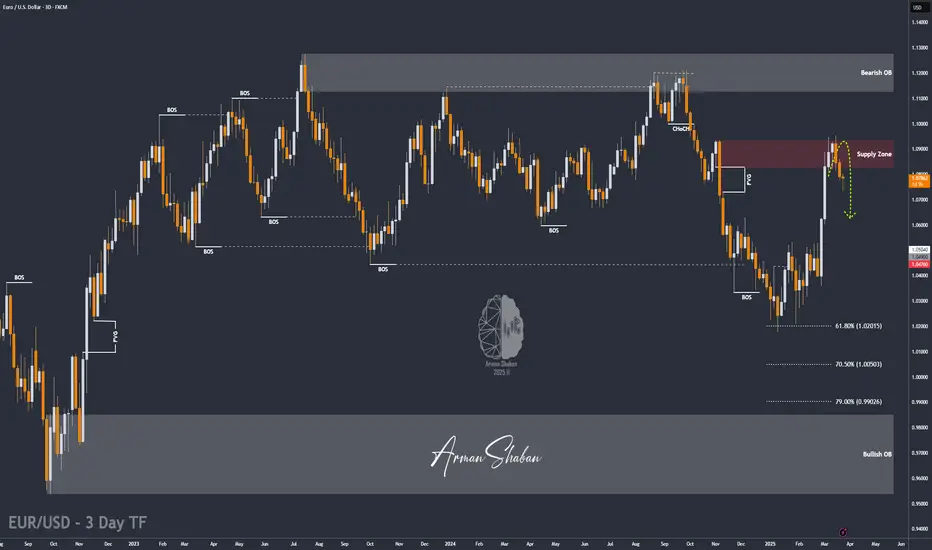
EUR/USD: Ready for another Fall? (READ THE CAPTION)By examining the EUR/USD chart on the 3-day timeframe, we can see that the price has moved exactly as expected since our last analysis. After reaching the supply zone between 1.083 and 1.093, the pair began a correction and is currently trading around 1.079. Keep in mind, only if the price stabilizes below the 1.080 level can we expect further downside from this pair.
Please support me with your likes and comments to motivate me to share more analysis with you and share your opinion about the possible trend of this chart with me !
Best Regards , Arman Shaban
USDJPY Analysis todayHello traders, this is a complete multiple timeframe analysis of this pair. We see could find significant trading opportunities as per analysis upon price action confirmation we may take this trade. Smash the like button if you find value in this analysis and drop a comment if you have any questions or let me know which pair to cover in my next analysis.

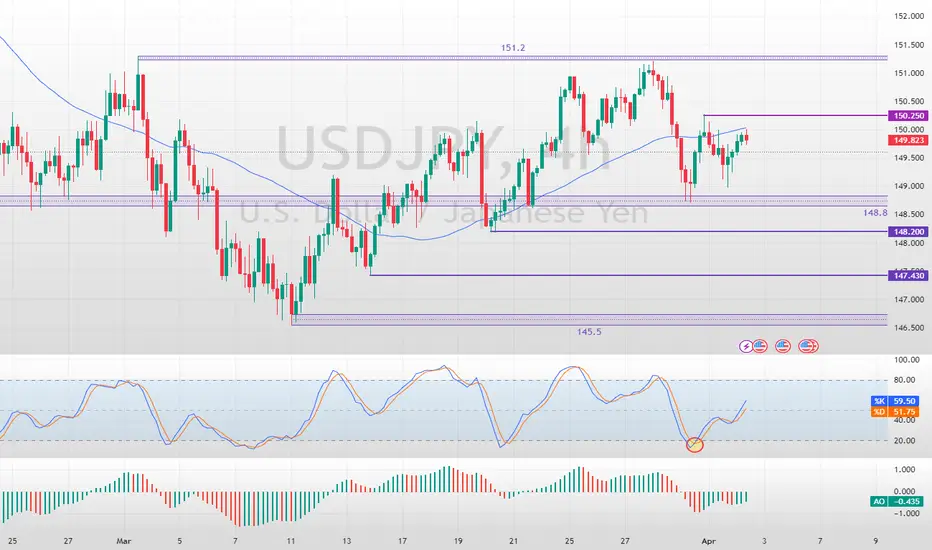
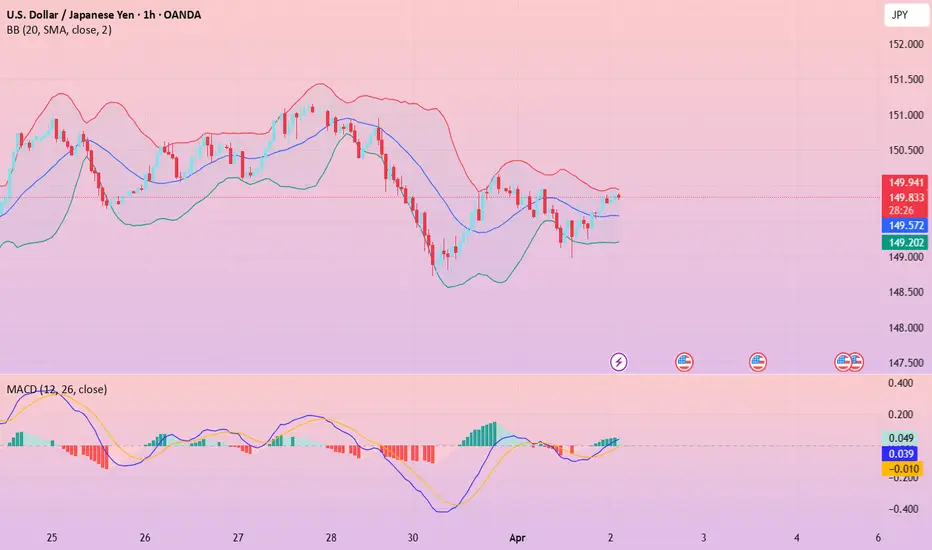
USDJPY Technical AnalysisFenzoFx—USDJPY tested 150.25, a trading range below this level and the 50-period simple moving average. A close above 150.25 can trigger the uptrend, targeting 151.2.
Conversely, a dip below 148.2 invalidates the bullish outlook, with 148.2 as the first target and 147.43 as the secondary target.
Fundamental Market Analysis for April 2, 2025 USDJPYThe Japanese Yen (JPY) fails to capitalise on the previous day's modest gains against its US counterpart and attracts fresh sellers during Wednesday's Asian session. The USD/JPY pair, however, remains in the range it has been in since the beginning of this week as traders await a new catalyst before positioning for the next leg of directional movement. As such, attention will remain focused on US President Donald Trump's announcement of retaliatory tariffs later today.
Meanwhile, speculation that the slowdown in the economy caused by the tariffs may force the Bank of Japan (BoJ) to keep policy steady for now is undermining the yen. However, investors seem convinced that the BoJ will continue to raise interest rates amid signs of rising inflation in Japan. This is a significant divergence from the growing confidence that the Federal Reserve (BoJ) will resume its rate-cutting cycle in June, and should support the lower-yielding Japanese Yen.
Trade recommendation: SELL 150.00, SL 150.90, TP 148.60
USD/JPY(20250402)Today's AnalysisToday's buying and selling boundaries:
149.55
Support and resistance levels
150.70
150.27
149.99
149.11
148.83
148.40
Trading strategy:
If the price breaks through 149.99, consider buying, the first target price is 150.27
If the price breaks through 149.55, consider selling, the first target price is 149.11
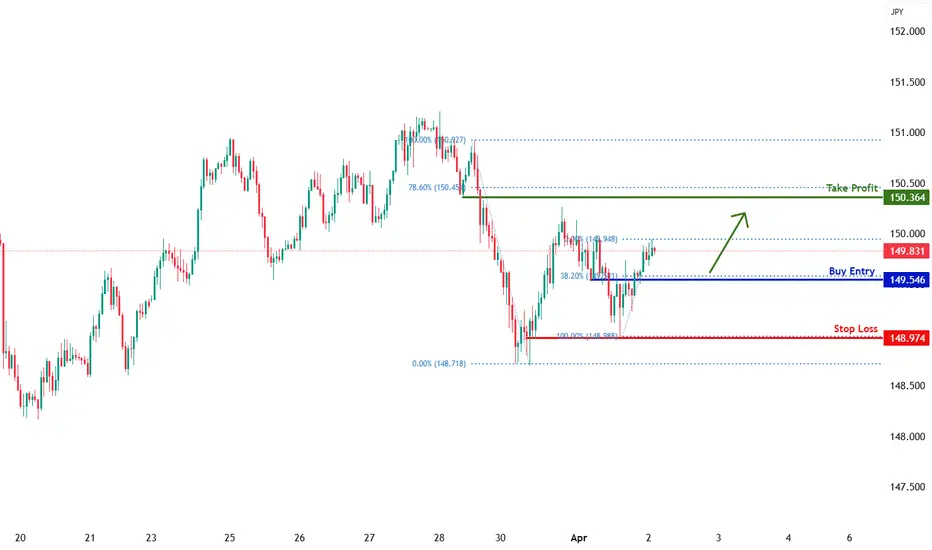
USDJPY H1 | Bullish Bounce OffBased on the H1 chart analysis, the price is approaching our buy entry level at 149.54, a pullback support that aligns with the 38.2% Fibonacci retracement.
Our take profit is set at 150.36, a pullback resistance that aligns close to the 78.6% Fibonacci retracement.
The stop loss is placed at 148.97, a multi-swing low support.
High Risk Investment Warning
Trading Forex/CFDs on margin carries a high level of risk and may not be suitable for all investors. Leverage can work against you.
Stratos Markets Limited (fxcm.com/uk):
CFDs are complex instruments and come with a high risk of losing money rapidly due to leverage. 63% of retail investor accounts lose money when trading CFDs with this provider. You should consider whether you understand how CFDs work and whether you can afford to take the high risk of losing your money.
Stratos Europe Ltd (fxcm.com/eu):
CFDs are complex instruments and come with a high risk of losing money rapidly due to leverage. 63% of retail investor accounts lose money when trading CFDs with this provider. You should consider whether you understand how CFDs work and whether you can afford to take the high risk of losing your money.
Stratos Trading Pty. Limited (fxcm.com/au):
Trading FX/CFDs carries significant risks. FXCM AU (AFSL 309763), please read the Financial Services Guide, Product Disclosure Statement, Target Market Determination and Terms of Business at fxcm.com/au
Stratos Global LLC (fxcm.com/markets):
Losses can exceed deposits.
Please be advised that the information presented on TradingView is provided to FXCM (‘Company’, ‘we’) by a third-party provider (‘TFA Global Pte Ltd’). Please be reminded that you are solely responsible for the trading decisions on your account. There is a very high degree of risk involved in trading. Any information and/or content is intended entirely for research, educational and informational purposes only and does not constitute investment or consultation advice or investment strategy. The information is not tailored to the investment needs of any specific person and therefore does not involve a consideration of any of the investment objectives, financial situation or needs of any viewer that may receive it. Kindly also note that past performance is not a reliable indicator of future results. Actual results may differ materially from those anticipated in forward-looking or past performance statements. We assume no liability as to the accuracy or completeness of any of the information and/or content provided herein and the Company cannot be held responsible for any omission, mistake nor for any loss or damage including without limitation to any loss of profit which may arise from reliance on any information supplied by TFA Global Pte Ltd.
The speaker(s) is neither an employee, agent nor representative of FXCM and is therefore acting independently. The opinions given are their own, constitute general market commentary, and do not constitute the opinion or advice of FXCM or any form of personal or investment advice. FXCM neither endorses nor guarantees offerings of third-party speakers, nor is FXCM responsible for the content, veracity or opinions of third-party speakers, presenters or participants.
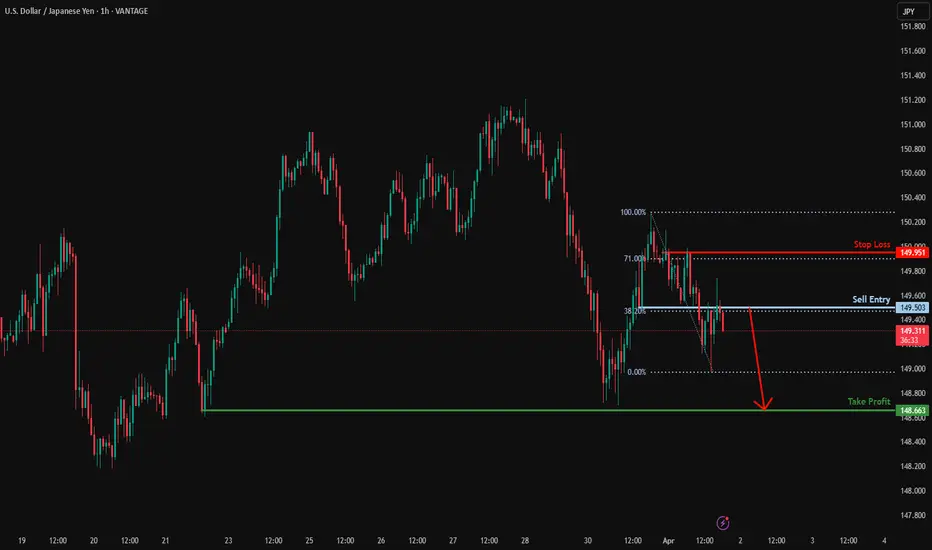
Bearish drop?USD/JPY is reacting off the resistance level which is a pullback resistance that aligns with the 38.2% Fibonacci retracement and could drop from this level to our take profit.
Entry: 149.50
Why we like it:
There is a pullback resistance level that lies up with the 38.2% Fibonacci retracement.
Stop loss: 149.95
Why we like it:
There is a pullback resistance level that lines up with the 71% Fibonacci retracement.
Take profit: 148.66
Why we like it:
There is a pullback support level.
Enjoying your TradingView experience? Review us!
Please be advised that the information presented on TradingView is provided to Vantage (‘Vantage Global Limited’, ‘we’) by a third-party provider (‘Everest Fortune Group’). Please be reminded that you are solely responsible for the trading decisions on your account. There is a very high degree of risk involved in trading. Any information and/or content is intended entirely for research, educational and informational purposes only and does not constitute investment or consultation advice or investment strategy. The information is not tailored to the investment needs of any specific person and therefore does not involve a consideration of any of the investment objectives, financial situation or needs of any viewer that may receive it. Kindly also note that past performance is not a reliable indicator of future results. Actual results may differ materially from those anticipated in forward-looking or past performance statements. We assume no liability as to the accuracy or completeness of any of the information and/or content provided herein and the Company cannot be held responsible for any omission, mistake nor for any loss or damage including without limitation to any loss of profit which may arise from reliance on any information supplied by Everest Fortune Group.
USDJPY Set To Grow! BUY!
My dear followers,
This is my opinion on the USDJPY next move:
The asset is approaching an important pivot point 149.16
Bias - Bullish
Technical Indicators: Supper Trend generates a clear long signal while Pivot Point HL is currently determining the overall Bullish trend of the market.
Goal - 150.13
About Used Indicators:
For more efficient signals, super-trend is used in combination with other indicators like Pivot Points.
Disclosure: I am part of Trade Nation's Influencer program and receive a monthly fee for using their TradingView charts in my analysis.
———————————
WISH YOU ALL LUCK
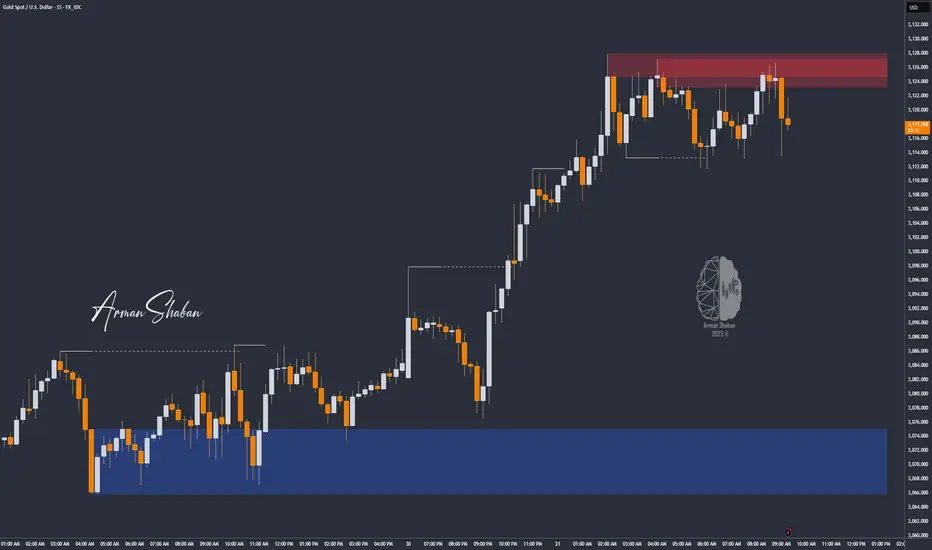
XAU/USD: Bull or Bear? (READ THE CAPTION)By analyzing the gold chart on the 15-minute timeframe, we can see that after the market opened today, a price gap appeared. Once gold filled this gap, it resumed its bullish move and recorded a new all-time high at $3,128. Currently, gold is trading around $3,119, and if the price stabilizes below $3,120, we may see a slight correction.
However, note that there’s been no new structural break on the higher timeframes, so for a more accurate outlook, we need to wait for the price to react to key levels.
This analysis will be updated with your continued support, as always!
Please support me with your likes and comments to motivate me to share more analysis with you and share your opinion about the possible trend of this chart with me !
Best Regards , Arman Shaban