USDJPY Set To Grow! BUY!
My dear followers,
This is my opinion on the USDJPY next move:
The asset is approaching an important pivot point 149.16
Bias - Bullish
Technical Indicators: Supper Trend generates a clear long signal while Pivot Point HL is currently determining the overall Bullish trend of the market.
Goal - 150.13
About Used Indicators:
For more efficient signals, super-trend is used in combination with other indicators like Pivot Points.
Disclosure: I am part of Trade Nation's Influencer program and receive a monthly fee for using their TradingView charts in my analysis.
———————————
WISH YOU ALL LUCK
USDJPY
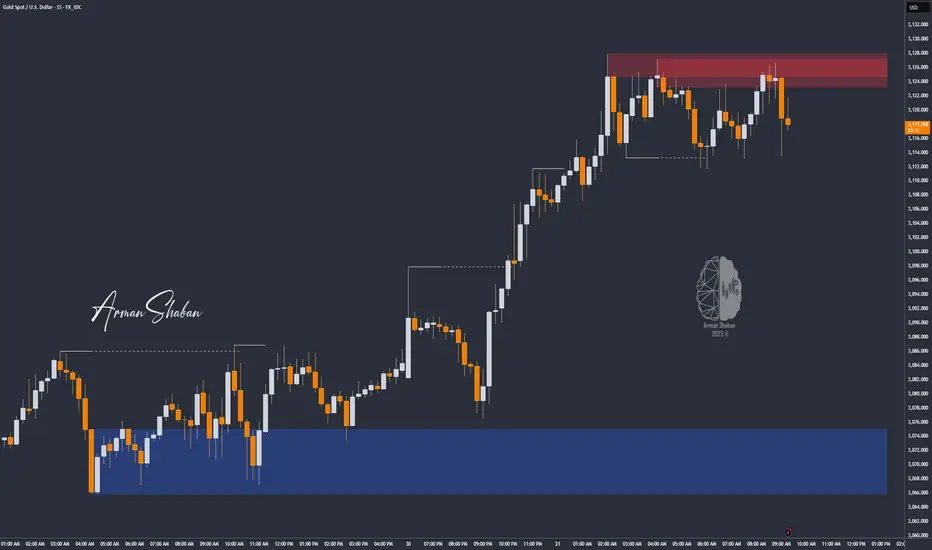
XAU/USD: Bull or Bear? (READ THE CAPTION)By analyzing the gold chart on the 15-minute timeframe, we can see that after the market opened today, a price gap appeared. Once gold filled this gap, it resumed its bullish move and recorded a new all-time high at $3,128. Currently, gold is trading around $3,119, and if the price stabilizes below $3,120, we may see a slight correction.
However, note that there’s been no new structural break on the higher timeframes, so for a more accurate outlook, we need to wait for the price to react to key levels.
This analysis will be updated with your continued support, as always!
Please support me with your likes and comments to motivate me to share more analysis with you and share your opinion about the possible trend of this chart with me !
Best Regards , Arman Shaban
Bearish drop?USD/JPY is rising towards the resistanec elvel which is a pullback resistance and could drop from this level to the downside.
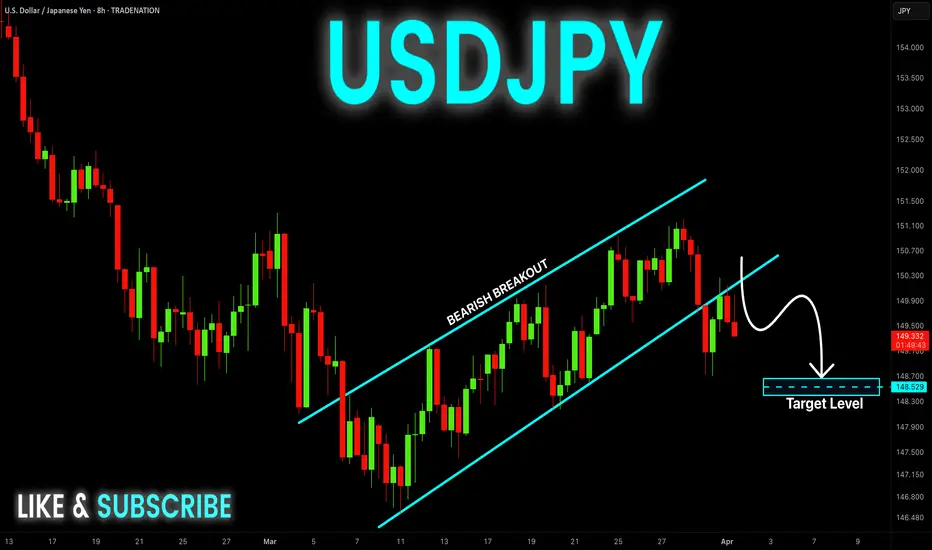
USD-JPY Bearish Breakout! Sell!
Hello,Traders!
USD-JPY is trading in a
Downtrend and the pair
Broke our of the bearish
Wedge pattern then made
A retest and is going down
Now so we are bearish
Biased and we will be
Expecting a further move down
Sell!
Comment and subscribe to help us grow!
Check out other forecasts below too!
Disclosure: I am part of Trade Nation's Influencer program and receive a monthly fee for using their TradingView charts in my analysis.
Will the BoJ's hawkish approach affect the yen's strength?
US equity markets plunged amid growing concerns that the Trump administration's tariffs, set to be announced on April 2, could be aggressively implemented. Goldman Sachs warned that US tariff rates could reach as high as 18%, potentially shaving 1.0% off GDP growth and pushing the unemployment rate to 4.5% this year.
Bank of Japan Governor Kazuo Ueda signaled a continued tightening stance, stating that if persistently rising food prices lead to broader inflation, the central bank would consider raising interest rates.
USDJPY broke below the support at 149.50 before retracing to 150.00. However, failing to reenter the channel, the price hovers near the channel’s lower bound. If USDJPY fails to reenter the channel, the price may break below 149.50 again. Conversely, if USDJPY reenters the channel, the price could gain upward momentum toward the resistance at 151.30.

Potential Bearish Drop?USD/JPY is reacting off the pivot whichis a pullback resistance and could drop from this level to he downside.

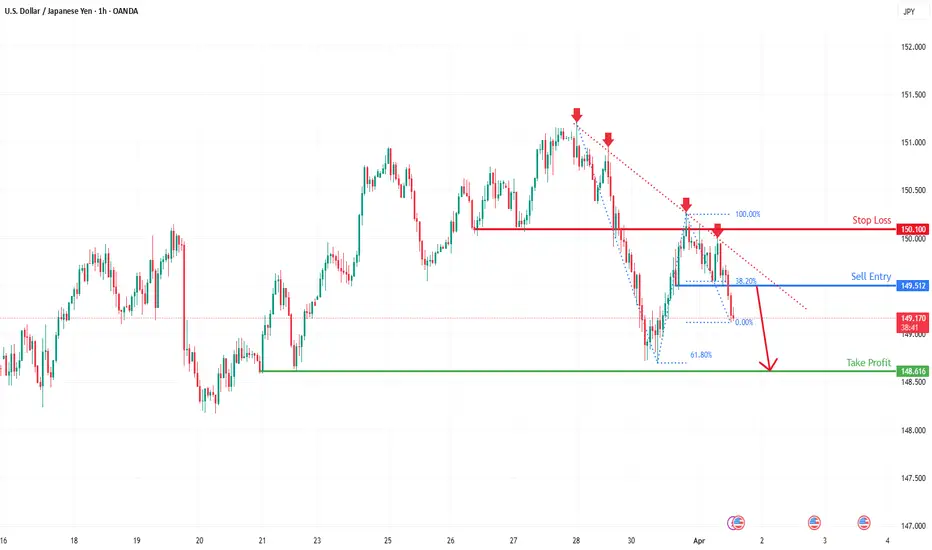
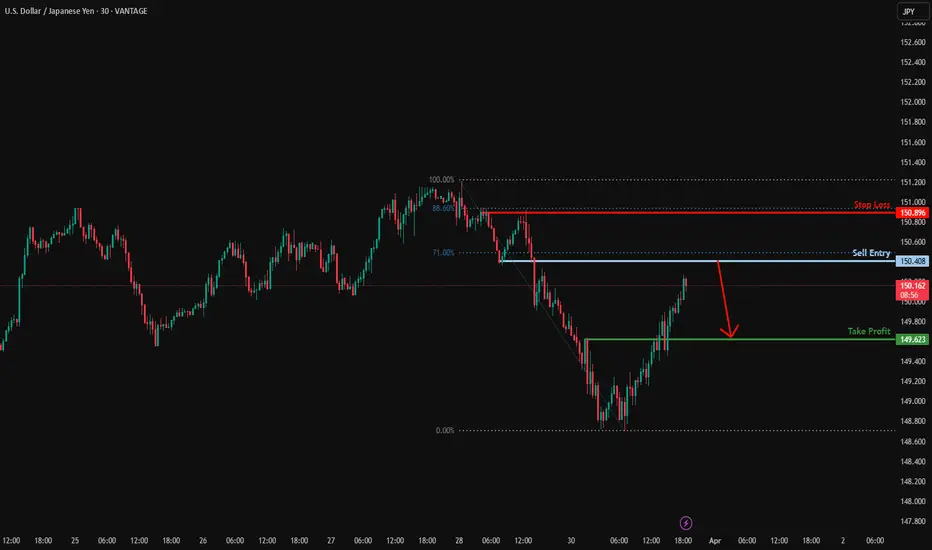
Could the price reverse from here?USD/JPY is rising towards the resistance level which is a pullback resistance that lines up with the 71% Fibonacci retracement and could drop from this level to our take profit.
Entry: 150.40
Why we like it:
There is a pullback resistance level that lines up with the 71% Fibonacci retracement.
Stop loss: 150.89
Why we like it:
There is a pullback resistance that lines up with the 88.6% Fibonacci retracement.
Take profit: 149.62
Why we like it:
There is a pullback support level.
Enjoying your TradingView experience? Review us!
Please be advised that the information presented on TradingView is provided to Vantage (‘Vantage Global Limited’, ‘we’) by a third-party provider (‘Everest Fortune Group’). Please be reminded that you are solely responsible for the trading decisions on your account. There is a very high degree of risk involved in trading. Any information and/or content is intended entirely for research, educational and informational purposes only and does not constitute investment or consultation advice or investment strategy. The information is not tailored to the investment needs of any specific person and therefore does not involve a consideration of any of the investment objectives, financial situation or needs of any viewer that may receive it. Kindly also note that past performance is not a reliable indicator of future results. Actual results may differ materially from those anticipated in forward-looking or past performance statements. We assume no liability as to the accuracy or completeness of any of the information and/or content provided herein and the Company cannot be held responsible for any omission, mistake nor for any loss or damage including without limitation to any loss of profit which may arise from reliance on any information supplied by Everest Fortune Group.
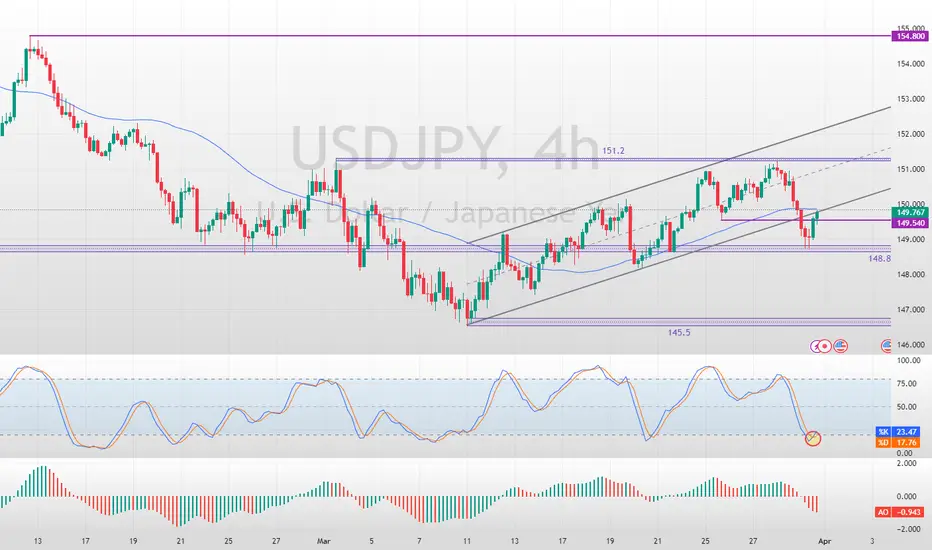
USDJPY Technical AnalysisFenzoFx—USD/JPY remains in a bearish trend, trading below the 50-period simple moving average (SMA).
Since the price is below the moving average and has set a lower low, the overall trend remains bearish. However, the Stochastic Oscillator signals oversold conditions, suggesting the Yen may be overvalued against the U.S. dollar.
If sellers push the price below 148.8, the downtrend could continue, with the next support at 145.5.
Conversely, a break above the 151.2 resistance would challenge the bearish scenario. If the pair moves past this level, it could extend gains toward 154.8.
USDJPY and GBPJPY Analysis todayHello traders, this is a complete multiple timeframe analysis of this pair. We see could find significant trading opportunities as per analysis upon price action confirmation we may take this trade. Smash the like button if you find value in this analysis and drop a comment if you have any questions or let me know which pair to cover in my next analysis.

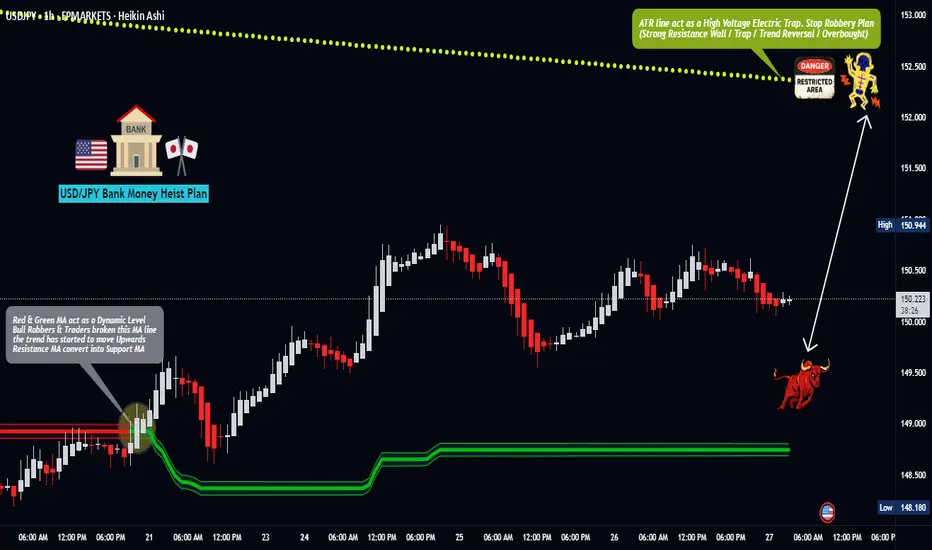
USD/JPY "The Ninja" Forex Bank Heist Plan (Day / Scalping Trade)🌟Hi! Hola! Ola! Bonjour! Hallo! Marhaba!🌟
Dear Money Makers & Robbers, 🤑 💰💸✈️
Based on 🔥Thief Trading style technical and fundamental analysis🔥, here is our master plan to heist the USD/JPY "The Ninja" Forex Bank . Please adhere to the strategy I've outlined in the chart, which emphasizes long entry. Our aim is the high-risk Red Zone. Risky level, overbought market, consolidation, trend reversal, trap at the level where traders and bearish robbers are stronger. 🏆💸"Take profit and treat yourself, traders. You deserve it!💪🏆🎉
Entry 📈 : "The vault is wide open! Swipe the Bullish loot at any price - the heist is on!
however I advise to Place buy limit orders within a 15 or 30 minute timeframe most recent or swing, low or high level.
Stop Loss 🛑:
Thief SL placed at the recent/swing low level Using the 1H timeframe (148.600) Day / scalping trade basis.
SL is based on your risk of the trade, lot size and how many multiple orders you have to take.
🏴☠️Target 🎯: 152.400 (or) Escape Before the Target
🧲Scalpers, take note 👀 : only scalp on the Long side. If you have a lot of money, you can go straight away; if not, you can join swing traders and carry out the robbery plan. Use trailing SL to safeguard your money 💰.
USD/JPY "The Ninja" Forex Bank Heist Plan (Day/Scalping Trade) is currently experiencing a bullishness,., driven by several key factors.
📰🗞️Get & Read the Fundamental, Macro, COT Report, Quantitative Analysis, Sentimental Outlook, Intermarket Analysis, Future trend targets.. go ahead to check 👉👉👉🔗
⚠️Trading Alert : News Releases and Position Management 📰 🗞️ 🚫🚏
As a reminder, news releases can have a significant impact on market prices and volatility. To minimize potential losses and protect your running positions,
we recommend the following:
Avoid taking new trades during news releases
Use trailing stop-loss orders to protect your running positions and lock in profits
💖Supporting our robbery plan 💥Hit the Boost Button💥 will enable us to effortlessly make and steal money 💰💵. Boost the strength of our robbery team. Every day in this market make money with ease by using the Thief Trading Style.🏆💪🤝❤️🎉🚀
I'll see you soon with another heist plan, so stay tuned 🤑🐱👤🤗🤩
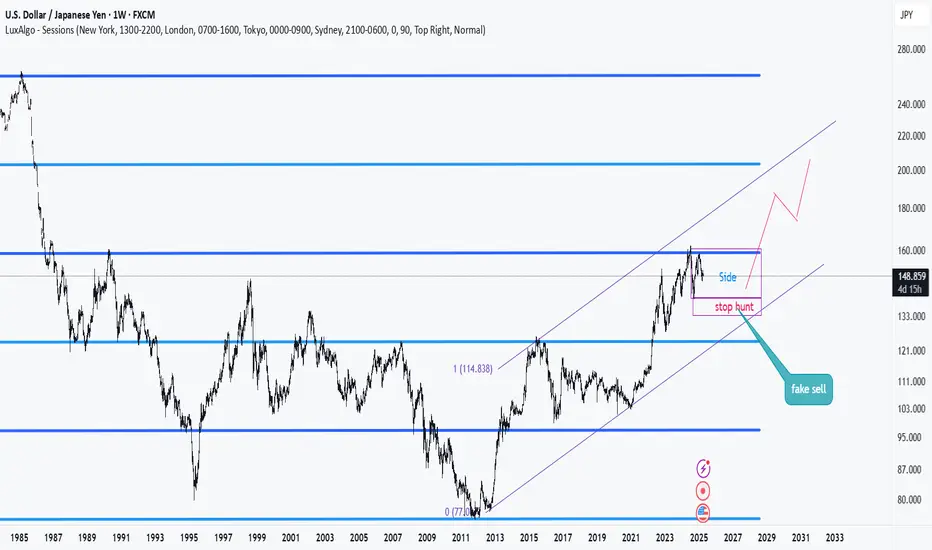
usdjpy road mapWeakly time frame we are in side way now, 90% of my trades was short this month, it is simple and clear.
FX Market Preview: NFP week - EUR/USD in focusIn this FX market preview I go into recapping the EUR/USD, GBP/USD and USD/JPY price action last week and what I'm looking at for this week.
I also take a look at ETF's QQQE and Nvidia opportunities.
I continue to hold my EUR/USD short positions while keeping a strong eye on 1.0860 and then 1.0900. I feel these areas are important for the bears to hold the line if we're going to continue the slide down.
NFP in focus this week as well as Trump Tariffs.
As always, Good Luck & Trade Safe.

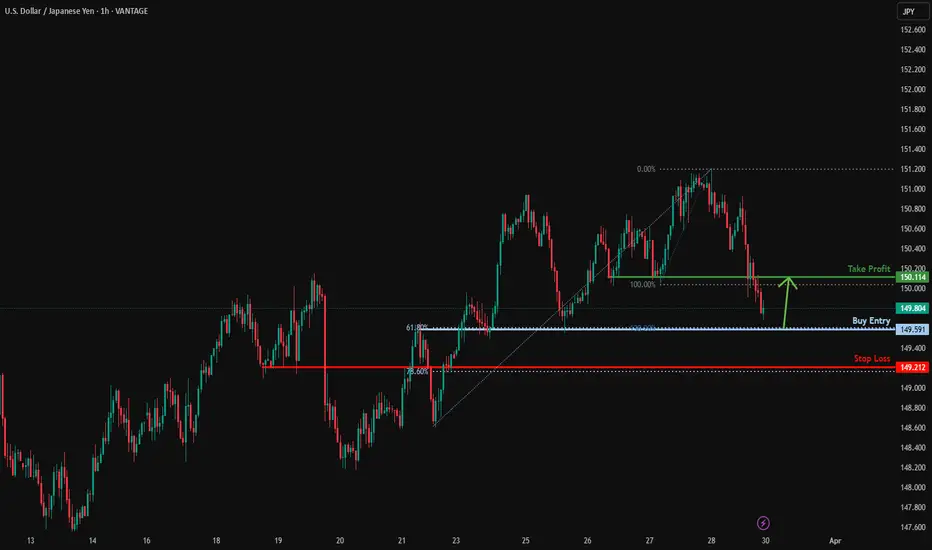
Falling towards overlap support?USD/JPY is falling towards the support level which is an overlap support that aligns with the 61.8% Fibonacci retracement and the 138.2% Fibonacci extension and could bounce from this level to our take profit.
Entry: 149.59
Why we like it:
There is an overlap support level that aligns with the 61.8% Fibonacci retracement and the 138.2% Fibonacci extension.
Stop loss: 149.21
Why we like it:
There is a pullback support level that lines up with the 78.6% Fibonacci retracement.
Take profit: 150.11
Why we like it:
There is a pullback resistance level.
Enjoying your TradingView experience? Review us!
Please be advised that the information presented on TradingView is provided to Vantage (‘Vantage Global Limited’, ‘we’) by a third-party provider (‘Everest Fortune Group’). Please be reminded that you are solely responsible for the trading decisions on your account. There is a very high degree of risk involved in trading. Any information and/or content is intended entirely for research, educational and informational purposes only and does not constitute investment or consultation advice or investment strategy. The information is not tailored to the investment needs of any specific person and therefore does not involve a consideration of any of the investment objectives, financial situation or needs of any viewer that may receive it. Kindly also note that past performance is not a reliable indicator of future results. Actual results may differ materially from those anticipated in forward-looking or past performance statements. We assume no liability as to the accuracy or completeness of any of the information and/or content provided herein and the Company cannot be held responsible for any omission, mistake nor for any loss or damage including without limitation to any loss of profit which may arise from reliance on any information supplied by Everest Fortune Group.
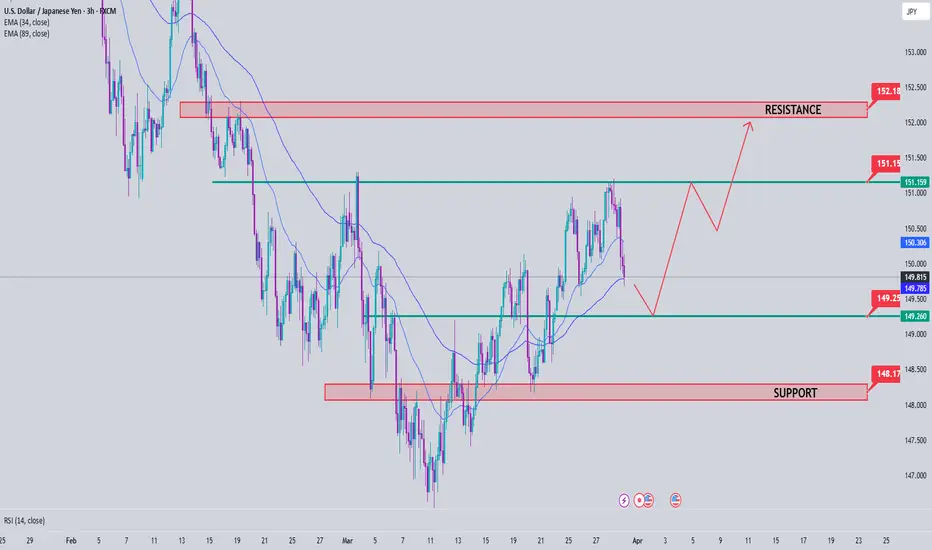
USDJPY - Critical area for the pair!The USD/JPY pair currently sits at a critical technical juncture, trading around the 149.84 level, where market participants are closely watching for directional cues. The price action has been respecting an ascending trendline since early March, suggesting underlying bullish momentum, while simultaneously testing the lower boundary of a significant resistance zone highlighted in blue on the chart. This confluence creates a decisive moment for traders – a break below the trendline could trigger another downward leg toward support near 149.00, while sustained strength above the current level might signal continuation of the uptrend toward the upper resistance band at 151.00. The chart's annotated projection suggests the possibility of one more pullback before resuming higher, making this a pivotal area for determining whether bears will gain temporary control or if bulls will maintain dominance without further consolidation.
Disclosure: I am part of Trade Nation's Influencer program and receive a monthly fee for using their TradingView charts in my analysis.
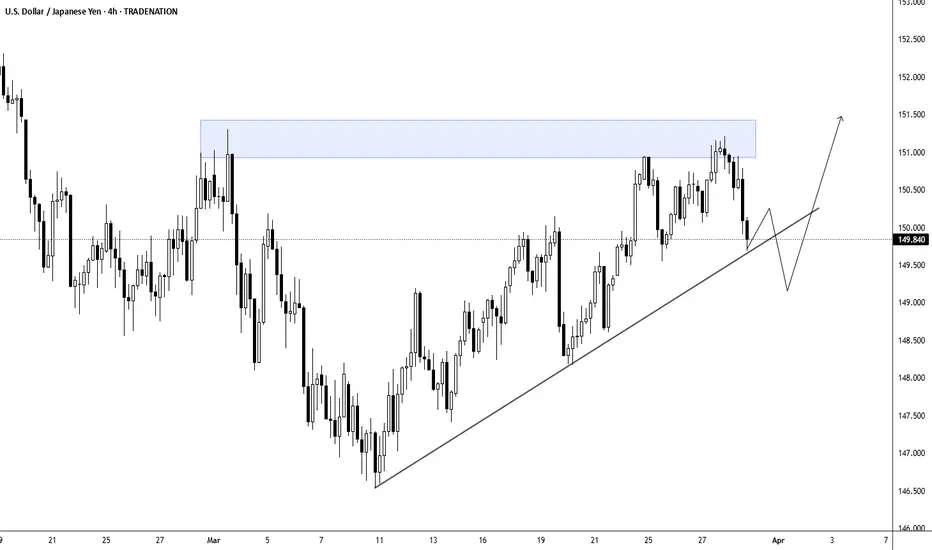
USDJPY - Key Levels to WatchThe USD/JPY pair is showing an interesting setup on the 4-hour chart—here's what to watch:
🔹 1️⃣ Ascending Channel in Play: The pair is trending within a bullish channel, signaling an overall upward momentum. Traders should keep an eye on this structure for potential opportunities.
🔹 2️⃣ Support Zone Under Test: Price action is near the critical blue-shaded support area at 149.815. This level has historically held as a strong rebound zone. Buyer activity here could determine the next move!
🔹 3️⃣ Potential Scenarios:
Bullish Case: A strong bounce from the support zone could propel the price higher, maintaining the channel's bullish trend.
Bearish Case: A failure to hold the support level may lead to further declines, possibly testing the lower boundary of the channel.
Insights for Traders: Patience is key—monitor the 149.815 zone for signals before committing to a trade. The combination of price patterns and volume data will provide clarity.

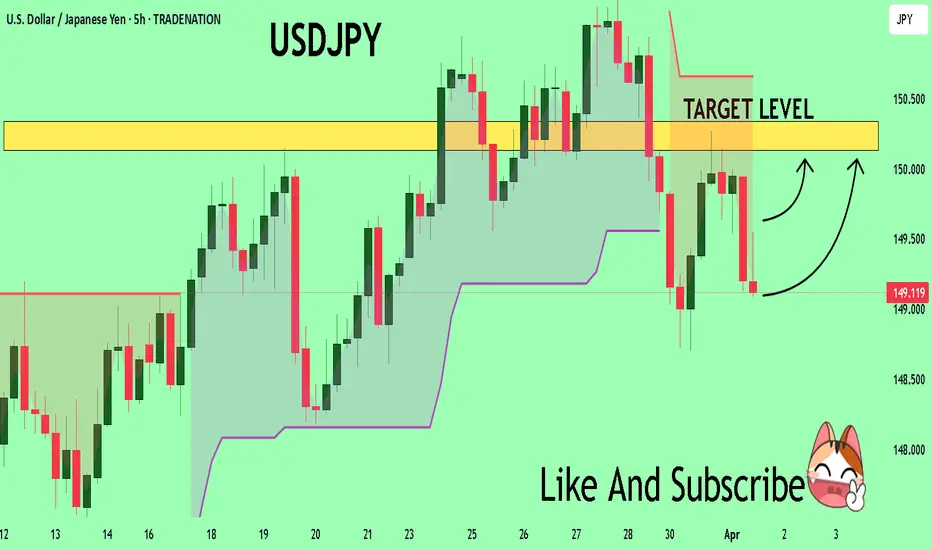
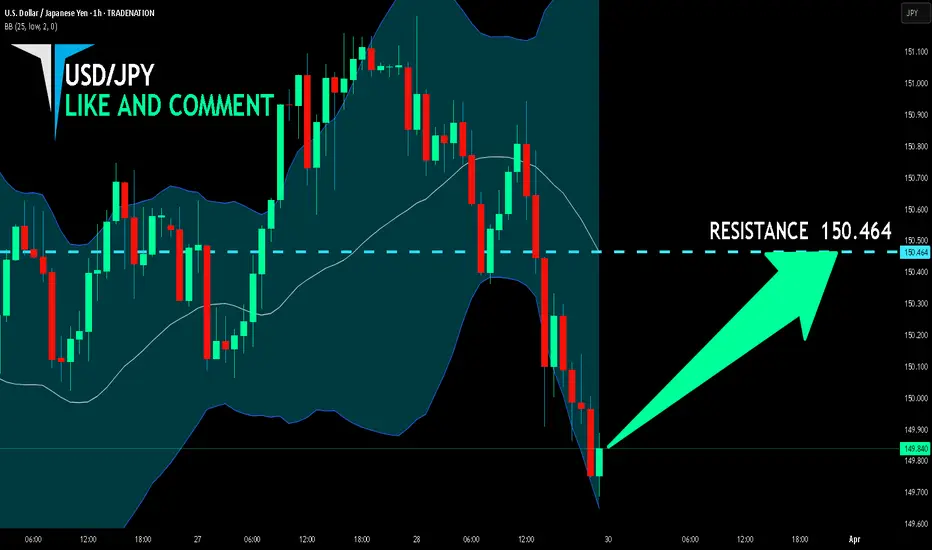
USD/JPY BULLS ARE GAINING STRENGTH|LONG
Hello, Friends!
Previous week’s red candle means that for us the USD/JPY pair is in the downtrend. And the current movement leg was also down but the support line will be hit soon and lower BB band proximity will signal an oversold condition so we will go for a counter-trend long trade with the target being at 150.465.
Disclosure: I am part of Trade Nation's Influencer program and receive a monthly fee for using their TradingView charts in my analysis.
✅LIKE AND COMMENT MY IDEAS✅
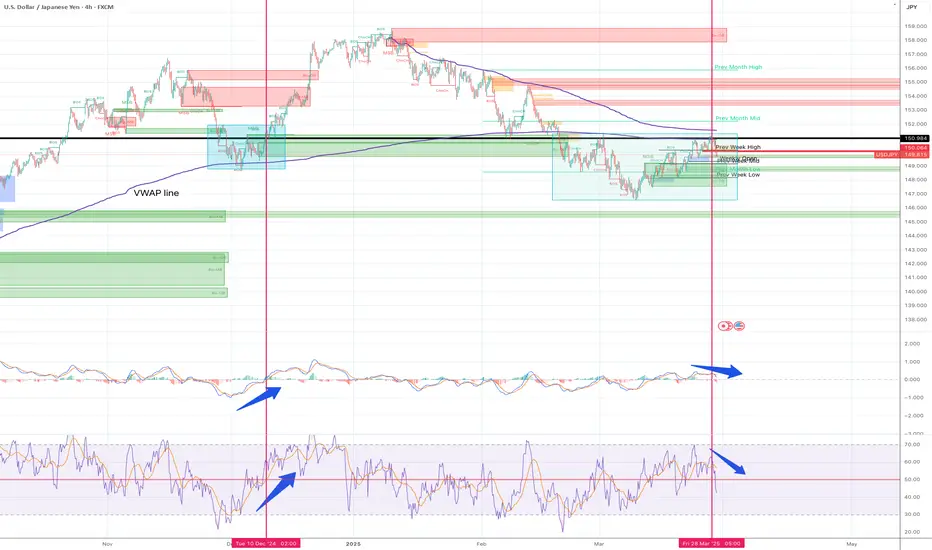
ShortYesterday, I opened a short position during the Asian session and published my trade set up , but I ended up manually closing the position before the US open becauseI was a bit anxious about US GDP data.
But the main concern was the price was hovering around the major support and resistance area and I could see valid reasons to go long as well.
The obvious reason for the long position was the price was forming big inverted head and shoulder patterns. So, if the price broke above the resistance area, there would have been a great upside potential.
However, after the US session opened, I ended up opening a short position. The reasons are written in the article I published yesterday. Please read that article that is linked below.
But another argument I would like to add for the bear scenario is this.
In Nov-Dec 2024, we had a very similar set up ( dark blue rectangular box in the chart.) At the time, the price was also forming the inverted head and shoulder at the same support/resistance zone. Once it broke the resistance line, it took off to the upside. And that same scenario can unfold this time as well.
However, what is different between Dec 2024 period and the current period are:
1) VWAP (volume weighted average price) drawn from the major low in 24th Sept was working as support but this time the same VWAP is working as resistance.
2) MACD and RSI were moving from bear zone to the bull zone, but this time they are moving to the downside from the bull zone.
Therefore, I think the momentum is to the downside this time. The only time will tell.
My current short position is quite small. However, once the direction becomes more clear I plan to add more position because the move to the downside from here can be quite significant.
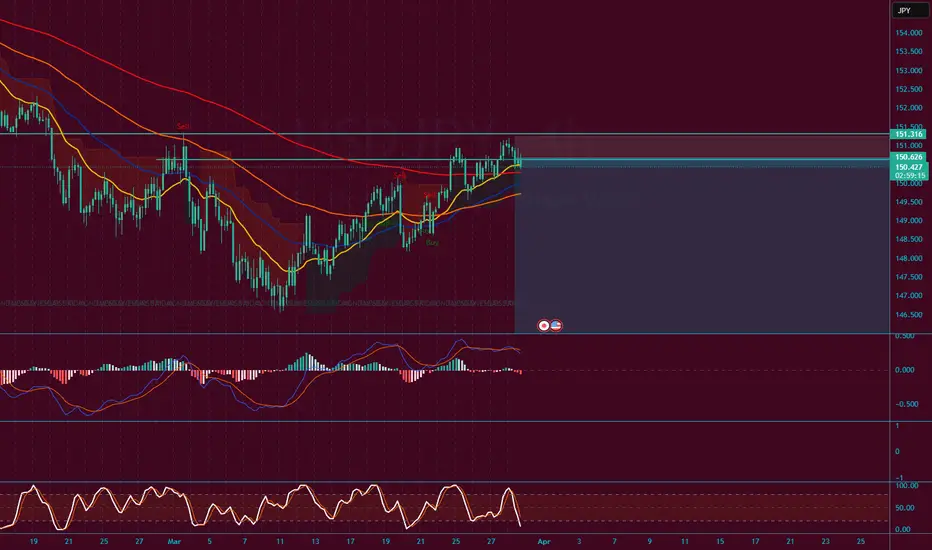
USDJPY analysis week 14🌐Fundamental Analysis
The Federal Reserve (Fed) kept interest rates unchanged in the 4.25% - 4.50% range and forecast core PCE inflation to average 2.8% by year-end. The higher-than-expected inflation data reinforced expectations that the Fed will maintain current interest rates for an extended period. Investors are concerned that these tariffs could add to global inflationary pressures and trigger a recession.
In Japan, the Tokyo CPI rose sharply in March, boosting expectations that the Bank of Japan (BoJ) will continue to raise interest rates this year. The hot inflation data also supported the Yen's appreciation against other currencies.
🕯Technical Analysis
USDJPY is still in a bullish recovery. The pair is facing support at 149.200, preventing further declines. The weekly high around 151.100 is still acting as key resistance before the pair breaks out to 152.000. Conversely, if the trend breaks at 149.200, weekly support is seen at 148.300.
📈📉Trading Signals
SELL USDJPY 151.300-151.100 SL 150.500
SELL USDJPY 152.000-152.200 SL 152.400
BUY USDJPY 149.300-149.100 SL 148.900
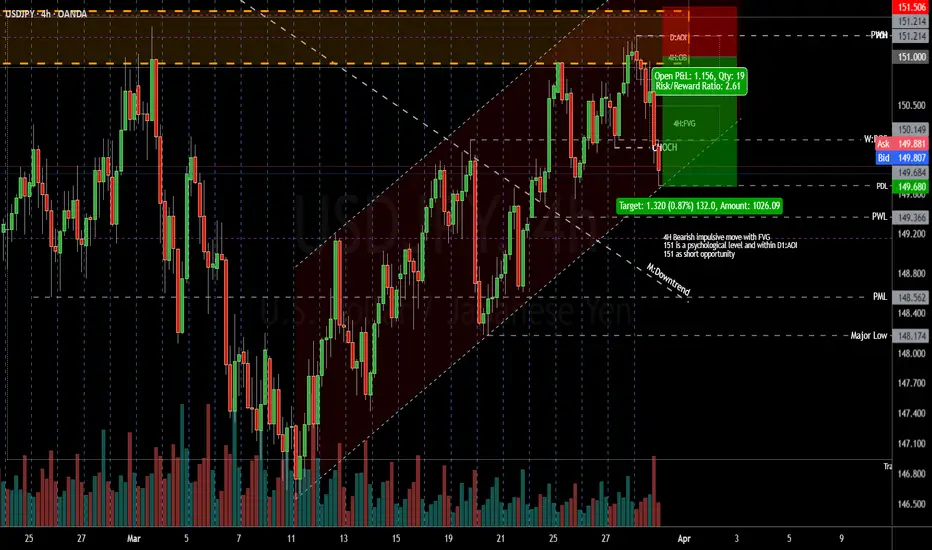
Bearish USDJPY 31 Mar 2025Weekly has a bullish trendline breakout but looking ahead Trump's tariff likely to create volatility for OANDA:USDJPY
Looking to sell near 151 after 4H CHOCH.
My USDJPY Short Idea 28/03/2025Tokyo CPI came in hot today we have inflation in progress signaling mild-hawkish tone for BOJ. BOJ is known for taking decisions slowly so I do not expect a rate hike to happen soon but we may see it in the very near future. Afterall BOJ Interest rate 0.5 is considered high for its historical data. Aiming for 1.00 interest rate is something huge that few people understands its magnitude.
Taking this short attempt.
ShortI had a few failed short trades in the last few weeks for this pair.
My overall bias is bearish and I must admit having a strong bias cost me. I was too eager to execute a trade and I ended up front running and instead of reacting to the price action.
This morning, I opened two short positions (1 position size divided into two) for USDJPY .
Trade set up:
Entry: 150.945Stop Loss: 151.458
Target 1: 149.680 (blue horizontal line - previous week open price, Fair value gap and order block in 4H) Target 2: 148.306 (Previous week low, fair value gap )
Reasons for short entry:
Weekly:
The price had broken and closed below the previous low at 148.65. It went up again but it is respecting FVG at 150.50 zone.
RSI is starting to enter the bear territory.
Daily:
The price is still below EMA 200 and is respecting FVG at 150.50 zone.
RSI line is still in the bear zone.
4H:
The price dropped and closed below the ascending trendline.
I like the candlestick formations at the FVG - very small candles with upper wicks followed by a large engulfing candle. (1H is better to see the price movement). Sorry, I forgot the name of this formation! RSI is presenting negative divergence.
Ideally, it is better to wait for the price to drop, retest and close below 200EMA in 4H and 4H RSI to dive into bear territory. However, I felt there are enough confluences to support my bias and I like the risk:reward for this set up. Therefore, I decided to open a short position, but my position size is small.
Please let me know what you think.

USD/JPY(20250328)Today's AnalysisToday's buying and selling boundaries:
150.74
Support and resistance levels
151.83
151.42
151.16
150.32
150.06
149.66
Trading strategy:
If the price breaks through 151.16, consider buying, the first target price is 151.42
If the price breaks through 150.74, consider selling, the first target price is 150.32

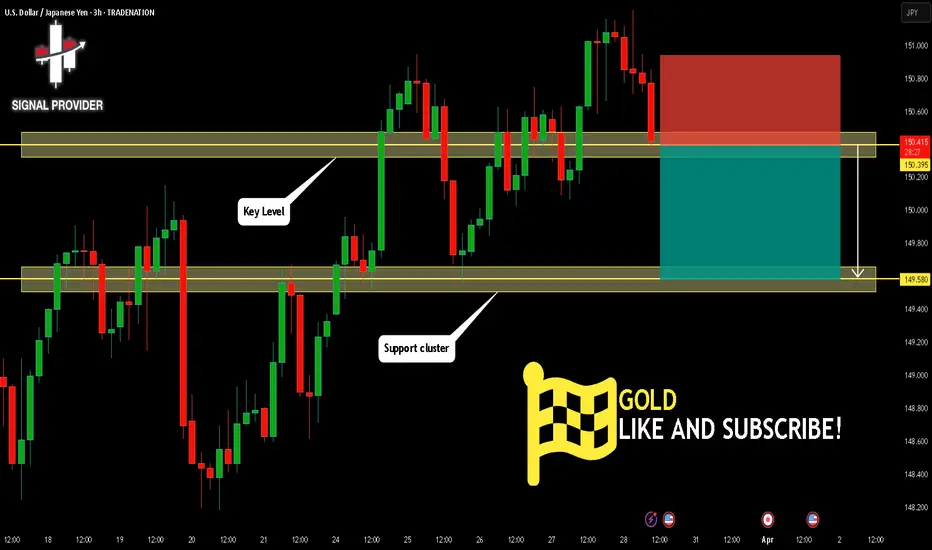
USDJPY Will Go Lower! Short!
Take a look at our analysis for USDJPY.
Time Frame: 3h
Current Trend: Bearish
Sentiment: Overbought (based on 7-period RSI)
Forecast: Bearish
The market is on a crucial zone of supply 150.395.
The above-mentioned technicals clearly indicate the dominance of sellers on the market. I recommend shorting the instrument, aiming at 149.580 level.
P.S
Please, note that an oversold/overbought condition can last for a long time, and therefore being oversold/overbought doesn't mean a price rally will come soon, or at all.
Disclosure: I am part of Trade Nation's Influencer program and receive a monthly fee for using their TradingView charts in my analysis.
Like and subscribe and comment my ideas if you enjoy them!