Skeptic | USD/JPY Analysis: Sharp Uptrend Triggers Ready!Hey, traders, it’s Skeptic! 😎 CMCMARKETS:USDJPY is gearing up for a sharp uptrend move, and if you sleep on it, you might miss it, jump in late, and get stopped out. So, let’s set our scenarios and triggers now to make quick, sharp decisions instead of lagging.
Daily Timeframe: The Big Picture
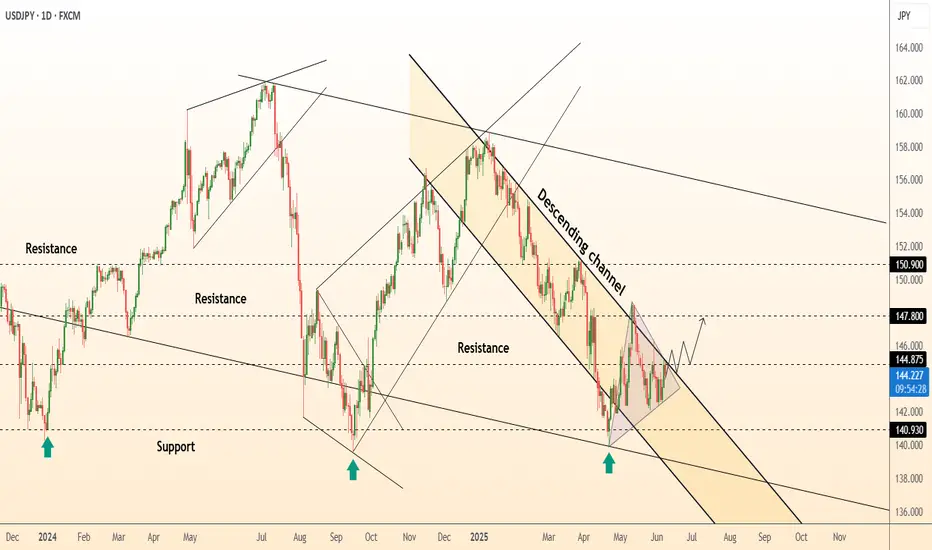
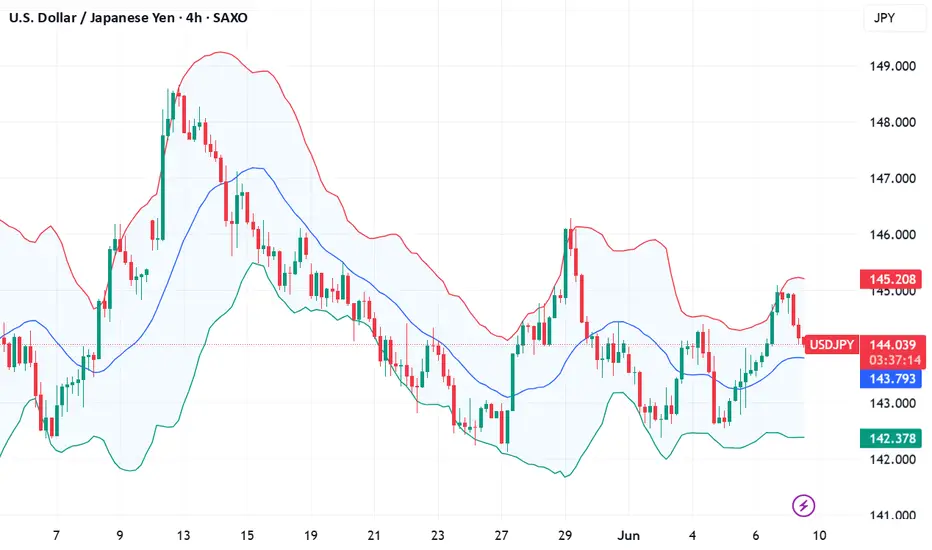
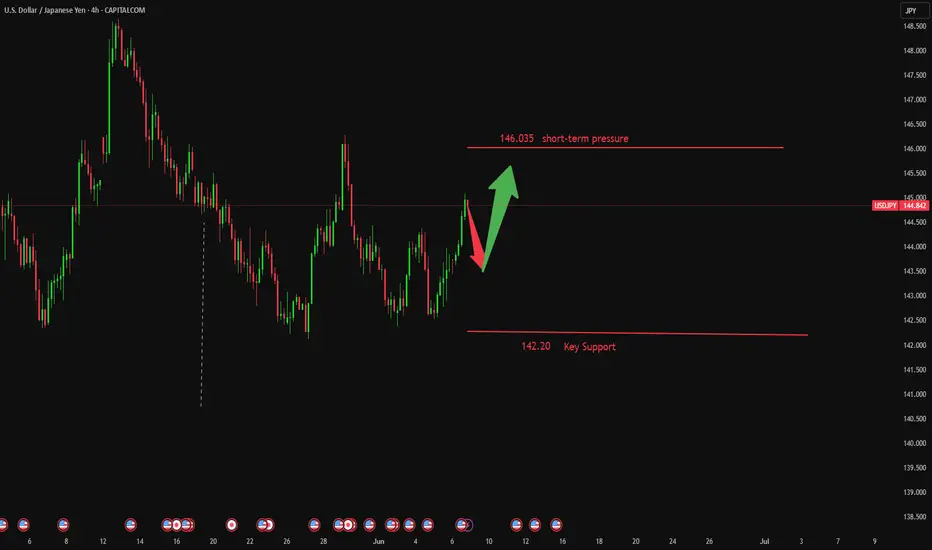
We were in a major bearish trend but now seem stuck in a triangle. The heavy bearish momentum and support zone at 142.232–142.604 —our key level—has held strong with reactions every time we hit it. But, the bearish moves are getting weaker , with shallower slopes and smaller, choppier candles, signaling fading momentum and a higher chance of a reversal. Still, we need a trigger to go long—without it, jumping in is risky. As a skeptical trader , I need solid reasoning for every move. That’s our vibe! :)))
Now, let’s hit the 4-Hour Timeframe for our triggers.
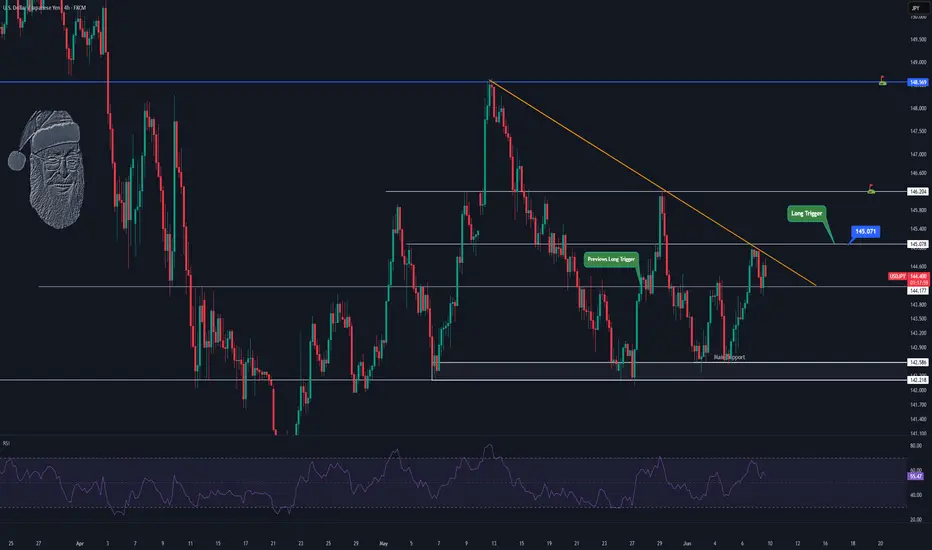
We’ve got a descending trendline , and breaking it upward could spark an uptrend. But here’s the deal: this isn’t a continuation pattern—a break means a trend reversal, so we need extra confirmation beyond just the break.
Our main long trigger is a break above resistance at 145.071 .
Stop loss? Place it below the trendline, previous support, or last low—depends on your strategy.I’m a breakout trader myself
( check my article for deets! ).
For confirmation, watch RSI hitting overbought—it backs the uptrend momentum and can push you to your R/R faster. 😊 I’ll drop an RSI tutorial soon , so stay tuned! If we lose the support zone ( 142.232–142.604 ), expect the bearish trend to continue, so focus on shorts then.
Final word: No FOMO . Wait for your triggers and confirmations. Our motto? No FOMO. No hype. Just reason :)
💬 Let’s Talk!
If this analysis helped you, smash that boost—it means a lot! 😊 Got a pair or setup you want me to hit next? Drop it in the comments. Thanks for chilling with me—keep trading smart! ✌️
USDJPY
Technical Analysis on JPY Price Action (as of June 9, 2025)📈 Technical Analysis on JPY Price Action (as of June 9, 2025)
---
🗂️ Overview:
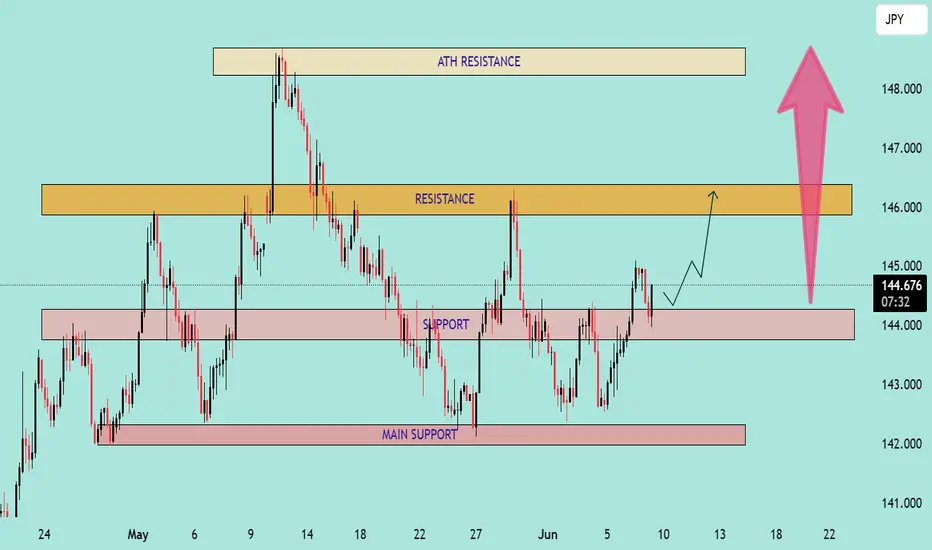
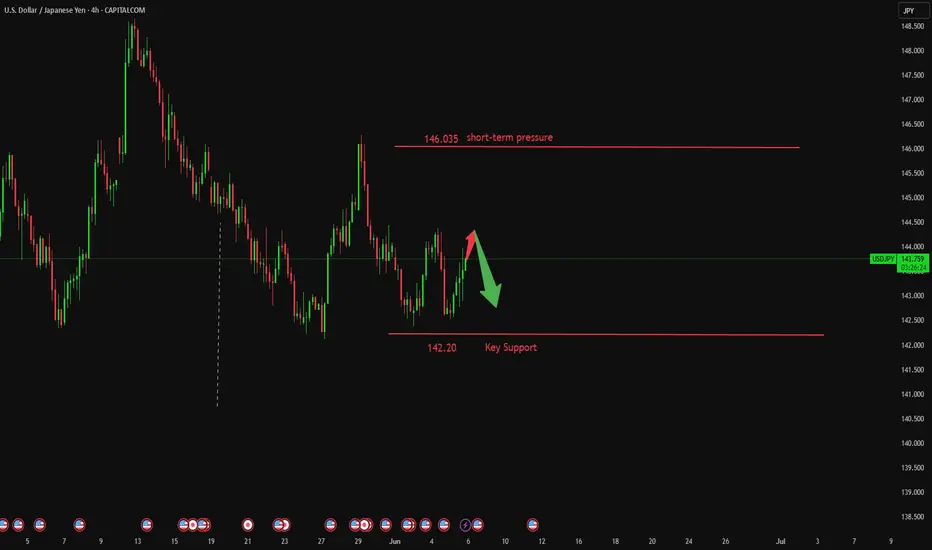
This chart illustrates the price movement of the Japanese Yen (JPY) with clearly defined support and resistance zones. The setup suggests a bullish bias in the short term, with potential for a breakout toward previous highs.
---
🔍 Key Levels Identified:
🟥 Main Support Zone (141.80 – 142.80):
This is a strong demand zone.
Price bounced aggressively from this level in late May.
If broken, could trigger a major downside move 📉.
🟧 Support Zone (143.80 – 144.70):
Price is currently testing this zone.
Holding this area will be crucial for bullish continuation.
🟨 Resistance Zone (145.80 – 146.60):
This is the next target for bulls 🐂.
Historically acted as a supply zone, causing pullbacks.
🟫 ATH Resistance Zone (~147.80 – 148.50):
The All-Time High (ATH) resistance zone.
Strong rejection from here in the past; likely to act as a hard ceiling again 🚫.
---
🔄 Price Action Forecast:
🕊️ If the current support holds, expect a bullish move toward the 146.00–146.50 resistance.
📈 A breakout above this resistance could initiate a move to the ATH zone (147.80+).
🚨 A breakdown below 143.80 could lead to retesting the main support near 142.00.
---
📊 Technical Sentiment:
Bias: Bullish ✅
Trend: Recovering uptrend after forming a higher low.
Confirmation Needed: Break and retest of the 145.80–146.60 resistance for continuation.
---
✅ Trading Tip:
Wait for either:
🔁 A retest and bounce from 144.00 for long entries 🎯.
❌ A rejection at resistance for potential short opportunities if price fails to break 146.60.
---
📌 Conclusion:
The market shows bullish intent from support, but traders should watch the reaction near the resistance zone to confirm trend continuation. 📍Patience and confirmation are key.
DeGRAM | USDJPY retesting the resistance level📊 Technical Analysis
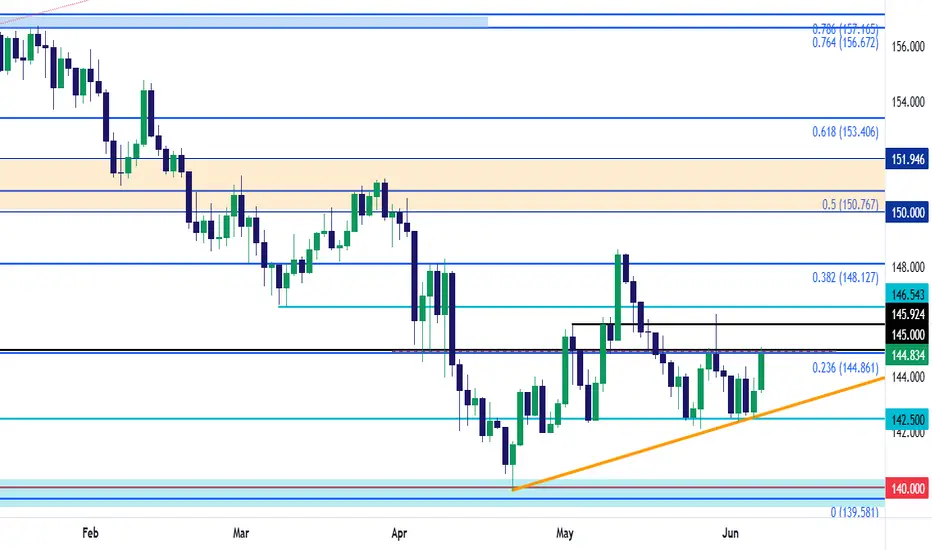
● Four consecutive higher-lows off 140.9 have carved a rising flag that presses the channel roof (144.8); flag depth projects to the April swing-top/ Fib cluster at 147.8 once 145 is cleared.
● Daily RSI holds above 50 and price is now trading back above the broken wedge-cap (142.9), confirming it as demand and tilting risk toward the 150.9 macro ceiling.
💡 Fundamental Analysis
● US 2-yr yields stay >4.70 % after solid ISM-services prices, while BoJ minutes show members preferring “patient” normalisation; the widening policy gap keeps yen funding pressure intact.
✨ Summary
Long 142.9-144.0; break of 145 targets 147.8, stretch 150.9. Bull view invalidated on a daily close below 140.9.
-------------------
Share your opinion in the comments and support the idea with like. Thanks for your support!
USDJPY and GBPJPY Analysis todayHello traders, this is a complete multiple timeframe analysis of this pair. We see could find significant trading opportunities as per analysis upon price action confirmation we may take this trade. Smash the like button if you find value in this analysis and drop a comment if you have any questions or let me know which pair to cover in my next analysis.

Fundamental Market Analysis for June 9, 2025 USDJPYThe Japanese Yen (JPY) is rising at the start of the new week, reacting to upward revisions to Japan's first quarter GDP data. This comes amid signs of rising inflation in Japan and confirmation of bets that the Bank of Japan (BoJ) will continue to raise interest rates, which in turn provides a slight boost to the JPY. In addition, a modest decline in the US Dollar (USD) is putting some downward pressure on the USD/JPY pair during the Asian session.
For now, the Yen appears to have broken a two-day losing streak against its US counterpart, although traders may refrain from aggressive directional bets ahead of key US-China trade talks in London. In addition, stronger-than-expected US jobs data released on Friday dampened hopes that the Federal Reserve (Fed) will cut interest rates soon this year, which could serve as a tailwind for the dollar and limit USD/JPY pair losses.
Trade recommendation: SELL 143.85, SL 144.85, TP 141.85
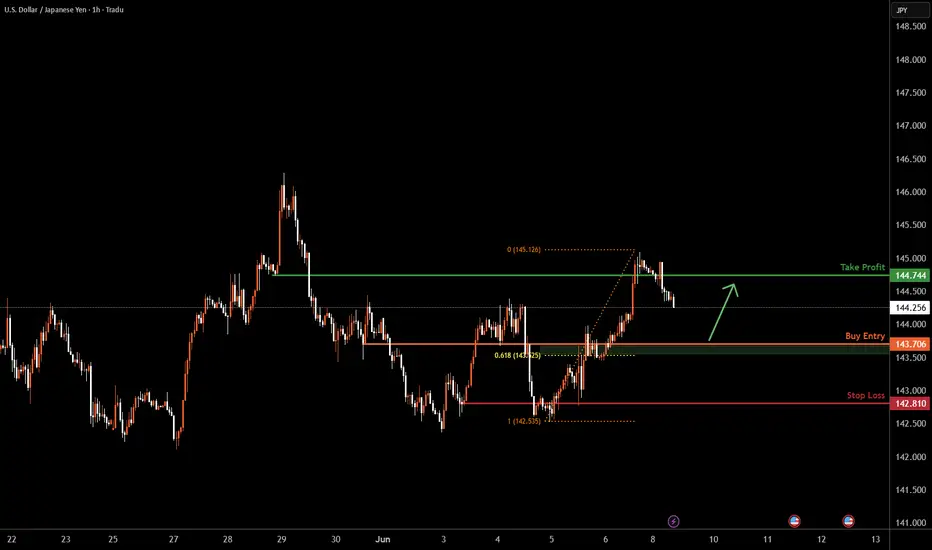
USDJPY H1 I Bullish Bounce OffBased on the H1 chart analysis, we can see that the price is falling toward our buy entry at 143.70, which is a pullback support that aligns closely with the 61.8% Fib retracement.
Our take profit will be at 144.74, which is a pullback resistance level.
The stop loss will be placed at 142.81, an overlap support.
High Risk Investment Warning
Trading Forex/CFDs on margin carries a high level of risk and may not be suitable for all investors. Leverage can work against you.
Stratos Markets Limited (tradu.com/uk ):
CFDs are complex instruments and come with a high risk of losing money rapidly due to leverage. 63% of retail investor accounts lose money when trading CFDs with this provider. You should consider whether you understand how CFDs work and whether you can afford to take the high risk of losing your money.
Stratos Europe Ltd (tradu.com/eu ):
CFDs are complex instruments and come with a high risk of losing money rapidly due to leverage. 63% of retail investor accounts lose money when trading CFDs with this provider. You should consider whether you understand how CFDs work and whether you can afford to take the high risk of losing your money.
Stratos Global LLC (tradu.com/en ):
Losses can exceed deposits.
Please be advised that the information presented on TradingView is provided to Tradu (‘Company’, ‘we’) by a third-party provider (‘TFA Global Pte Ltd’). Please be reminded that you are solely responsible for the trading decisions on your account. There is a very high degree of risk involved in trading. Any information and/or content is intended entirely for research, educational and informational purposes only and does not constitute investment or consultation advice or investment strategy. The information is not tailored to the investment needs of any specific person and therefore does not involve a consideration of any of the investment objectives, financial situation or needs of any viewer that may receive it. Kindly also note that past performance is not a reliable indicator of future results. Actual results may differ materially from those anticipated in forward-looking or past performance statements. We assume no liability as to the accuracy or completeness of any of the information and/or content provided herein and the Company cannot be held responsible for any omission, mistake nor for any loss or damage including without limitation to any loss of profit which may arise from reliance on any information supplied by TFA Global Pte Ltd.
The speaker(s) is neither an employee, agent nor representative of Tradu and is therefore acting independently. The opinions given are their own, constitute general market commentary, and do not constitute the opinion or advice of Tradu or any form of personal or investment advice. Tradu neither endorses nor guarantees offerings of third-party speakers, nor is Tradu responsible for the content, veracity or opinions of third-party speakers, presenters or participants.
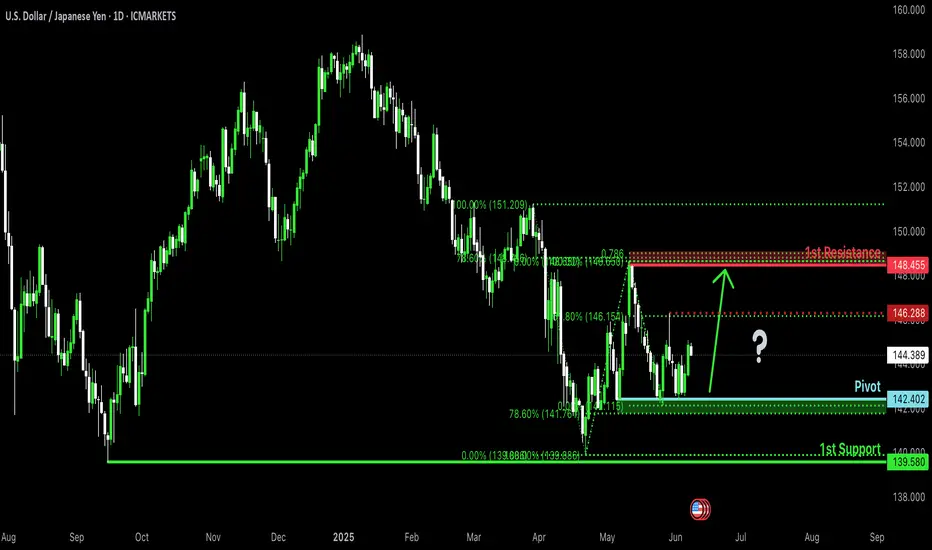
Bullish bounce?USD/JPY is falling towards the pivot which acts as a pullback support and could rise to the 1st resistance which has been identified as a pullback resistance.
Pivot: 142.40
1st Support: 139.58
1st Resistance: 148.45
Risk Warning:
Trading Forex and CFDs carries a high level of risk to your capital and you should only trade with money you can afford to lose. Trading Forex and CFDs may not be suitable for all investors, so please ensure that you fully understand the risks involved and seek independent advice if necessary.
Disclaimer:
The above opinions given constitute general market commentary, and do not constitute the opinion or advice of IC Markets or any form of personal or investment advice.
Any opinions, news, research, analyses, prices, other information, or links to third-party sites contained on this website are provided on an "as-is" basis, are intended only to be informative, is not an advice nor a recommendation, nor research, or a record of our trading prices, or an offer of, or solicitation for a transaction in any financial instrument and thus should not be treated as such. The information provided does not involve any specific investment objectives, financial situation and needs of any specific person who may receive it. Please be aware, that past performance is not a reliable indicator of future performance and/or results. Past Performance or Forward-looking scenarios based upon the reasonable beliefs of the third-party provider are not a guarantee of future performance. Actual results may differ materially from those anticipated in forward-looking or past performance statements. IC Markets makes no representation or warranty and assumes no liability as to the accuracy or completeness of the information provided, nor any loss arising from any investment based on a recommendation, forecast or any information supplied by any third-party.
USDJPY Short Setup: OB Rejection + Fib Premium Sell-Off IncomingUSDJPY (1H Chart) | Institutional Short Setup with OB + Fib Confluence
The market is showing clear Smart Money Distribution behavior — with a rejection from a high-confluence zone combining Order Block, Premium Fib Levels, and bearish momentum shift.
🔍 Smart Money Setup Breakdown:
🔻 Bearish Order Block Zone (OB)
Price wicked into OB zone and got instantly rejected
OB located precisely at the 70.5% – 79% premium range
Mark of institutional sell-side interest
📐 Fibonacci Retracement + Premium Zone
Retracement from swing high (144.973) to swing low (144.436)
Premium zone between 61.8% to 79% aligns with OB (144.700–144.973)
Entry taken from this zone for high-probability sell setup
📉 Bearish Confirmation
Aggressive bearish reaction post-OB tap
Market structure flipping bearish
Momentum candle breaks previous bullish leg
🔻 Target Zones (Measured Fib Extensions)
-27%: 144.200
-62%: 144.000
-100%: 143.803
-161.8%: 143.300 (extended liquidity draw)
🧠 Chart Ninja Entry Plan:
🔹 Entry Zone 144.784 – 144.973 (OB + Premium Fib + FVG rejection)
🔻 SL Above 145.000 (above OB wick)
📉 TP 1 144.200 (first fib extension)
📉 TP 2 143.803 (full -100% extension)
⚖️ RRR Approx. 1:4+ — stealthy sniper precision
💬 Pro Tip from the Ninja Dojo:
The market doesn’t move because of indicators — it moves because of liquidity.
Find the OB. Wait for the imbalance. Strike where Smart Money hides. 🥷📊
This isn’t retail — this is calculated execution.
🎯 Save this chart before price melts to 143.8
💬 Drop your entry zone & SL idea in comments

Japan : Q1 2025 GDP Revision: Milder ContractionFinal data for Q1 2025 shows that Japan's economy contracted by 0.2% year-on-year (YoY), better than the initial estimate of -0.7%
(Sources: english.kyodonews.net, reuters.com, fxstreet.com).
Growth in household consumption and an increase in inventory levels were the main drivers, although the export sector remained a drag due to U.S. tariff pressures.
On a quarterly basis (QoQ), the economy recorded flat growth (0.0%), exceeding expectations of a -0.2% contraction
(Sources: reuters.com, fxstreet.com).
In summary: The revision shows that Japan’s economy is not as weak as initially feared, though it still reflects underlying sluggish conditions.
USD/JPYPrice has accumulated, It is now in a manipulation faze.
I am waiting for early seller liquidity to be swept before looking for short confirmation for the distribution faze targeting the major low.

The Japanese yen may face further downward pressure.The USD/JPY has trended higher in a volatile manner this week, rising 0.56% on a weekly basis and closing at 144.87 on Friday, marking the second consecutive week of gains. The Japanese yen, as a safe-haven currency, showed weakness this week, reflecting market concerns about Japan's economic outlook and the impact of Trump's tariff policies. The remarks of Kazuo Ueda (Governor of the Bank of Japan) reflected worries about the effects of the trade war. Market expectations indicate that the Bank of Japan is likely to maintain a dovish stance in the short term. If next week's GDP data is weak, the yen may face further downward pressure.
Humans need to breathe, and perfect trading is like breathing—maintaining flexibility without needing to trade every market swing. The secret to profitable trading lies in implementing simple rules: repeating simple tasks consistently and enforcing them strictly over the long term.
USDJPY Is Very Bullish! Buy!
Please, check our technical outlook for USDJPY.
Time Frame: 4h
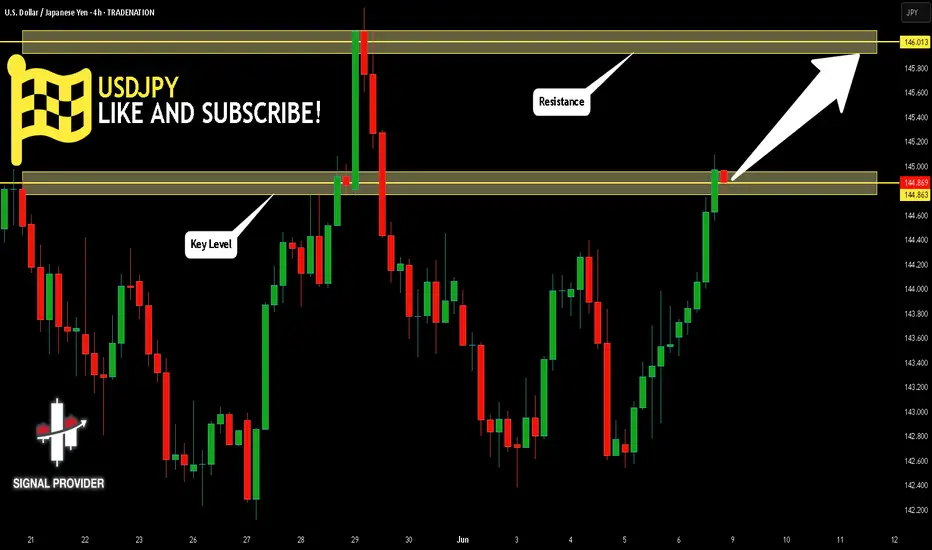
Current Trend: Bullish
Sentiment: Oversold (based on 7-period RSI)
Forecast: Bullish
The price is testing a key support 144.863.
Current market trend & oversold RSI makes me think that buyers will push the price. I will anticipate a bullish movement at least to 146.013 level.
P.S
The term oversold refers to a condition where an asset has traded lower in price and has the potential for a price bounce.
Overbought refers to market scenarios where the instrument is traded considerably higher than its fair value. Overvaluation is caused by market sentiments when there is positive news.
Disclosure: I am part of Trade Nation's Influencer program and receive a monthly fee for using their TradingView charts in my analysis.
Like and subscribe and comment my ideas if you enjoy them!
USDJPY Pullback? Watch OB + Fib Confluence for the Next Buy WaveUSDJPY | 30-Min Chart – Smart Money Buy Setup in Progress
After a sharp bullish rally, USDJPY is setting up for a classic retracement buy scenario. We're now watching a key confluence zone between Fibonacci levels, a bullish order block, and internal trend structure — all lining up for a high-probability long setup.
🔍 Trade Breakdown:
📉 Pullback Expected Before Next Rally:
Price rejected near short-term resistance and is retracing from local highs.
Retracement aligns with key OB + 61.8–79% Fib zone = institutional entry zone.
🟣 Order Block (OB) Demand Zone: 143.086 – 142.828
Last bullish candle before explosive rally = demand OB.
OB sits within premium Fib retracement = Smart Money buy zone.
📐 Fibonacci Levels (Swing Low to High):
61.8% ≈ 143.200
70.5% ≈ 143.000
79% ≈ 142.828
This is the kill zone for institutional longs — where Smart Money typically enters before expansion.
🔵 Projected Play:
Retracement to OB/Fib confluence.
Bullish rejection from OB zone.
Impulse move targeting previous highs and beyond.
💡 Target Level: 144.396 (sits just above prior high and aligns with -27% Fib extension)
📉 Current Bias:
Short-term retracement ➝ Mid-term bullish continuation
Expecting price to dip into OB then launch.
🧠 Chart Ninja Entry Plan:
🔹 Entry Zone: 143.086 – 142.828
🔻 SL Below: 142.650 (below OB/Fib + structure wick)
📈 Target: 144.396
⚖️ RRR: 1:3+ — high confluence risk-managed buy
🔍 Technical Confluence Checklist:
✅ OB demand zone
✅ 61.8–79% retracement
✅ Bullish market structure
✅ Internal channel support
✅ Momentum slow before entry
📍 Save this chart — don’t chase, let price come to you
💬 Comment if you're watching this OB too
👣 Follow @ChartNinjas88 for precision-based setups daily

USDJPY Buy Setup! OB + 61.8% Fib + Trend Channel ConfluenceUSDJPY | 30-Min Chart – High Probability Buy Setup in Progress
USDJPY is currently respecting a bullish market structure within a well-defined ascending trend channel. Smart Money Concepts (SMC) traders are watching for a precise reaction at the confluence of a key Order Block (OB), Fibonacci retracement levels, and mid-channel support.
🔍 Trade Breakdown:
Bullish Market Structure
Price has shifted from bearish to bullish after forming a key higher low and continuing with higher highs within the trend channel. The structure is being respected with multiple taps on both upper and lower channel boundaries.
Internal Liquidity & Order Flow:
Price previously swept sell-side liquidity below the recent swing low and sharply reversed, confirming internal liquidity engineering and institutional involvement.
Currently, we’re seeing price stall after rejecting the upper channel and OB zone. A retracement into the discount zone is anticipated before continuation.
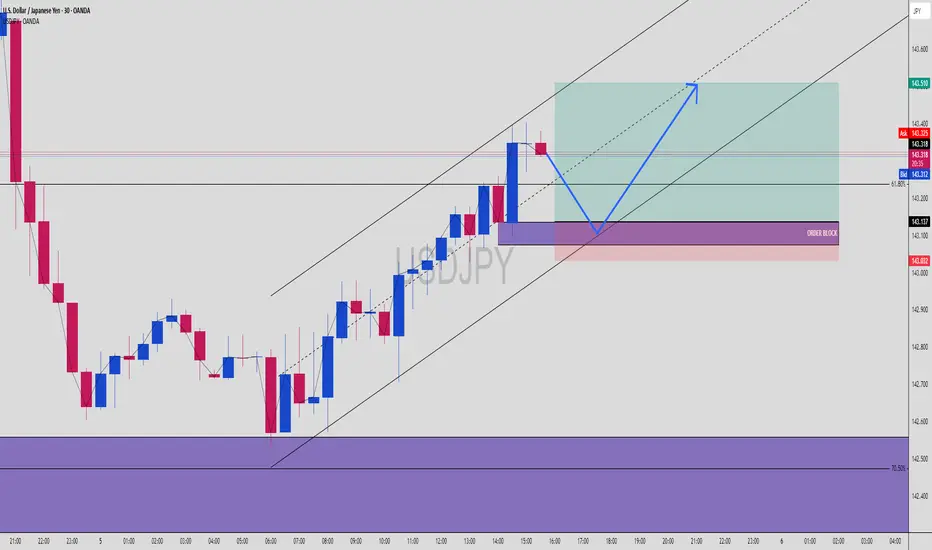
🟣 Order Block Zone (OB): 143.032 – 143.137
A clear bullish OB formed after a strong impulsive move, marking the last down candle before the bullish break of structure.
Located just above the 61.8% Fibonacci level — strong confluence.
📐 Fibonacci Levels from Last Swing Low to High:
61.8% = 143.137
70.5% = 143.032
Potential reaction zone aligns perfectly with OB + trendline + psychological round level (143.000 area)
📊 Buy Setup Expectation:
USDJPY is expected to retrace into the OB/Fib confluence zone before a bullish continuation toward the upper boundary of the trend channel and beyond.
🔵 Projected Path:
Price dips into OB → reacts to 61.8–70.5% retracement → bullish reversal → break to fresh highs near 143.510 or higher
🧠 Chart Ninja Entry Plan:
🔹 Entry Zone: 143.032 – 143.137 (OB + 61.8–70.5% Fib)
🔻 SL Below: 143.000 (beneath OB and psychological level)
📈 Target: 143.510 (channel top + previous supply zone)
⚖️ RRR: Approx. 1:3+ — high precision Smart Money entry
💬 Ninja Wisdom:
Patience before profit. Wait for price to return to the zone where institutions left footprints — the OB at equilibrium pricing. Combine OB + Fib + channel and you're trading like the banks.
Retail buys the breakout. Smart Money buys the pullback. 🥷📚
📍 Save this chart before the setup triggers!
🧠 Do you see the same confluence? Comment your entry/TP/SL plans ⬇️
👣 Follow @ChartNinjas88 for more sniper setups on major FX pairs every session!
USDJPY:800+ PIPS Dropping Well Since Our First Idea!Dear Traders,
Since we posted our idea when price was trading at 158 we told you that this will be a massive dropped and since then price has proven us right, now we think there is another big drop is on the way. Please use proper risk management while trading.

USD/JPY Higher-Low, 142.50 DefenseUSD/JPY continues to exert force on the USD and the past week was no different. Despite an open door for sellers, a higher-low showed with a hold of the same 142.50 support level that was in-play a week prior. That price traded early on Tuesday (Monday night in the states) and then on Thursday (Wed night in the U.S.) buyers came in to hold the low just above that price, illustrating a degree of bullish anticipation.
Reports of slowing pace of bond tapering from the BoJ, and perhaps even smaller reductions to the banks bond buying helped to soften long-term Japanese yields: 40 year JGBs made a move towards the 3% marker after skyrocketing up to 3.7% just a few weeks ago. That helped JPY-weakness to continue against the USD and USD/JPY is back to re-testing the 145.00 handle in the pair.
This remains a key component if a USD turn is nearby, but interestingly working with that turn may be more attractive against the Euro in a pair like EUR/USD as USD/JPY has continued to show traps on both sides of the market for much of 2025 trade. - js
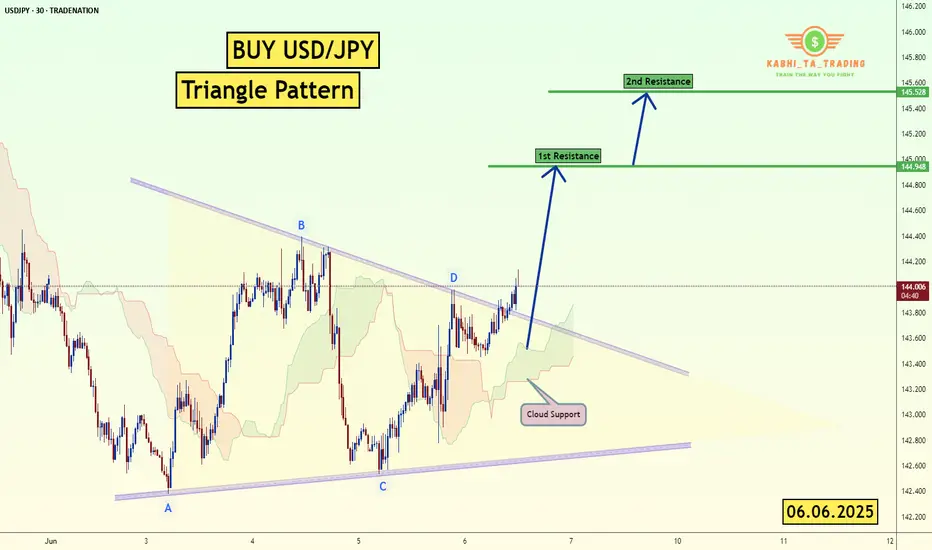
USD/JPY - Triangle Breakout (06.06.2025)The USD/JPY pair on the M30 timeframe presents a Potential Buying Opportunity due to a recent Formation of a Triangle Pattern. This suggests a shift in momentum towards the upside and a higher likelihood of further advances in the coming hours.
Possible Long Trade:
Entry: Consider Entering A Long Position around Trendline Of The Pattern.
Target Levels:
1st Resistance – 144.94
2nd Resistance – 145.52
🎁 Please hit the like button and
🎁 Leave a comment to support for My Post !
Your likes and comments are incredibly motivating and will encourage me to share more analysis with you.
Best Regards, KABHI_TA_TRADING
Thank you.
Disclosure: I am part of Trade Nation's Influencer program and receive a monthly fee for using their TradingView charts in my analysis.
USDJPY Analysis todayHello traders, this is a complete multiple timeframe analysis of this pair. We see could find significant trading opportunities as per analysis upon price action confirmation we may take this trade. Smash the like button if you find value in this analysis and drop a comment if you have any questions or let me know which pair to cover in my next analysis.

Bullish rise off pullback support?USD/JPY has bounced off the pivot and could rise to the 1st resistance that aligns with the 61.8% Fibonacci projection.
Pivot: 143.45
1st Support: 143.08
1st Resistance: 144.42
Risk Warning:
Trading Forex and CFDs carries a high level of risk to your capital and you should only trade with money you can afford to lose. Trading Forex and CFDs may not be suitable for all investors, so please ensure that you fully understand the risks involved and seek independent advice if necessary.
Disclaimer:
The above opinions given constitute general market commentary, and do not constitute the opinion or advice of IC Markets or any form of personal or investment advice.
Any opinions, news, research, analyses, prices, other information, or links to third-party sites contained on this website are provided on an "as-is" basis, are intended only to be informative, is not an advice nor a recommendation, nor research, or a record of our trading prices, or an offer of, or solicitation for a transaction in any financial instrument and thus should not be treated as such. The information provided does not involve any specific investment objectives, financial situation and needs of any specific person who may receive it. Please be aware, that past performance is not a reliable indicator of future performance and/or results. Past Performance or Forward-looking scenarios based upon the reasonable beliefs of the third-party provider are not a guarantee of future performance. Actual results may differ materially from those anticipated in forward-looking or past performance statements. IC Markets makes no representation or warranty and assumes no liability as to the accuracy or completeness of the information provided, nor any loss arising from any investment based on a recommendation, forecast or any information supplied by any third-party.

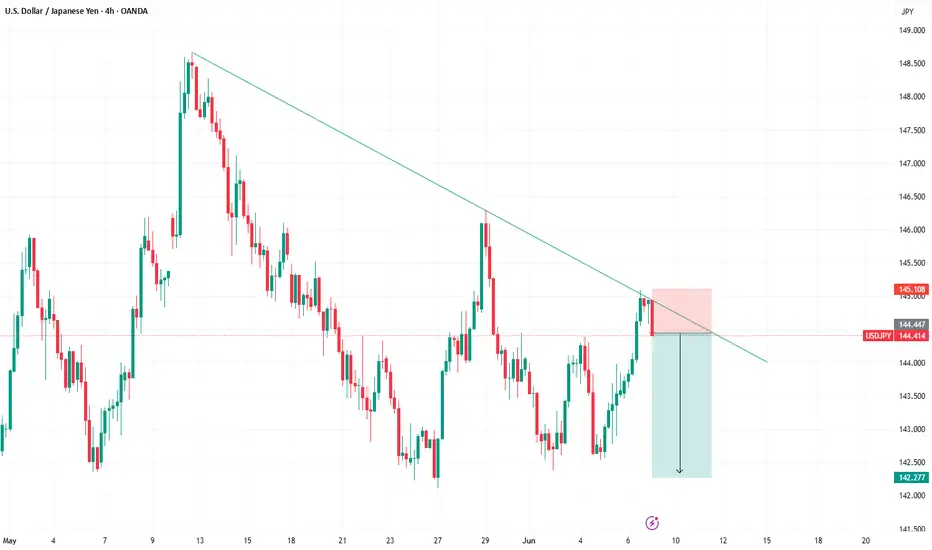
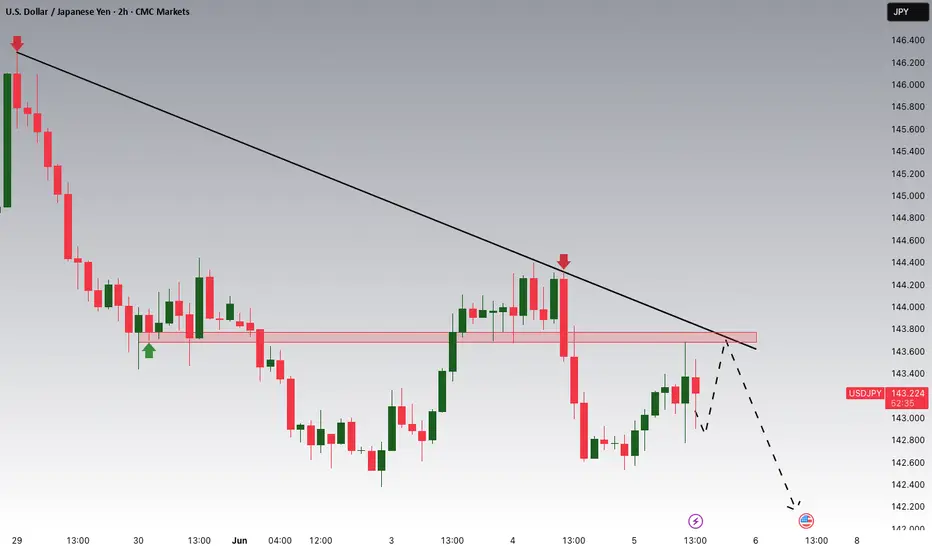
USD/JPY H1 | Overlap Resistance at 78.6% Fibonacci RetracementUSD/JPY is rising towards an overlap resistance and could potentially reverse off this level to drop lower.
Sell entry is at 143.88 which is an overlap resistance that aligns close to the 78.6% Fibonacci retracement.
Stop loss is at 144.55 which is a level that sits above the 50.0% Fibonacci retracement and a multi-swing-high resistance.
Take profit is at 143.02 which is a swing-low support.
High Risk Investment Warning
Trading Forex/CFDs on margin carries a high level of risk and may not be suitable for all investors. Leverage can work against you.
Stratos Markets Limited (tradu.com ):
CFDs are complex instruments and come with a high risk of losing money rapidly due to leverage. 63% of retail investor accounts lose money when trading CFDs with this provider. You should consider whether you understand how CFDs work and whether you can afford to take the high risk of losing your money.
Stratos Europe Ltd (tradu.com ):
CFDs are complex instruments and come with a high risk of losing money rapidly due to leverage. 63% of retail investor accounts lose money when trading CFDs with this provider. You should consider whether you understand how CFDs work and whether you can afford to take the high risk of losing your money.
Stratos Global LLC (tradu.com ):
Losses can exceed deposits.
Please be advised that the information presented on TradingView is provided to Tradu (‘Company’, ‘we’) by a third-party provider (‘TFA Global Pte Ltd’). Please be reminded that you are solely responsible for the trading decisions on your account. There is a very high degree of risk involved in trading. Any information and/or content is intended entirely for research, educational and informational purposes only and does not constitute investment or consultation advice or investment strategy. The information is not tailored to the investment needs of any specific person and therefore does not involve a consideration of any of the investment objectives, financial situation or needs of any viewer that may receive it. Kindly also note that past performance is not a reliable indicator of future results. Actual results may differ materially from those anticipated in forward-looking or past performance statements. We assume no liability as to the accuracy or completeness of any of the information and/or content provided herein and the Company cannot be held responsible for any omission, mistake nor for any loss or damage including without limitation to any loss of profit which may arise from reliance on any information supplied by TFA Global Pte Ltd.
The speaker(s) is neither an employee, agent nor representative of Tradu and is therefore acting independently. The opinions given are their own, constitute general market commentary, and do not constitute the opinion or advice of Tradu or any form of personal or investment advice. Tradu neither endorses nor guarantees offerings of third-party speakers, nor is Tradu responsible for the content, veracity or opinions of third-party speakers, presenters or participants.

USDJPY is Nearing an Important ResistanceHey Traders, in today's trading session we are monitoring USDJPY for a selling opportunity around 143.700 zone, USDJPY is trading in a downtrend and currently is in a correction phase in which it is approaching the trend at 143.700 support and resistance area.
Trade safe, Joe.
USD/JPY Trapped in Consolidation QuagmireDuring the European session, the USD/JPY exchange rate oscillated around 143.10, extending the consolidation pattern triggered by the weak US dollar overnight. Influenced by the worse-than-expected US May ADP and ISM services data, the US Dollar Index fell to a six-week low of 98.60, and the USD/JPY rate also hit a low of 142.53. Subsequently, it rebounded slightly supported by the stable results of Japan's 30-year government bond auction and the decline in yields. Currently, the market is widely focused on the upcoming US May Non-Farm Payrolls (NFP) report and is reassessing the path of the Federal Reserve's monetary policy outlook.
Humans need to breathe, and perfect trading is like breathing—maintaining flexibility without needing to trade every market swing. The secret to profitable trading lies in implementing simple rules: repeating simple tasks consistently and enforcing them strictly over the long term.
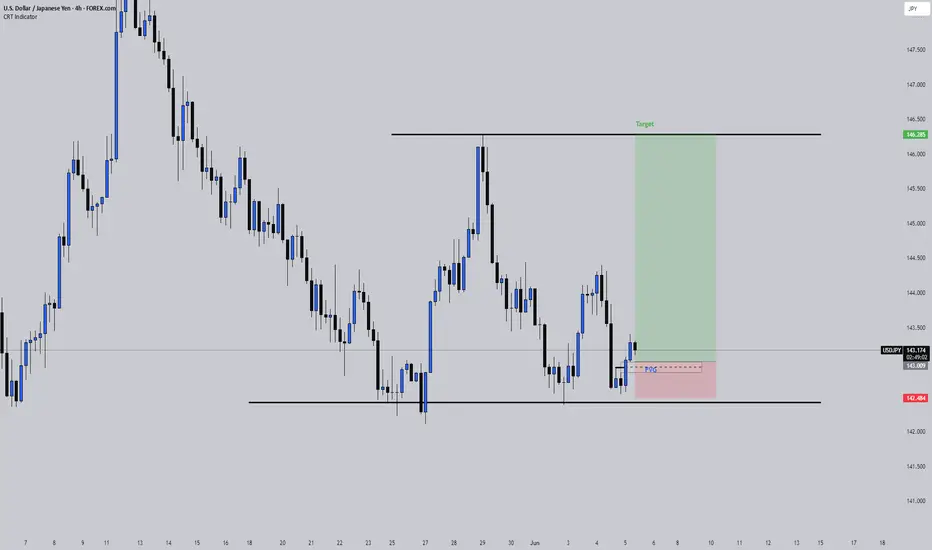
USDJPY: Will This CRT FVG Hold After the PWL Sweep?Price action on USDJPY reflects a clean execution of Candle Range Theory (CRT). Following a sweep of the Previous Week’s Low (PWL), price reacted from a higher timeframe demand zone, grabbing sell-side liquidity before printing a bullish Break of Structure (BOS). This BOS confirmed a shift in market intent and set the stage for a retracement into a clearly defined Fair Value Gap (FVG). I refined the entry on the 4H chart, waiting for price to return to the FVG zone, with risk placed just below the sweep wick. The target is mapped to the next logical supply above a cluster of equal highs and prior inefficiency. This setup reflects a high-conviction CRT play, built from top-down analysis and confluences rooted in market structure, liquidity, and imbalance logic.