USD/JPY Analysis: Bears Put Pressure on Key SupportUSD/JPY Analysis: Bears Put Pressure on Key Support
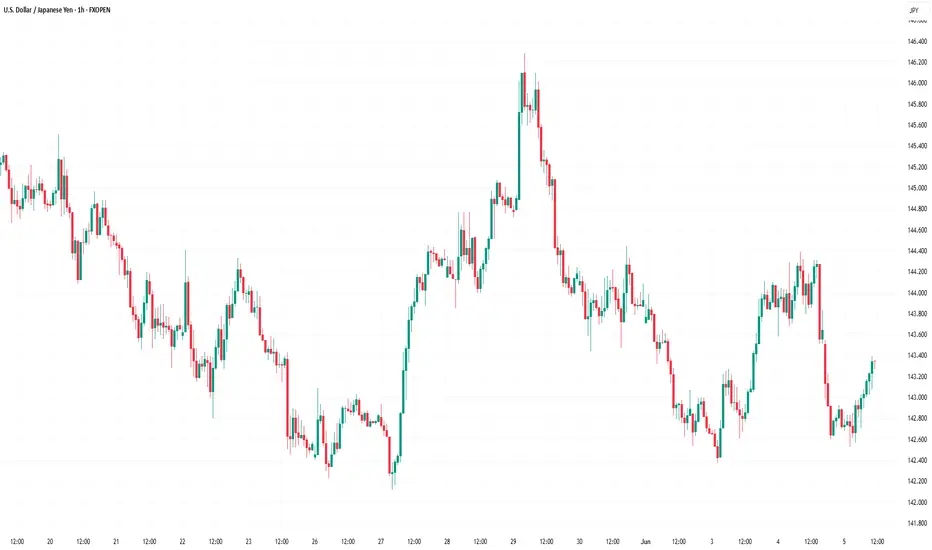
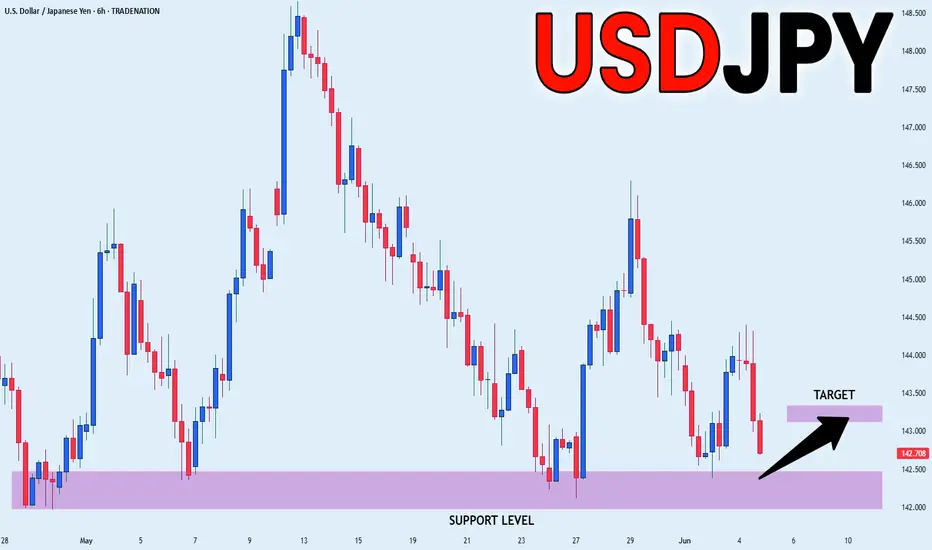
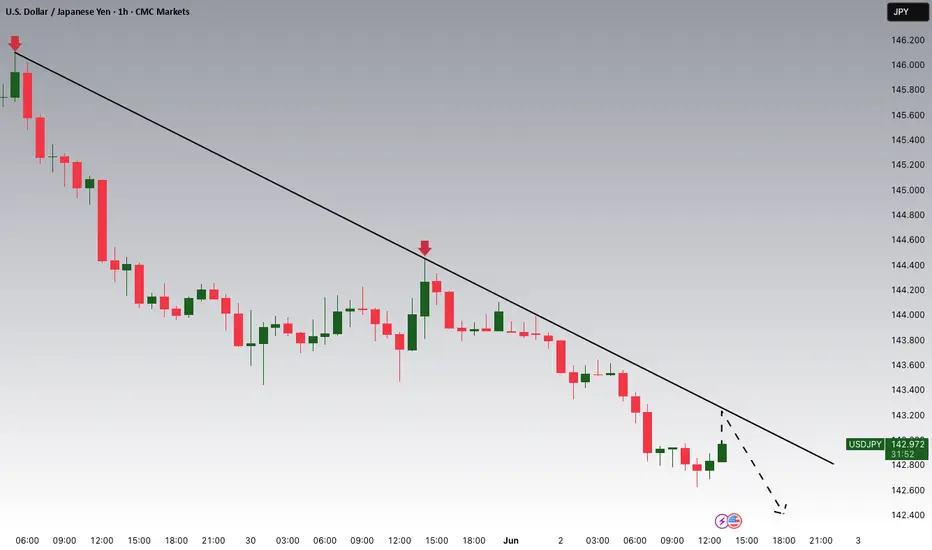
As shown on the USD/JPY chart, the pair is hovering near key support at ¥142.50 per US dollar.
While demand was strong enough at the end of May to lift the exchange rate from this level to a peak around ¥146.00, USD/JPY has once again retreated to the ¥142.50 area.
Why has USD/JPY declined?
On one hand, the US dollar has weakened following disappointing economic data released yesterday. The figures revealed a sharp slowdown in private sector hiring and an unexpected contraction in the US services sector, fuelling concerns over a possible recession.
On the other hand, yen strength is being driven by the Bank of Japan's apparent willingness to raise interest rates — reaffirmed on Tuesday by Governor Kazuo Ueda — which has reinforced expectations of a tightening cycle.
USD/JPY Technical Analysis
In early June, the ¥142.50 level had already shown its role as support (as indicated by the arrow), but it is once again under pressure — a sign of bearish dominance.
Yesterday, sellers broke through local support at ¥143.57, which may now act as resistance.
More US economic data is due on Friday, with key labour market figures set to be released at 15:30 GMT+3. These could potentially trigger a bearish attempt to break below the ¥142.50 level on the USD/JPY chart.
This article represents the opinion of the Companies operating under the FXOpen brand only. It is not to be construed as an offer, solicitation, or recommendation with respect to products and services provided by the Companies operating under the FXOpen brand, nor is it to be considered financial advice.
USDJPY
USDJPY Will Go Lower From Resistance! Sell!
Please, check our technical outlook for USDJPY.
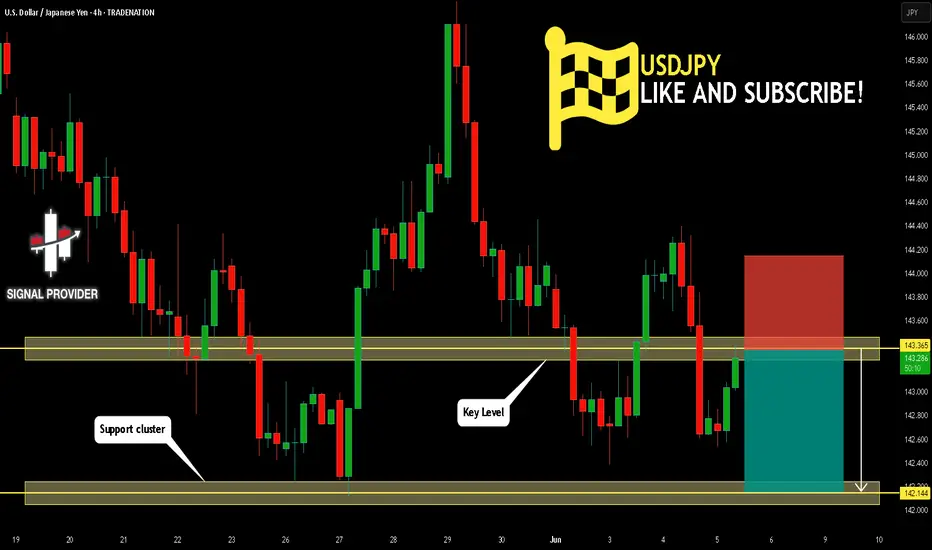
Time Frame: 4h
Current Trend: Bearish
Sentiment: Overbought (based on 7-period RSI)
Forecast: Bearish
The market is approaching a key horizontal level 143.365.
Considering the today's price action, probabilities will be high to see a movement to 142.144.
P.S
We determine oversold/overbought condition with RSI indicator.
When it drops below 30 - the market is considered to be oversold.
When it bounces above 70 - the market is considered to be overbought.
Disclosure: I am part of Trade Nation's Influencer program and receive a monthly fee for using their TradingView charts in my analysis.
Like and subscribe and comment my ideas if you enjoy them!
USD/JPY SELLERS WILL DOMINATE THE MARKET|SHORT
USD/JPY SIGNAL
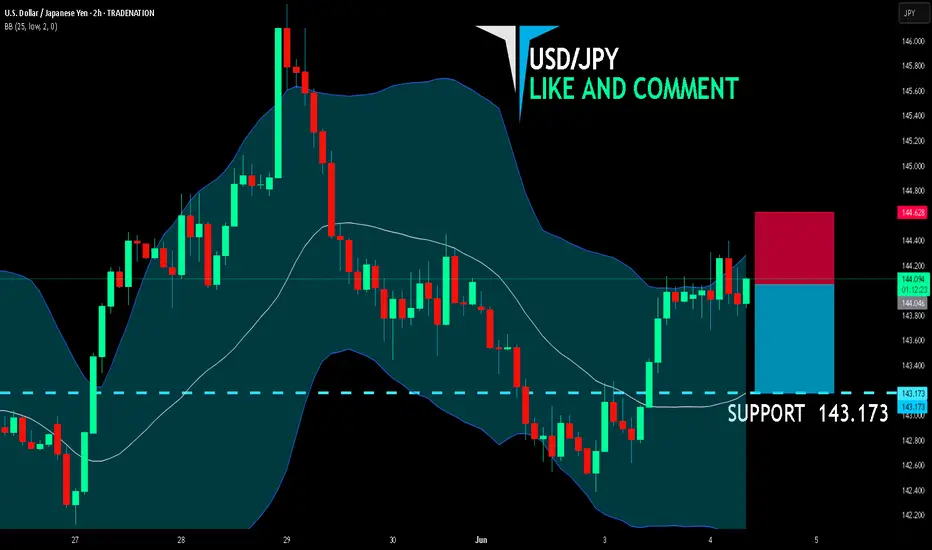
Trade Direction: short
Entry Level: 144.046
Target Level: 143.173
Stop Loss: 144.628
RISK PROFILE
Risk level: medium
Suggested risk: 1%
Timeframe: 2h
Disclosure: I am part of Trade Nation's Influencer program and receive a monthly fee for using their TradingView charts in my analysis.
✅LIKE AND COMMENT MY IDEAS✅
USD/JPY) breakout bearish trand analysis Read The captionSMC trading point update
Technical analysis of the USD/JPY (US Dollar / Japanese Yen) pair on a 2-hour timeframe. Here's the idea behind the analysis:
---
Overall Idea: Bearish Move Toward Support
---
Key Levels
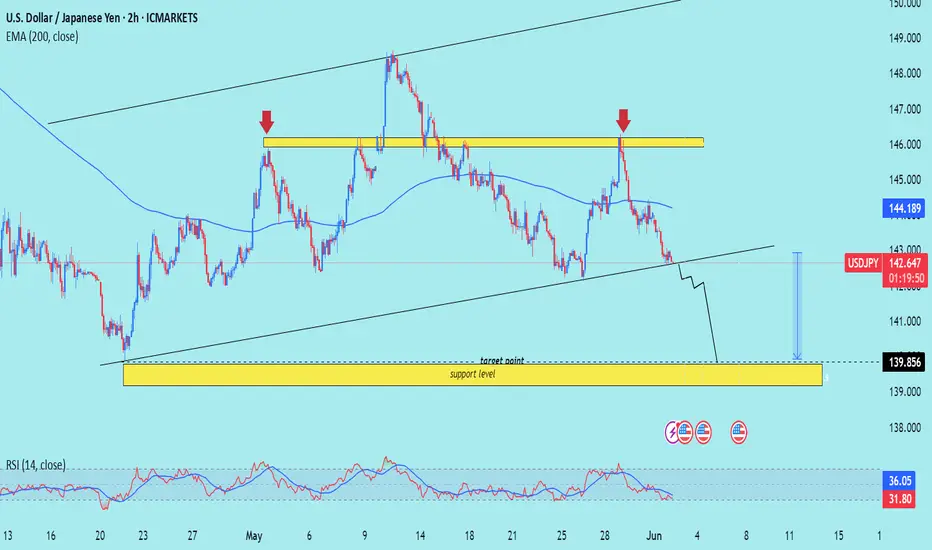
Resistance Zone (Yellow Box, Top): Marked with two red arrows — shows strong price rejection around 146.00–147.00 area.
Support Zone (Yellow Box, Bottom): Around 139.85, marked as a target point and support level.
These two zones form the range in which price has been reacting.
---
Current Price Action
Price is currently trading at 142.649, well below the 200 EMA (at 144.190), which is a bearish signal.
It has broken below the mid-range and seems to be heading toward the lower support zone (139.85).
---
Trend & Structure
The price is following a downward trend after rejecting from the resistance zone.
The channel suggests a further leg down is likely to complete a measured move.
A temporary retest of the broken trendline might occur before continuation down.
---
RSI (Relative Strength Index)
Currently around 31.83, nearing oversold territory, indicating the potential for:
A short-term bounce before further downside, or
A reversal near the key support zone.
---
Projection
The projection arrow (blue) suggests a bullish rebound from the 139.85 support zone.
This aligns with a potential buy opportunity once support is confirmed.
Mr SMC Trading point
---
Conclusion (Trade Idea Summary)
Short-Term Bias: Bearish
Medium-Term Setup: Look for a buy opportunity around 139.85, if price reacts well.
Key Steps:
1. Watch for price to reach 139.85.
2. Look for bullish reversal patterns or confirmations at that level (e.g., bullish engulfing, RSI divergence).
3. If confirmed, a potential long trade could target back toward the 144–145 zone.
Please Support boost this analysis )
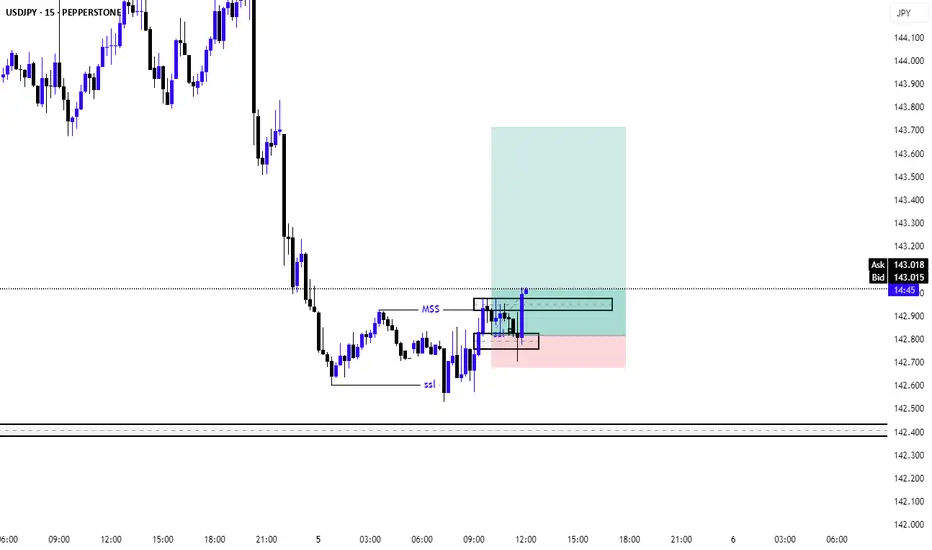
USDJPY buyPEPPERSTONE:USDJPY 15m chart liquidity grab & market structure shift. looking for buy with in intraday setup. idea valied untill asian season close. time zone base on malaysian time.
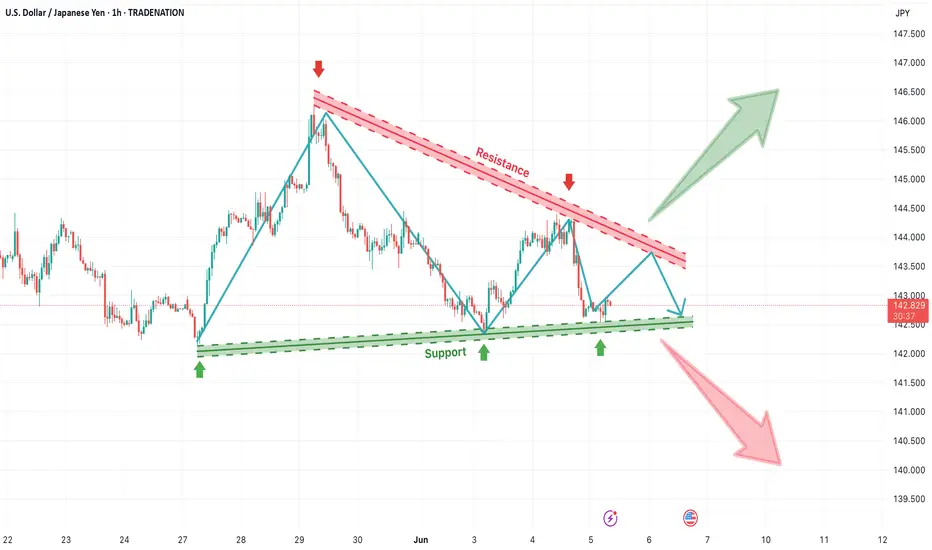
USD/JPY Triangle Squeeze – Watch for Breakout or BreakdownThe USD/JPY pair is currently trading within a symmetrical triangle pattern, with a descending resistance line (red) and a rising support line (green), clearly defining a consolidation phase. This type of price structure indicates growing indecision in the market, where buyers are stepping in at higher lows, while sellers are capping gains at lower highs. Such formations usually precede a strong breakout or breakdown move, as pressure builds up toward the apex of the triangle.
🔼 Bullish Breakout Scenario
If the price breaks above the descending resistance trendline, it will confirm a bullish breakout from the triangle. This would signal that buyers are regaining control and could trigger an impulsive rally toward the 145.50–146.50 area. The upside potential is supported by the structure of higher lows forming from May 27th onward, suggesting building bullish pressure. A successful breakout above 143.30–143.50, ideally with a retest and bullish candle confirmation, could offer a high-probability long setup with targets extending toward the previous swing highs.
🔽 Bearish Breakdown Scenario
On the flip side, if the price breaks below the rising support line, a bearish continuation could unfold, targeting levels as low as 140.00–139.50. This would indicate that sellers have overcome the ascending demand and could lead to a retest of prior support levels. A breakdown below 142.30 with strong bearish volume would be a key signal to short, especially if the market rejects further attempts to climb back into the triangle zone.
🧠 Strategy Outlook
This is a neutral setup until either side is broken. Traders should wait for confirmation of breakout or breakdown before entering. Once confirmed, a simple breakout trading strategy can be applied:
For longs: buy after breakout and retest above resistance
For shorts: sell after breakdown and retest below support
Stop losses can be placed just below the support for bullish trades and just above the resistance for bearish ones, ensuring clean invalidation levels.
=================================================================
Disclosure: I am part of Trade Nation's Influencer program and receive a monthly fee for using their TradingView charts in my analysis.
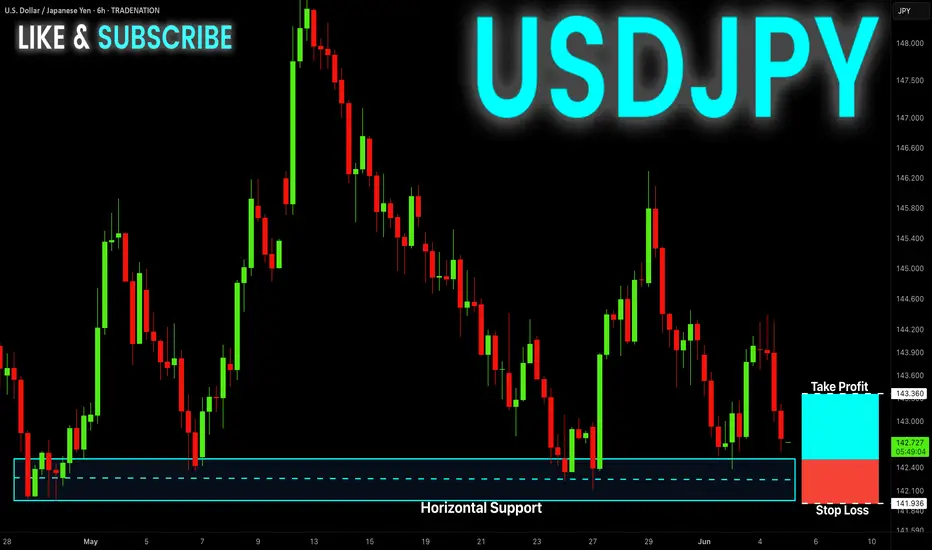
USD-JPY Free Signal! Buy!
Hello,Traders!
USD-JPY went down to
Retest a horizontal support
Level of 142.245 from where
A rebound is to be expected
So we can go long on the
Pair with the Take Profit
Of 143.360 and the Stop
Loss of 141.936
Buy!
Comment and subscribe to help us grow!
Check out other forecasts below too!
Disclosure: I am part of Trade Nation's Influencer program and receive a monthly fee for using their TradingView charts in my analysis.
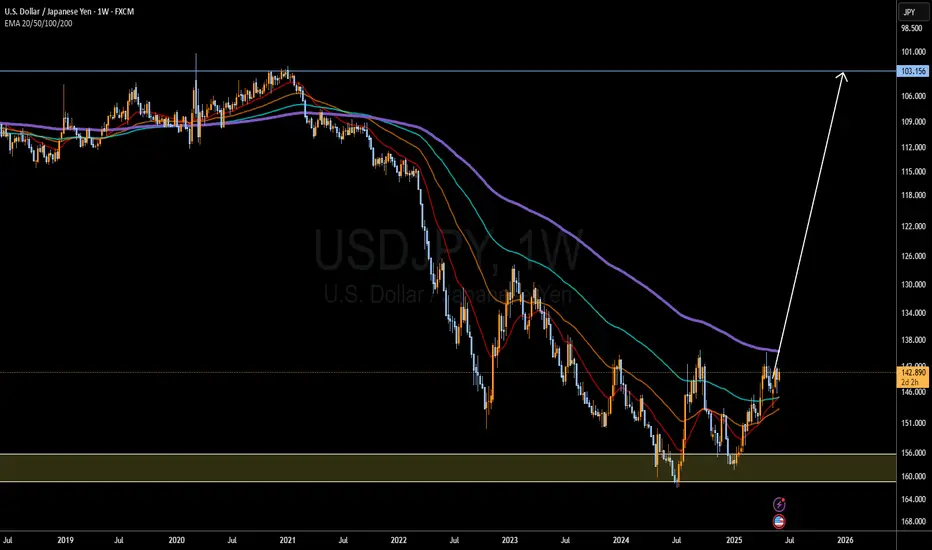
Japanese Yen to Da Moon!I compared the yen to every single currency pair and USDJPY is the most volatile. BOJ will raise interest rates to 0.75%-1% by late 2025/early 2026. And IF the FED chooses to lower rates that will further exacerbate Yen strength.
103.156 TP, but TBH I see price breaking well past that point and yen will make new all time highs. The dollar will get desecrated across all currencies, the yen will destroy it the hardest. Most likely BTC will also peak around this same time period and youll see and end to the bull cycle and we will enter BTC bear cycle but that is beside the point.
Potential Black Swan Event: the US enters into a recessionary environment, while I dont think this is likely bc everyone is saying that, it will be possible if we see a further escalation in the Ukraine conflict or if the US chooses to enter war with Iran. War is the only situation I see potential US recession.
I predicted then yen would get dusted during COVID, now I predict yen will make never seen before gains for the next 5 years minimum. Let's see how this plays out.
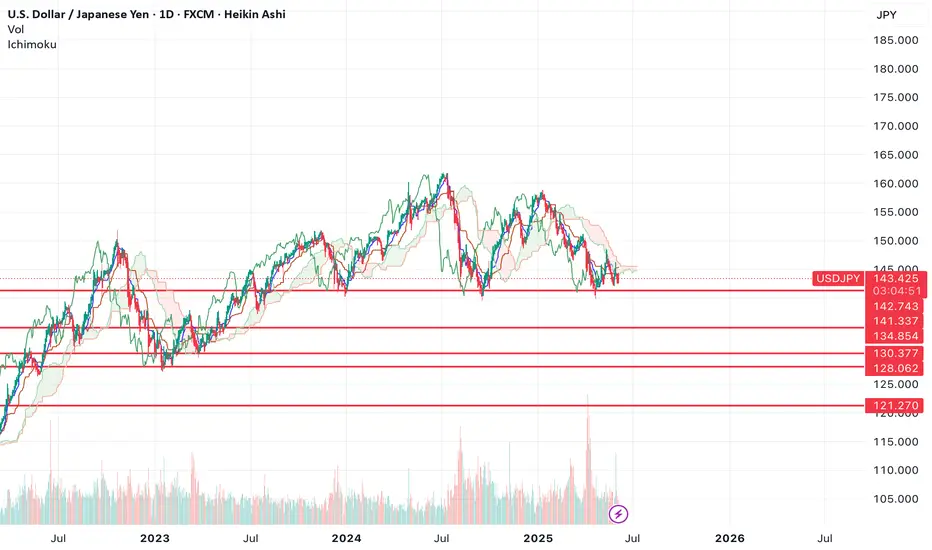
The Yen the cause of the next decline?The yen strengthening is what preceded the last market selloff and it looks like it could also be the cause of the next one.
If we look at the chart, it seems like we've now formed a massive top.
If USDJPY breaks through support at 141.33 that should be the initial trigger for a short. Below $139, under the wicks would be the safer play.
I could see the move going all the way down to the lower support levels.
Let's see how it plays out.
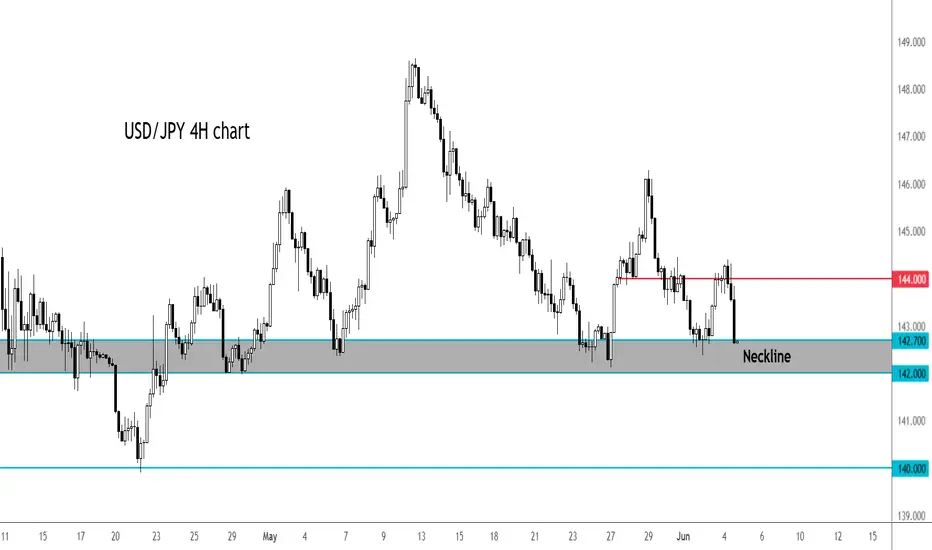
USD/JPY back at neckline as soft US data narrows yield spreadToday's soft US data releases weighed on US yields, which helped to further narrow the US-Japan spreads on the long dated bond yields. In turn, the USD/JPY gave up its entire gains from the day before when it was boosted by the JOLTS data. Next move could be defendant on the nonfarm payrolls report on Friday.
From a technical point of view, this is text book stuff. Price is testing a key area of support at the time of writing, between 142.00 to 142.70, as marked in grey on the chart. This zone has provided strong support on multiple occasions, preventing rates from sliding towards 140.00 zone. Now the more a level or an area is tested, the more likely it will break down. Will we see a break here in the next few days? Or will support continue to hold, as improving risk appetite gives US dollar some breathing space?
Well, the pair is down quite a lot on the session, so i wouldn't rule out a bounce here heading into US close. But the trend direction is clear: bearish.
By Fawad Razaqzada, market analyst with FOREX.com
USD_JPY RISKY LONG|
✅USD_JPY will soon retest a key support level of 142.000
So I think that the pair will make a rebound
And go up to retest the supply level above at 143.180
LONG🚀
✅Like and subscribe to never miss a new idea!✅
Disclosure: I am part of Trade Nation's Influencer program and receive a monthly fee for using their TradingView charts in my analysis.
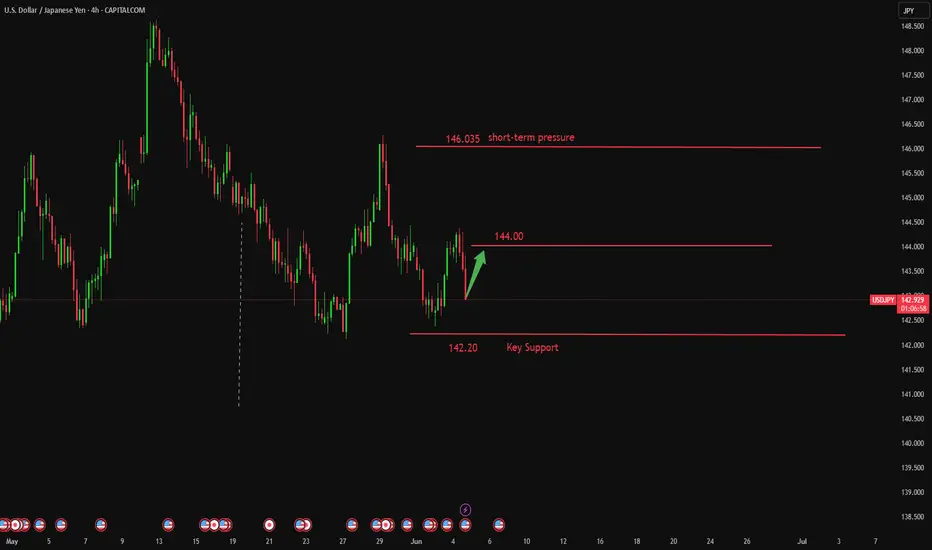
Is the 144 level becoming a key battleground for positioning?The USD/JPY exchange rate has staged a mild rebound for the second consecutive day, though it remained capped below the 144.00 level during the European session. Despite short-term signs of stabilization, the pair remains broadly pressured by a dual combination of fundamental expectations and technical resistance. Persistently constrained by selling pressure above 144.00 and failing to achieve a volume-supported breakout, the exchange rate is expected to continue trading within a range-bound consolidation between 142.00 and 144.80. Focus remains on the multi-empty battles in the 143.40 and 142.30 zones.
Humans need to breathe, and perfect trading is like breathing—maintaining flexibility without needing to trade every market swing. The secret to profitable trading lies in implementing simple rules: repeating simple tasks consistently and enforcing them strictly over the long term.
GOLD - WAVE 4 CORRECTION TO $2,800 (UPDATE)The 'resistance turned support' which I mentioned yesterday is holding up well. After the retest of the support zone, we're currently seeing bullish momentum keep Gold prices up.
As soon as Gold surpasses $3,400 & closes WITHIN the previous 0.365% zone, I will be sure that the 3 Sub-Wave (A,B,C) correction for sellers is over & buyers are now heading towards a new ATH. Until then I am still wary & being careful of sellers.

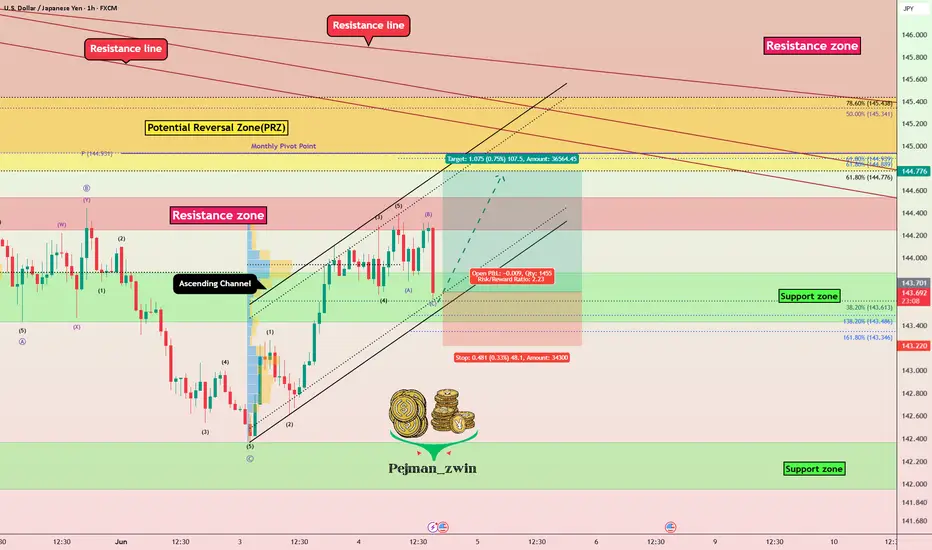
USDJPY Tests Channel Support After ADP Shock — Rebound Ahead?In the last hour's candle after the ADP Non-Farm Employment Change Index was released, USDJPY ( FX:USDJPY ) started to fall, but considering the position of this pair, I think we can have a good Risk-To-Reward even if the Stop Loss (SL) is touched.
USDJPY is trading near the lower line of the ascending channel and the Support zone(143.870 JPY-143.430 JPY) .
From an Elliott Wave perspective , USDJPY appears to be completing a corrective pattern .
I expect USDJPY to rise at least to the Potential Reversal Zone(PRZ) .
Note: Stop Loss = 143.220 JPY
Please respect each other's ideas and express them politely if you agree or disagree.
U.S. Dollar/Japanese Yen Analyze (USDJPY), 1-hour time frame.
Be sure to follow the updated ideas.
Do not forget to put a Stop loss for your positions (For every position you want to open).
Please follow your strategy and updates; this is just my Idea, and I will gladly see your ideas in this post.
Please do not forget the ✅' like '✅ button 🙏😊 & Share it with your friends; thanks, and Trade safe.
AUDCHF BULLISH OR BEARISH DETAILED ANALYSISAUDCHF is currently breaking out of a textbook falling wedge pattern on the 4H chart, signaling a potential shift in momentum from bearish to bullish. Price action has been consolidating within this structure for several weeks, creating lower highs and lower lows, but with clear bullish divergence beginning to show up in recent sessions. The breakout around the 0.53300 zone marks a significant technical confirmation that bulls are taking control, with eyes now on the 0.54400 target.
From a fundamental standpoint, the Australian dollar is gaining strength backed by hawkish sentiment from the RBA. Despite global uncertainties, the RBA’s firm stance on managing inflation is keeping the Aussie resilient. On the flip side, the Swiss franc has been showing signs of relative weakness due to softer inflation readings and safe-haven outflows as global risk sentiment improves. This macro backdrop is creating favorable conditions for AUDCHF to rally.
Technically, this breakout aligns with strong market structure and volume support, making this a high-conviction bullish setup. The breakout candle is closing above resistance with momentum, and as long as price holds above the 0.53250–0.53000 zone, bulls are likely to maintain control. With the falling wedge breakout and favorable risk-reward setup, the upside move toward 0.54400 looks increasingly probable.
This is a clean price action play with fundamental alignment. The breakout not only confirms the end of the previous downtrend, but also opens up space for a bullish wave to unfold. Momentum traders and swing traders will want to watch this closely as AUDCHF transitions from accumulation to a potential bullish expansion phase.

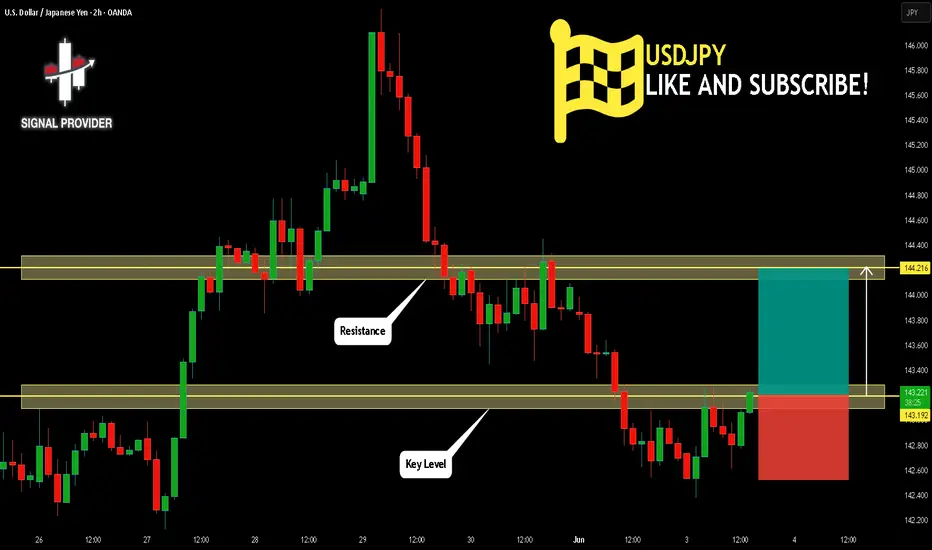
USDJPY Will Go Higher From Support! Buy!
Take a look at our analysis for USDJPY.
Time Frame: 2h
Current Trend: Bullish
Sentiment: Oversold (based on 7-period RSI)
Forecast: Bullish
The market is on a crucial zone of demand 143.192.
The oversold market condition in a combination with key structure gives us a relatively strong bullish signal with goal 144.216 level.
P.S
We determine oversold/overbought condition with RSI indicator.
When it drops below 30 - the market is considered to be oversold.
When it bounces above 70 - the market is considered to be overbought.
Disclosure: I am part of Trade Nation's Influencer program and receive a monthly fee for using their TradingView charts in my analysis.
Like and subscribe and comment my ideas if you enjoy them!
USDJPY M15 Support & Resistance Levels🚀 Here are some key zones I've identified on the 15m timeframe.
These zones are based on real-time data analysis performed by a custom software I personally developed.
The tool is designed to scan the market continuously and highlight potential areas of interest based on price action behavior and volume dynamics.
Your feedback is welcome!

Fundamental Market Analysis for June 4, 2025 USDJPYEvents to pay attention today:
17:00 EET. USD - ISM Services Business Activity Index
15:15 EET. USD - ADP Employment Change
USDJPY:
The Japanese yen (JPY) is attracting some intraday buyers after falling against the US dollar during the Asian session, and, at least for now, it seems that its pullback from the weekly high reached yesterday has paused. An upward revision of Japan's services business activity index, as well as expectations that wage growth will lead to faster inflation, leave open the possibility of another interest rate hike by the Bank of Japan (BoJ) in 2025. In addition, ongoing geopolitical risks and trade uncertainty are key factors supporting the JPY.
Meanwhile, cautious statements by BoJ Governor Kazuo Ueda on Tuesday sparked speculation that the next interest rate hike will not happen anytime soon. However, this still differs significantly from expectations that the Federal Reserve (Fed) will cut rates by at least 25 basis points (bps) by the end of this year. This, along with concerns about the US budget, is causing a new wave of selling of the US dollar (USD) after Tuesday's decent rebound from a six-week low and is putting some pressure on the USD/JPY pair during the Asian session.
Trading recommendation: SELL 144.20, SL 144.40, TP 143.20
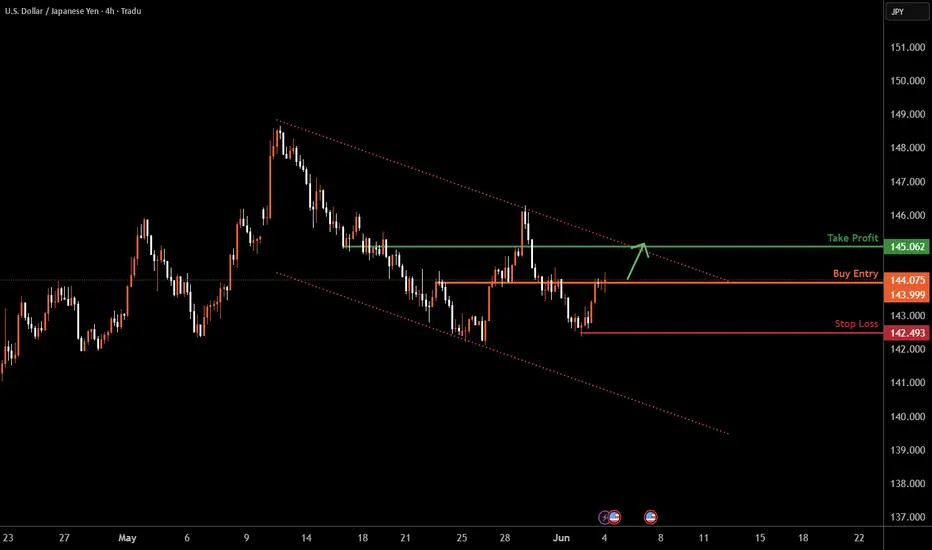
USDJPY H4 I Bullish Bounce Off Based on the H4 chart analysis, the price is trading near our buy entry level at 143.99, a pullback support
Our take profit is set at 145.06, a pullback resistance.
The stop loss is placed at 142.49, a swing low support.
High Risk Investment Warning
Trading Forex/CFDs on margin carries a high level of risk and may not be suitable for all investors. Leverage can work against you.
Stratos Markets Limited (tradu.com ):
CFDs are complex instruments and come with a high risk of losing money rapidly due to leverage. 63% of retail investor accounts lose money when trading CFDs with this provider. You should consider whether you understand how CFDs work and whether you can afford to take the high risk of losing your money.
Stratos Europe Ltd (tradu.com ):
CFDs are complex instruments and come with a high risk of losing money rapidly due to leverage. 63% of retail investor accounts lose money when trading CFDs with this provider. You should consider whether you understand how CFDs work and whether you can afford to take the high risk of losing your money.
Stratos Global LLC (tradu.com ):
Losses can exceed deposits.
Please be advised that the information presented on TradingView is provided to Tradu (‘Company’, ‘we’) by a third-party provider (‘TFA Global Pte Ltd’). Please be reminded that you are solely responsible for the trading decisions on your account. There is a very high degree of risk involved in trading. Any information and/or content is intended entirely for research, educational and informational purposes only and does not constitute investment or consultation advice or investment strategy. The information is not tailored to the investment needs of any specific person and therefore does not involve a consideration of any of the investment objectives, financial situation or needs of any viewer that may receive it. Kindly also note that past performance is not a reliable indicator of future results. Actual results may differ materially from those anticipated in forward-looking or past performance statements. We assume no liability as to the accuracy or completeness of any of the information and/or content provided herein and the Company cannot be held responsible for any omission, mistake nor for any loss or damage including without limitation to any loss of profit which may arise from reliance on any information supplied by TFA Global Pte Ltd.
The speaker(s) is neither an employee, agent nor representative of Tradu and is therefore acting independently. The opinions given are their own, constitute general market commentary, and do not constitute the opinion or advice of Tradu or any form of personal or investment advice. Tradu neither endorses nor guarantees offerings of third-party speakers, nor is Tradu responsible for the content, veracity or opinions of third-party speakers, presenters or participants.
USDJPY Sell tradeSell opportunity on USDJPY
Entry: 144.000
Stoploss: 144.100
Take Profit: 142:150
Comment your opinion pls.
Follow me on X @shajudeakinoba1 for update and Account management

usdjpy 1 hour BUYPEPPERSTONE:USDJPY As we can see on 1 hour chart price came to another level. And after some consolidation price rejected from level. I'm looking for sell from this level and probably price push down.

USDJPY Potential DownsidesHey Traders, in today's trading session we are monitoring USDJPY for a selling opportunity around 143.200 zone, USDJPY is trading in a downtrend and currently is in a correction phase in which it is approaching the trend at 143.200 support and resistance area.
Trade safe, Joe.
XAU/USD Weekly Forecast : First LONG, then SHORT! (READ CAPTION)By examining the gold chart on the 4-hour timeframe, we can see that after dropping to $3270, the price faced strong buying pressure and opened today’s session with a 100-pip gap at $3298, continuing its rally up to $3370. This bullish move could potentially extend toward $3400, but keep in mind that gold is likely to retrace soon to fill this price gap — so this scenario should definitely be considered!
