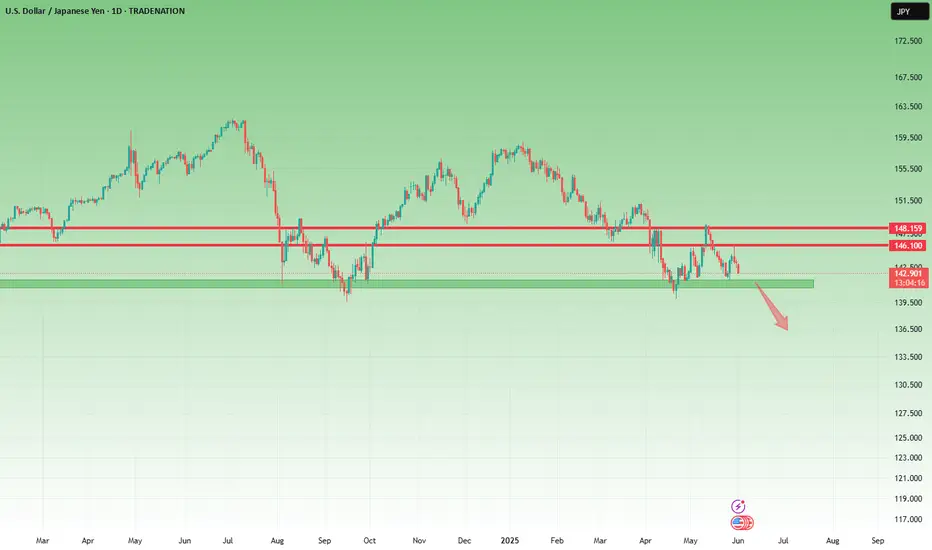
UsdJpy could break 142 and fall 500 pipsSince early May, I’ve been highlighting the 142 support zone on USDJPY as a potential reversal area — with a suggested upside target at 146.
The market respected this level twice, reversing from 142 and rallying past 146 both times.
However, last week’s move into 146 was sharply rejected, forming a strong daily Pin Bar exactly at resistance — a classic sign of exhaustion.
Now, price is rolling back toward support, and after multiple tests of the 142 zone, we may be very close to a downside break.
🧩 Add to this the fact that DXY also looks ready to break lower, and the probability of a USDJPY fall increases even more.
📉 Trading Plan:
Sell rallies, with invalidation above 146, and a target at 137, aiming for a 1:2 risk-reward setup.
Disclosure: I am part of TradeNation's Influencer program and receive a monthly fee for using their TradingView charts in my analyses and educational articles.
USDJPY
Prices are testing the 142.55 support level.Bank of Japan (BOJ) Governor Kazuo Ueda stated on Tuesday that the central bank would raise interest rates if the economy re-accelerates, adding that wage growth must regain momentum. Currently, Trump's tariff policies have dimmed the economic outlook, making it potentially not the optimal time for a rate hike. However, policymakers stand ready to raise rates if the economy rebounds after a brief pullback. The remarks bolstered the Japanese yen, with prices now testing the 142.55 support level. A decisive break below this level would form a lower low, confirming the continuation of the downtrend and shifting bearish targets toward the 140.01 support level.
Humans need to breathe, and perfect trading is like breathing—maintaining flexibility without needing to trade every market swing. The secret to profitable trading lies in implementing simple rules: repeating simple tasks consistently and enforcing them strictly over the long term.
Trading Strategy:
sell@144.50-145.00
TP:143.00-142.50
USD/JPY M15 Support & Resistance Levels🚀 Here are some key zones I've identified on the 15m timeframe.
These zones are based on real-time data analysis performed by a custom software I personally developed.
The tool is designed to scan the market continuously and highlight potential areas of interest based on price action behavior and volume dynamics.
Your feedback is welcome!

USDJPY Analysis todayHello traders, this is a complete multiple timeframe analysis of this pair. We see could find significant trading opportunities as per analysis upon price action confirmation we may take this trade. Smash the like button if you find value in this analysis and drop a comment if you have any questions or let me know which pair to cover in my next analysis.

Bearish reversal off 50% Fibonacci resistance?USD/JPY is rising towards the pivot, which aligns with the 50% Fibonacci retracement and could reverse to the 1st support, a pullback level.
Pivot: 144.37
1st Support: 141.94
1st Resistance: 146.17
Risk Warning:
Trading Forex and CFDs carries a high level of risk to your capital and you should only trade with money you can afford to lose. Trading Forex and CFDs may not be suitable for all investors, so please ensure that you fully understand the risks involved and seek independent advice if necessary.
Disclaimer:
The above opinions given constitute general market commentary, and do not constitute the opinion or advice of IC Markets or any form of personal or investment advice.
Any opinions, news, research, analyses, prices, other information, or links to third-party sites contained on this website are provided on an "as-is" basis, are intended only to be informative, is not an advice nor a recommendation, nor research, or a record of our trading prices, or an offer of, or solicitation for a transaction in any financial instrument and thus should not be treated as such. The information provided does not involve any specific investment objectives, financial situation and needs of any specific person who may receive it. Please be aware, that past performance is not a reliable indicator of future performance and/or results. Past Performance or Forward-looking scenarios based upon the reasonable beliefs of the third-party provider are not a guarantee of future performance. Actual results may differ materially from those anticipated in forward-looking or past performance statements. IC Markets makes no representation or warranty and assumes no liability as to the accuracy or completeness of the information provided, nor any loss arising from any investment based on a recommendation, forecast or any information supplied by any third-party.

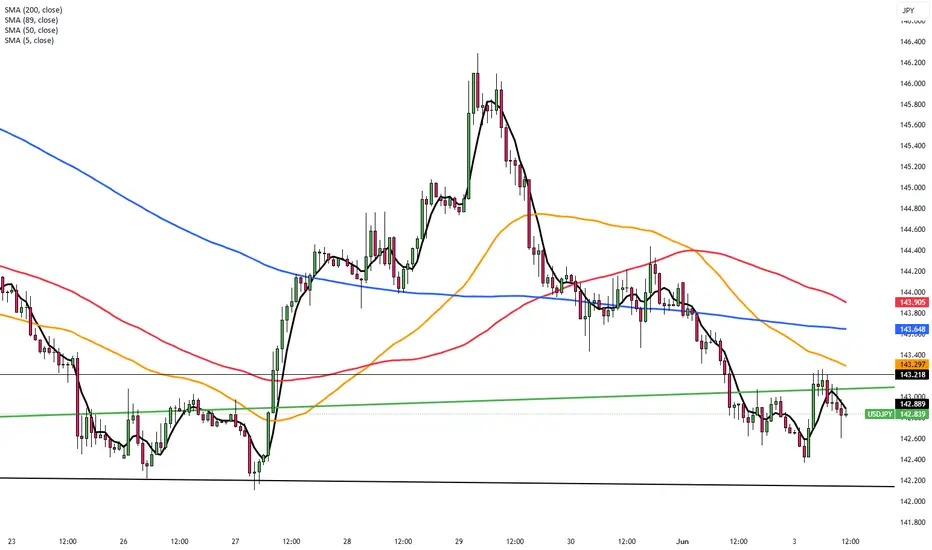
Yen Rises Amid Trump Tariff Threat and China DisputeThe Japanese yen rose to around 143.5 per dollar on Monday, marking its third straight session of gains as rising global trade tensions lifted demand for safe-haven currencies. The move followed President Trump’s threat on Friday to double tariffs on steel and aluminum imports to 50% starting June 4. Japanese steelmakers like JFE Holdings and Kobe Steel fell, while Nippon Steel was less affected after Trump praised its planned merger with U.S. Steel. Meanwhile, U.S.-China tensions grew as China denied Trump’s claim of breaching a recent Geneva trade agreement. On the domestic front, Japan’s Q1 capital spending beat expectations, with investment rising across both manufacturing and services, reflecting solid internal momentum.
The key resistance is at $143.50 meanwhile the major support is located at $143.00.
USDJPY Bearish Signal | Technical + Custom AlgoSmart Trend Signal | Technical Analysis + Custom Algorithm
This signal is the result of a combination of classic technical trend analysis and a proprietary software I personally developed.

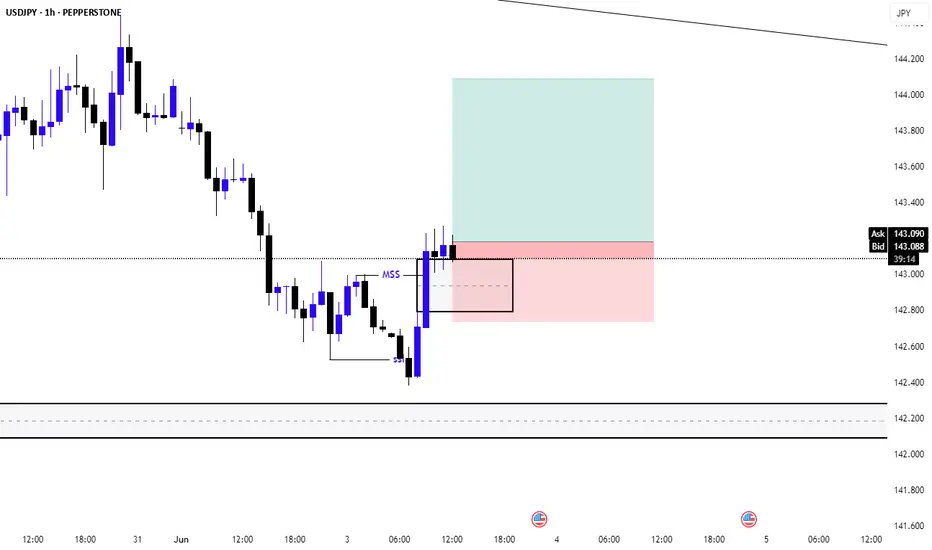
usdjpy 1H-buyPEPPERSTONE:USDJPY 1hour chart currently I'm in buy position. reason behind it 4 hour chart price currently sitting on key support level and I can see some upside price rejection ( previous demand zone) In 1 hour chart I can see price garbed some liquidity & price pushed up to create some kind of market structure shift.
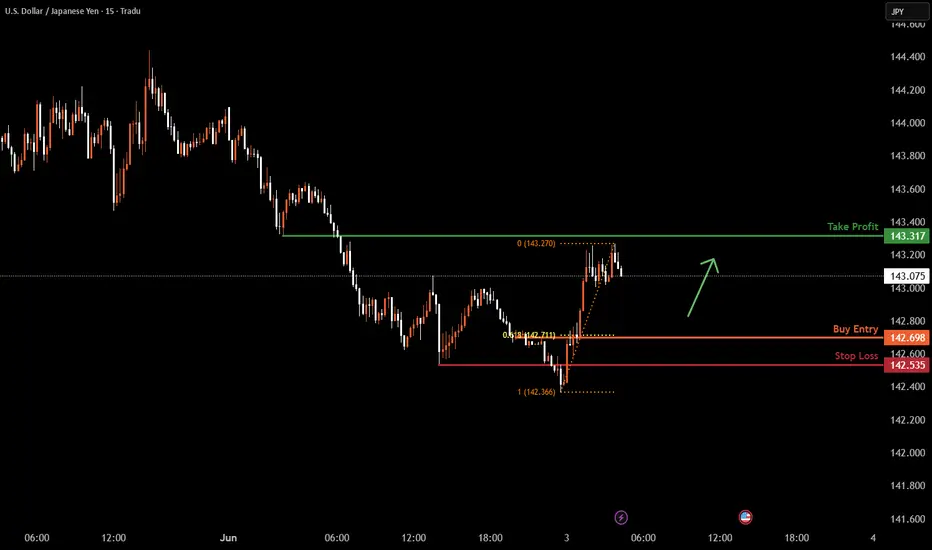
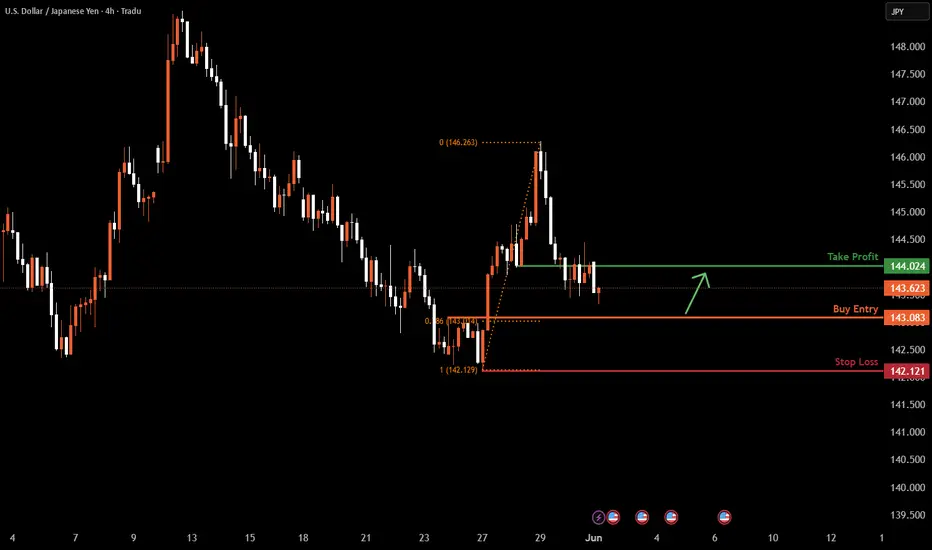
USDJPY M15 I Bullish Bounce Based on the M15 chart analysis, the price is falling toward our buy entry level at 142.69, a pullback support that aligns with the 61.8% Fibonacci retracement.
Our take profit is set at 143.31, a pullback resistance.
The stop loss is placed at 142.53, a pullback support.
High Risk Investment Warning
Trading Forex/CFDs on margin carries a high level of risk and may not be suitable for all investors. Leverage can work against you.
Stratos Markets Limited (tradu.com ):
CFDs are complex instruments and come with a high risk of losing money rapidly due to leverage. 63% of retail investor accounts lose money when trading CFDs with this provider. You should consider whether you understand how CFDs work and whether you can afford to take the high risk of losing your money.
Stratos Europe Ltd (tradu.com ):
CFDs are complex instruments and come with a high risk of losing money rapidly due to leverage. 63% of retail investor accounts lose money when trading CFDs with this provider. You should consider whether you understand how CFDs work and whether you can afford to take the high risk of losing your money.
Stratos Global LLC (tradu.com ):
Losses can exceed deposits.
Please be advised that the information presented on TradingView is provided to Tradu (‘Company’, ‘we’) by a third-party provider (‘TFA Global Pte Ltd’). Please be reminded that you are solely responsible for the trading decisions on your account. There is a very high degree of risk involved in trading. Any information and/or content is intended entirely for research, educational and informational purposes only and does not constitute investment or consultation advice or investment strategy. The information is not tailored to the investment needs of any specific person and therefore does not involve a consideration of any of the investment objectives, financial situation or needs of any viewer that may receive it. Kindly also note that past performance is not a reliable indicator of future results. Actual results may differ materially from those anticipated in forward-looking or past performance statements. We assume no liability as to the accuracy or completeness of any of the information and/or content provided herein and the Company cannot be held responsible for any omission, mistake nor for any loss or damage including without limitation to any loss of profit which may arise from reliance on any information supplied by TFA Global Pte Ltd.
The speaker(s) is neither an employee, agent nor representative of Tradu and is therefore acting independently. The opinions given are their own, constitute general market commentary, and do not constitute the opinion or advice of Tradu or any form of personal or investment advice. Tradu neither endorses nor guarantees offerings of third-party speakers, nor is Tradu responsible for the content, veracity or opinions of third-party speakers, presenters or participants.
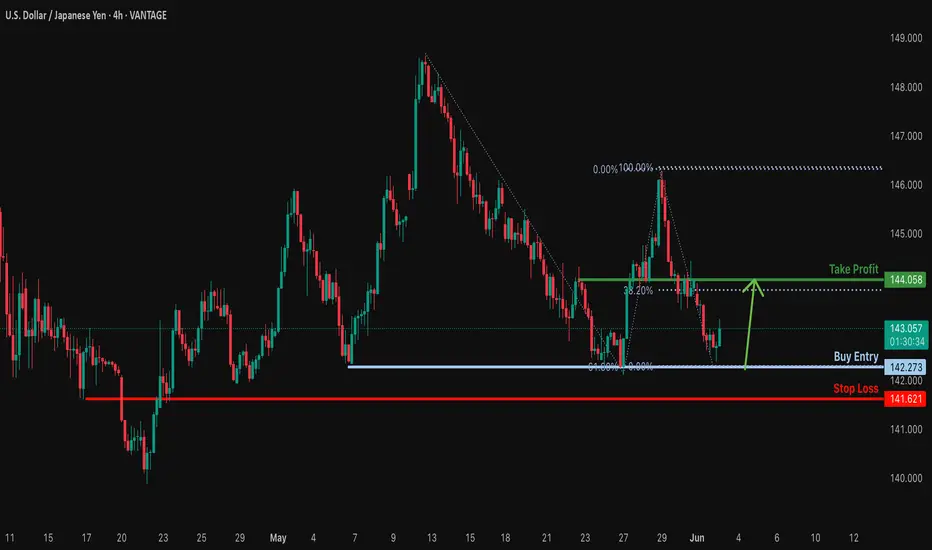
Bullish bounce off pullback support?USD/JPY has bounced off the support level which is a pullback support that lines up with the 61.8% Fibonacci projection and could rise from this level to our take profit.
Entry: 142.27
Why we like it:
There is a pullback support level that lines up with the 61.8% Fibonacci projection.
Stop loss: 141.62
Why we like it:
There is a pullback support level.
Take profit: 144.05
Why we like it:
There is a pullback resistance that lines up with the 38.25 fibonacci retracement.
Enjoying your TradingView experience? Review us!
Please be advised that the information presented on TradingView is provided to Vantage (‘Vantage Global Limited’, ‘we’) by a third-party provider (‘Everest Fortune Group’). Please be reminded that you are solely responsible for the trading decisions on your account. There is a very high degree of risk involved in trading. Any information and/or content is intended entirely for research, educational and informational purposes only and does not constitute investment or consultation advice or investment strategy. The information is not tailored to the investment needs of any specific person and therefore does not involve a consideration of any of the investment objectives, financial situation or needs of any viewer that may receive it. Kindly also note that past performance is not a reliable indicator of future results. Actual results may differ materially from those anticipated in forward-looking or past performance statements. We assume no liability as to the accuracy or completeness of any of the information and/or content provided herein and the Company cannot be held responsible for any omission, mistake nor for any loss or damage including without limitation to any loss of profit which may arise from reliance on any information supplied by Everest Fortune Group.
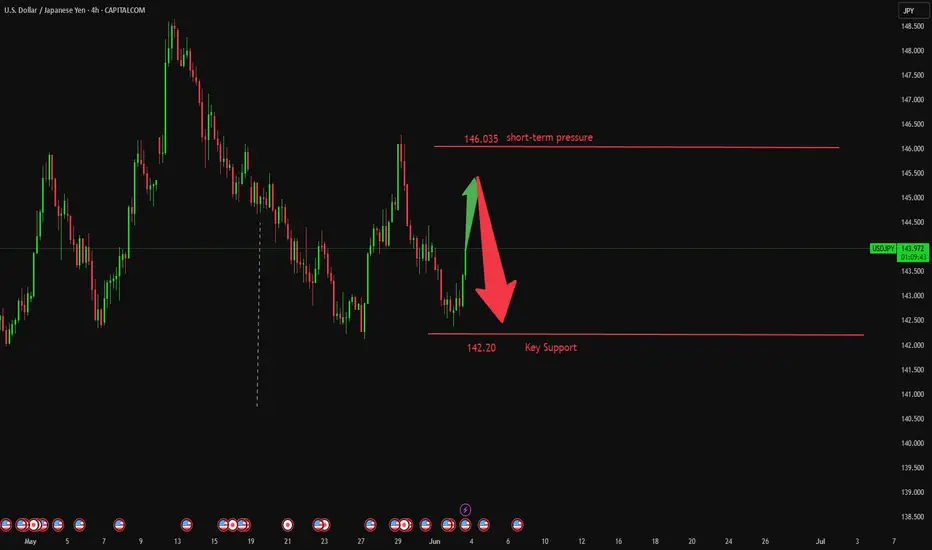
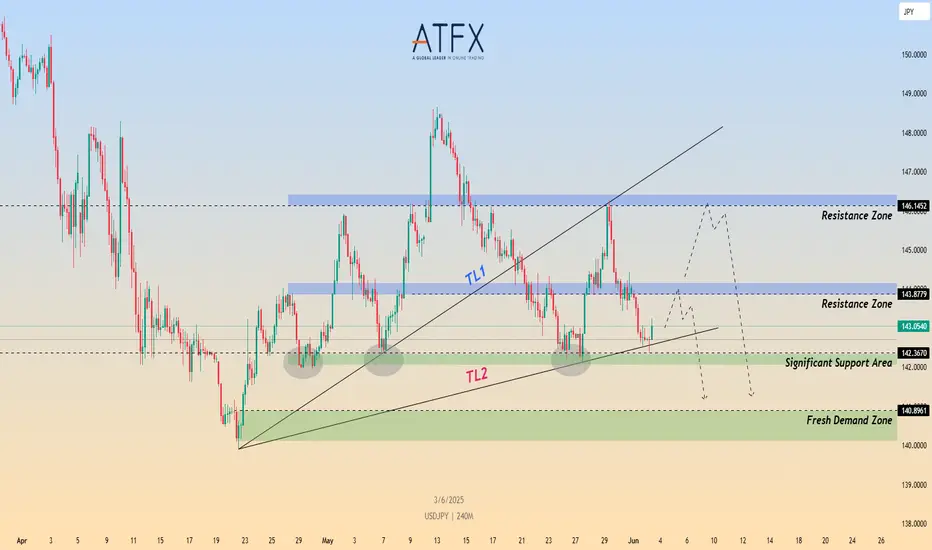
Risk, Rates, and Reversals: What’s Next for USD/JPY?CMCMARKETS:USDJPY FX:USDJPY USD/JPY rebounded slightly to 143.10 but remains under pressure after slipping from the 144.50 on BoJ-Fed divergence and rising geopolitical tensions. While the BoJ appears cautious about accelerating its balance sheet tapering beyond FY2026, it still signals further rate hikes amid persistent domestic inflation, offering the yen structural support.
Technically, price is reacting off the lower trendline TL2, aligned with the 142.30–142.40 significant support zone. This area has held multiple times in the past and may offer a bullish pullback toward the 143.80 or even 146.15 resistance zones. However, failure to break above these levels could expose USD/JPY to renewed downside toward the 140.89 demand base.
Short-term recovery depends on Friday’s NFP and risk sentiment around trade tensions. A break below 142.30 would invalidate the bullish rebound and open downside to support near 140.89.
Resistance : 143.87 , 146.14
Support : 142.36 , 140.89
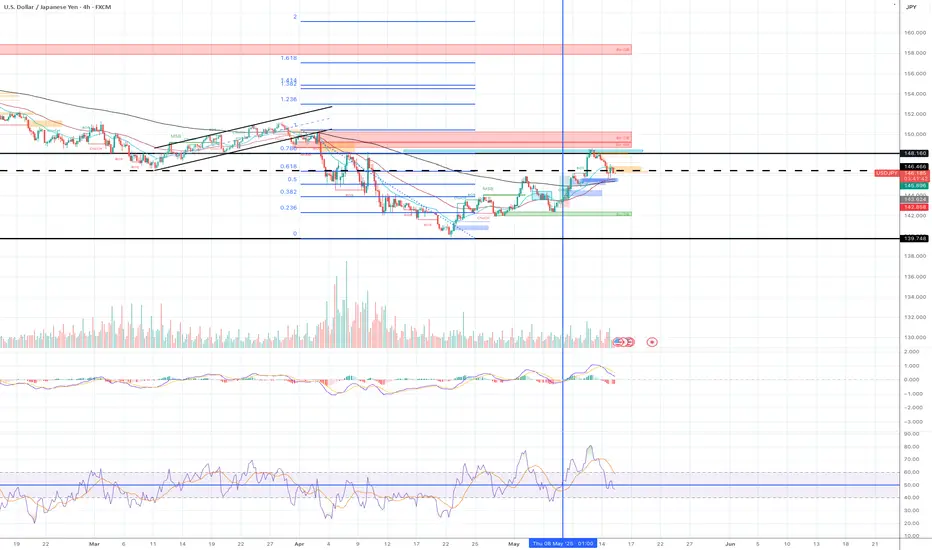
Short I opened a short position yesterday at the price of 147.50.
Currently the price is 146.18. The price has dropped quite a bit but I think it still has a good short entry opportunity with a reasonable risk reward.
Reasons for short trade:
The price has reached the major support level around 149 on the 22nd April. Since then, the price has moved up to the fair value gap area between 149.2 and 148.2 (blue rectangular box), and also the order block.
That area is also the Fib 0786 area. I look at Fib 0.786 as the last line of defence and it is usually a hard line to break.
The price hit the area and started to move to the downside. Momentum indicators are still in the bull territory but the lines have crossed and clearly moving to the downside.
My macro bias for USD is bearish and the current price set up support my bias. The risk reward is good enough for me to enter.
My trade set up:
Entry: 147.51Stop: 148.95Target: 142.478 (Fib 0.236)
Risk:Reward= 1:3.5
Currently the price is 146.17. It just broked below Fib 0.618. Entry now can give you 1:1.5 risk reward.
USDJPY I Trading Plan and Forecast Welcome back! Let me know your thoughts in the comments!
** USDJPY Analysis - Listen to video!
We recommend that you keep this pair on your watchlist and enter when the entry criteria of your strategy is met.
Please support this idea with a LIKE and COMMENT if you find it useful and Click "Follow" on our profile if you'd like these trade ideas delivered straight to your email in the future.
Thanks for your continued support!Welcome back! Let me know your thoughts in the comments!

A rebound is inevitable. Execute!During the European session, the USD/JPY price trended lower overall, with prices gradually declining from higher levels, indicating that bearish forces remained dominant. The pair started its downward movement from near 144.049 and continued to move lower. Notably, the USD/JPY exchange rate faced resistance at the 146.00 psychological level and is currently moving toward the support zone at 142.35. If prices reach this area, buyers are expected to enter the market after setting clear risk parameters below the support level, preparing for a potential rebound toward the 148.00 resistance level. On the flip side, sellers will look for prices to break below this level to increase bearish bets, with a further downside target set at the 140.00 threshold.
Humans need to breathe, and perfect trading is like breathing—maintaining flexibility without needing to trade every market swing. The secret to profitable trading lies in implementing simple rules: repeating simple tasks consistently and enforcing them strictly over the long term.
Trading Strategy:
buy@142.20-142.50
TP:145.50-146.00

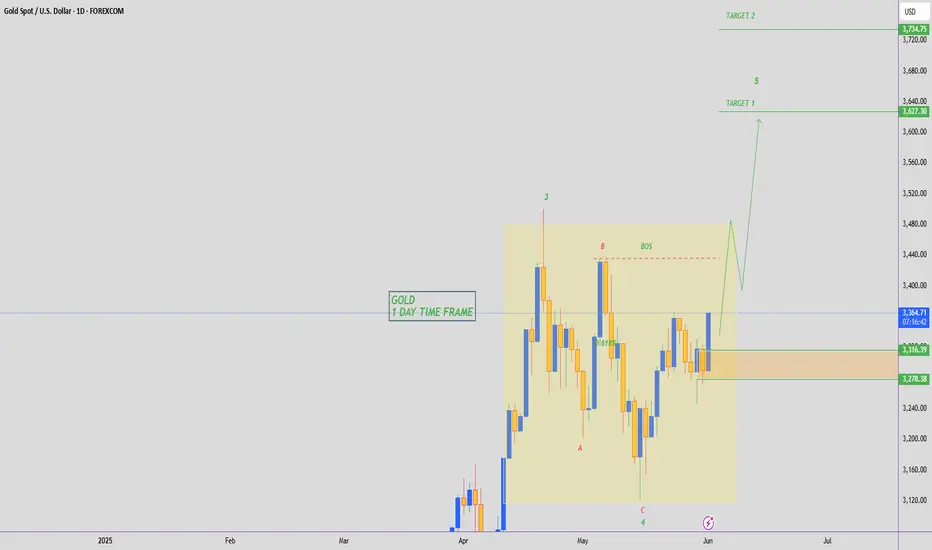
GOLD BULLISH TO $3,620 - $3,730Here's a breakdown video of how I used my EW strategy to identify the next bullish target for Gold towards a new ATH.
⭕️Wave 3 Peaked at $3,500.
⭕️Simple 3 Sub-Wave (A,B,C) Correction Complete for Wave 4.
⭕️Strong Support Zone at Wave 4 Low of $3,122.
⭕️Fibonacci Retracement Used to Target Wave 5 Target.
USDJPY Forecast for NFP Week | Price at a Critical Turning PointIn this video, I’m diving into the USDJPY setup ahead of a high-impact week filled with major economic news like the NFP, ADP Employment, and speeches from the BoJ Governor.
We’ll walk through the technical zones I’m watching, discuss potential buyer and seller reactions, and outline the key catalysts that could move the market.
🔔 Don’t forget to like the video in support of my work.
Disclaimer:
Based on experience and what I see on the charts, this is my take. It’s not financial advice—always do your research and consult a licensed advisor before trading.
#USDJPY #ForexForecast #NFPWeek #ForexMentor #TechnicalAnalysis #ForexTrading #BoJ #TradeSetups #PriceAction #MarketBreakdown

USDJPY Ready to Bounce – Sniper Long from Smart Money OBUSDJPY | 30-Min Bullish Setup – Premium to Discount + Order Block Reaction
USDJPY looks primed for a bullish reversal from a smart money perspective. Let’s walk through why this setup could be the cleanest long of the week 📈🧠
📌 1. Current Market Narrative:
Price retraced deep into discount levels (beyond 70.5%) after a strong bullish leg
Tapped into a refined bullish Order Block (OB) sitting just above a strong low
Multiple liquidity grabs have already occurred, leaving internal structure vulnerable to a reversal
Smart money has likely accumulated below recent lows… ready to pump toward Buy Side Liquidity 🧲
🧠 2. Key Technical Levels:
✅ Order Block Zone (Entry): 143.164
🔻 Strong Low: 142.048 (protected)
🟢 Buy Side Liquidity Target: 144.447
🔼 Weak High (Magnet): 146.290
Entry Point: Within OB (143.1–143.2)
TP Zones: 144.447 (main), 146.290 (stretch target)
SL: Below OB – around 142.048
RR: ~1:4+ — sniper grade 🥷
📊 3. Smart Money Flow:
OB aligned with 70.5–79% Fibonacci discount zone (deep retrace = strong reaction)
Structure shows signs of exhaustion on the sell side
Price may now reverse with displacement toward upside inefficiencies
Buyers likely stepping in aggressively from this level
🚀 4. Execution Plan (LTF Confirmation Entry):
✅ Wait for:
M5–M15 BOS (bullish break of structure)
FVG or mitigation entry confirmation
Maintain tight SL below OB (2–3 pips buffer)
Bonus: If price holds above 143.2 with strong M5 bullish candle close, that’s go-time for smart money longs.
🧨 5. Why This Setup is 🔥:
High probability bounce zone (OB + deep fib retrace)
Clean RR structure with solid target at buy side liquidity
Market structure shift likely as lower highs start breaking
Liquidity swept under recent lows = trap complete
This is the kind of setup that institutional algos are coded to exploit 🤖
💬 Type “USDJPY Long Sniper 🥷💴” in the comments if you’re in this setup too
🔁 Save this for trade journaling or future backtest
📊 Follow @ChartNinjas88 for smart money plays every day!

USDJPY H4 I Bullish Bounce Based on the H4 chart analysis, the price is approaching our buy entry level at 143.08, a pullback support that aligns closely with the 78.6% Fibonacci retracement.
Our take profit is set at 144.02, an overlap resistance.
The stop loss is placed at 142.12, a swing low support.
High Risk Investment Warning
Trading Forex/CFDs on margin carries a high level of risk and may not be suitable for all investors. Leverage can work against you.
Stratos Markets Limited (tradu.com ):
CFDs are complex instruments and come with a high risk of losing money rapidly due to leverage. 63% of retail investor accounts lose money when trading CFDs with this provider. You should consider whether you understand how CFDs work and whether you can afford to take the high risk of losing your money.
Stratos Europe Ltd (tradu.com ):
CFDs are complex instruments and come with a high risk of losing money rapidly due to leverage. 63% of retail investor accounts lose money when trading CFDs with this provider. You should consider whether you understand how CFDs work and whether you can afford to take the high risk of losing your money.
Stratos Global LLC (tradu.com ):
Losses can exceed deposits.
Please be advised that the information presented on TradingView is provided to Tradu (‘Company’, ‘we’) by a third-party provider (‘TFA Global Pte Ltd’). Please be reminded that you are solely responsible for the trading decisions on your account. There is a very high degree of risk involved in trading. Any information and/or content is intended entirely for research, educational and informational purposes only and does not constitute investment or consultation advice or investment strategy. The information is not tailored to the investment needs of any specific person and therefore does not involve a consideration of any of the investment objectives, financial situation or needs of any viewer that may receive it. Kindly also note that past performance is not a reliable indicator of future results. Actual results may differ materially from those anticipated in forward-looking or past performance statements. We assume no liability as to the accuracy or completeness of any of the information and/or content provided herein and the Company cannot be held responsible for any omission, mistake nor for any loss or damage including without limitation to any loss of profit which may arise from reliance on any information supplied by TFA Global Pte Ltd.
The speaker(s) is neither an employee, agent nor representative of Tradu and is therefore acting independently. The opinions given are their own, constitute general market commentary, and do not constitute the opinion or advice of Tradu or any form of personal or investment advice. Tradu neither endorses nor guarantees offerings of third-party speakers, nor is Tradu responsible for the content, veracity or opinions of third-party speakers, presenters or participants.
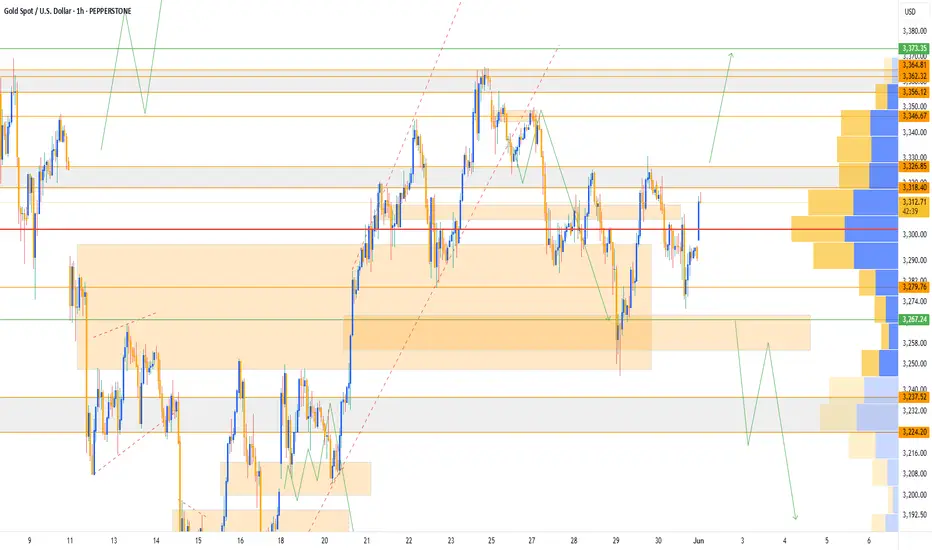
Gold 1H Intra-Day Chart 02.06.2025Huge push up on Gold on market open due to Russia - Ukraine war tension.
Option 1: Gold rejects from CMP and drops lower towards $3,270.
Option 2: If Gold closes bullish above $3,330 then $3,370 is the next major bullish target.
Which scenario do you find more likely?
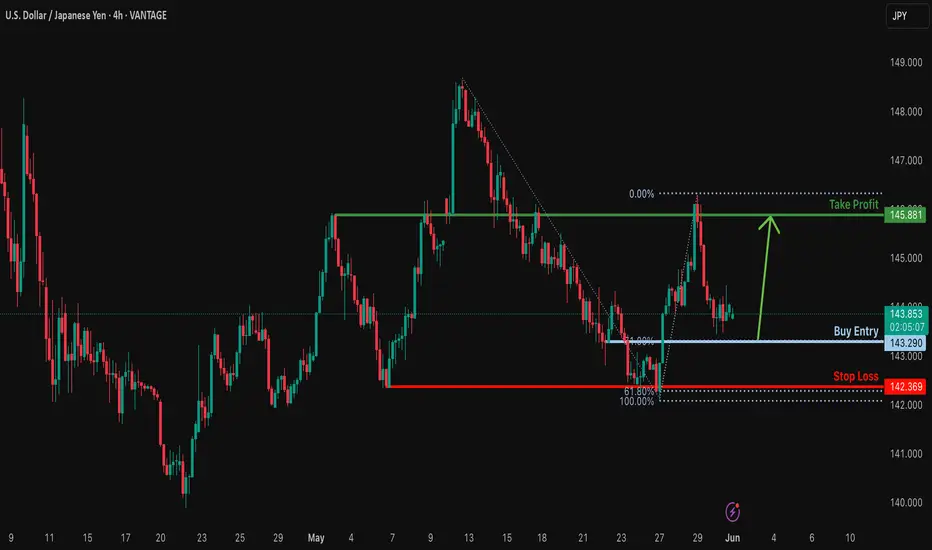
Bullish bounce?USD/JPY is falling towards the support level which id a pullback support that lines up with the 71% Fibonacci retracement and could bounce from this level to our take profit.
Entry: 143.29
Why we lke it:
There is a pullback support level that aligns with the 71% Fibonacci retracement.
Stop loss:142.36
Why we like it:
There is a pullback support level that lines up with the 61.8% Fibonacci projection.
Take profit: 145.88
Why we like it:
There is a pullback resistance level.
Enjoying your TradingView experience? Review us!
Please be advised that the information presented on TradingView is provided to Vantage (‘Vantage Global Limited’, ‘we’) by a third-party provider (‘Everest Fortune Group’). Please be reminded that you are solely responsible for the trading decisions on your account. There is a very high degree of risk involved in trading. Any information and/or content is intended entirely for research, educational and informational purposes only and does not constitute investment or consultation advice or investment strategy. The information is not tailored to the investment needs of any specific person and therefore does not involve a consideration of any of the investment objectives, financial situation or needs of any viewer that may receive it. Kindly also note that past performance is not a reliable indicator of future results. Actual results may differ materially from those anticipated in forward-looking or past performance statements. We assume no liability as to the accuracy or completeness of any of the information and/or content provided herein and the Company cannot be held responsible for any omission, mistake nor for any loss or damage including without limitation to any loss of profit which may arise from reliance on any information supplied by Everest Fortune Group.
Bullish bounce off pullback support?USD/JPY is falling towards the pivot which acts as a pullback support and could bounce to the 1st resistance.
Pivot: 141.94
1st Support: 140.24
1st Resistance: 148.56
,Risk Warning:
Trading Forex and CFDs carries a high level of risk to your capital and you should only trade with money you can afford to lose. Trading Forex and CFDs may not be suitable for all investors, so please ensure that you fully understand the risks involved and seek independent advice if necessary.
Disclaimer:
The above opinions given constitute general market commentary, and do not constitute the opinion or advice of IC Markets or any form of personal or investment advice.
Any opinions, news, research, analyses, prices, other information, or links to third-party sites contained on this website are provided on an "as-is" basis, are intended only to be informative, is not an advice nor a recommendation, nor research, or a record of our trading prices, or an offer of, or solicitation for a transaction in any financial instrument and thus should not be treated as such. The information provided does not involve any specific investment objectives, financial situation and needs of any specific person who may receive it. Please be aware, that past performance is not a reliable indicator of future performance and/or results. Past Performance or Forward-looking scenarios based upon the reasonable beliefs of the third-party provider are not a guarantee of future performance. Actual results may differ materially from those anticipated in forward-looking or past performance statements. IC Markets makes no representation or warranty and assumes no liability as to the accuracy or completeness of the information provided, nor any loss arising from any investment based on a recommendation, forecast or any information supplied by any third-party.

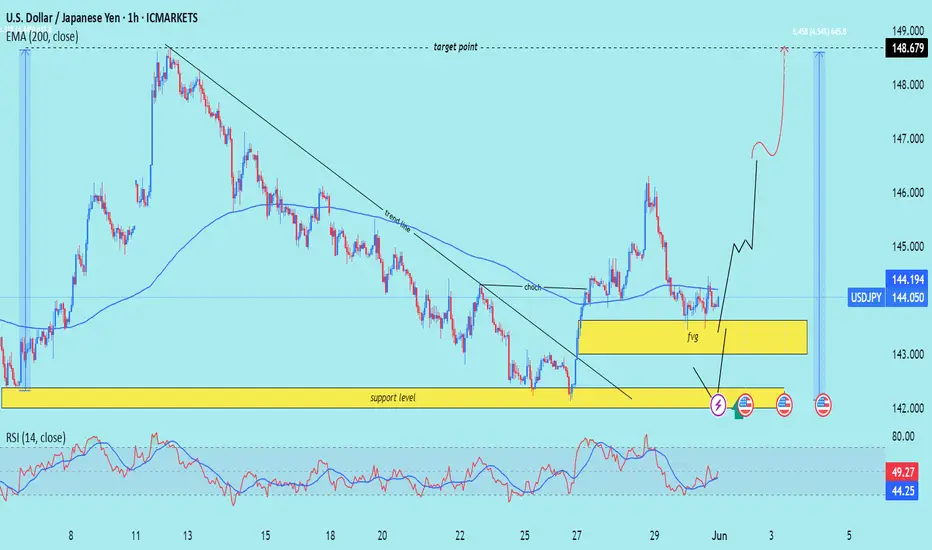
USD/JPY) bullish choch Analysis Read The ChaptianSMC trading point update
Technical analysis of USD/JPY presents a bullish outlook with Smart Money Concepts (SMC)-based logic. Here's a breakdown of the idea and key elements:
---
Chart Summary
Current Market Context
Price: ~144.05
EMA 200: Acting as dynamic resistance at 144.19
Trendline: Broken, signaling a potential shift in market structure
Change of Character (ChoCh): Confirmed around 143.3, marking a bullish transition
---
Key Zones Identified
1. Support Level (Strong Demand Zone)
Around 141.8–142.5
Marked by historical rejections
Possible mitigation of unfilled orders here
2. Fair Value Gap (FVG)
Between 143.0–143.8
Price may return to fill this imbalance before rising
---
Projected Move
Price is expected to:
1. Dip into the FVG or Support Zone to mitigate imbalance
2. Reverse and make a bullish rally
3. Reach the target point near 148.68 (approx. +4.55%)
---
RSI Analysis (14-period)
Current RSI: ~49 (neutral)
No overbought/oversold condition
Room for upside momentum
---
Notable Features
Break of structure (ChoCh) → Bullish signal
EMA crossover potential → Bullish confluence
Multiple FVG fills + support reaction → Entry confirmation opportunities
Economic events marked → Be cautious of volatility spikes
Mr SMC Trading point
---
Trading Idea Summary
Buy Entry Zone: 141.8–143.0 (support or FVG)
Stop Loss: Below 141.5
Target: 148.68
Risk/Reward: Favorable (approx. 1:3+)
Pales support boost 🚀 analysis follow)
Weekly FOREX Forecast Jun 2 - 6th: CHF & JPY FuturesThis is the FOREX futures outlook for the week of Jun 2 - 6th.
In this video, we will analyze the following FX markets:
CHF JPY
It's been a consolidative week, but the USD is still weak. Look for valid breakdowns of consolidations before buying against the USD.
NFP week ahead! Mon-Wed will be the best days to trade.
Enjoy!
May profits be upon you.
Leave any questions or comments in the comment section.
I appreciate any feedback from my viewers!
Like and/or subscribe if you want more accurate analysis.
Thank you so much!
Disclaimer:
I do not provide personal investment advice and I am not a qualified licensed investment advisor.
All information found here, including any ideas, opinions, views, predictions, forecasts, commentaries, suggestions, expressed or implied herein, are for informational, entertainment or educational purposes only and should not be construed as personal investment advice. While the information provided is believed to be accurate, it may include errors or inaccuracies.
I will not and cannot be held liable for any actions you take as a result of anything you read here.
Conduct your own due diligence, or consult a licensed financial advisor or broker before making any and all investment decisions. Any investments, trades, speculations, or decisions made on the basis of any information found on this channel, expressed or implied herein, are committed at your own risk, financial or otherwise.
