USD/JPY) Bullish reversal analysis Read The ChaptianMr SMC Trading point update
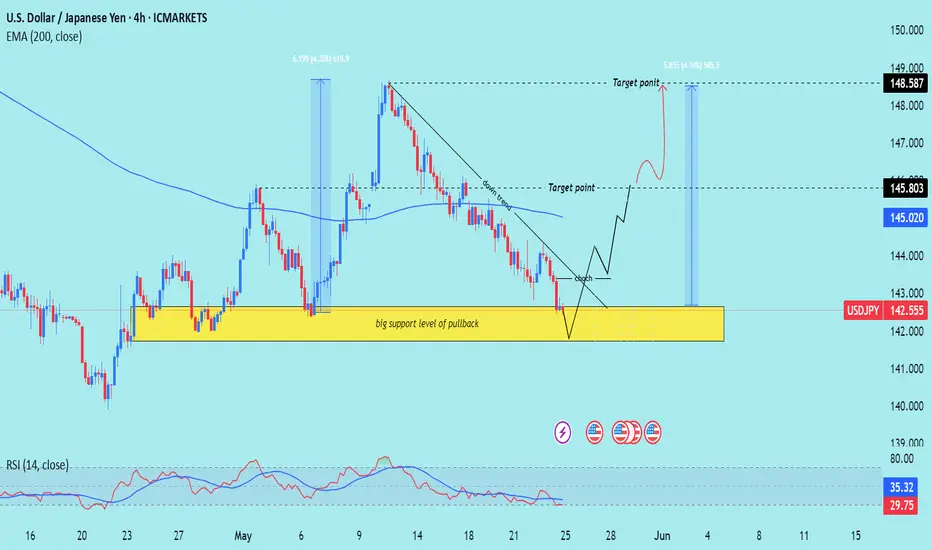
Technical analysis for the USD/JPY (U.S. Dollar / Japanese Yen) on the 4-hour timeframe. Here's a detailed breakdown of the idea and strategy:
---
Key Components of the Chart:
1. Strong Support Zone:
The yellow zone is labeled as a “big support level of pullback”, around the 142.00 – 141.20 range.
Price has historically bounced from this zone, suggesting demand and buyer interest.
2. Bullish Structure Setup:
Price is forming a double bottom or potential reversal pattern in the support zone.
A downtrend line is clearly marked, and a break above this trendline would signal bullish continuation.
3. EMA 200 (at 145.020):
The EMA is currently acting as dynamic resistance.
A breakout above the EMA would confirm further bullish momentum.
4. RSI Indicator:
RSI is currently below 30, indicating the market is oversold – a common precursor to a bullish reversal.
5. Target Levels:
Target 1: 145.803 – likely the first resistance level or EMA retest.
Target 2: 148.587 – a prior high and strong resistance area.
6. Projection:
Price is expected to bounce from support, break the trendline, retest, and then rally to higher levels.
---
Trade Idea Summary:
Bias: Bullish
Entry Zone: Near 142.00 – 141.20 (support zone)
Confirmation: Break above the descending trendline + bullish RSI divergence
Targets:
TP1: 145.803
TP2: 148.587
Invalidation: Break and close below 141.00 (support zone broken)
Mr SMC Trading point
---
Risk Management Suggestion:
Use a tight stop-loss below the support zone, considering it's the key reversal area. Also, keep an eye on fundamental factors such as U.S. and Japan interest rate decisions or key economic events (indicated by the icons on the chart).
Pales support boost 🚀 analysis follow)
USDJPY
Is a new round of decline impending?
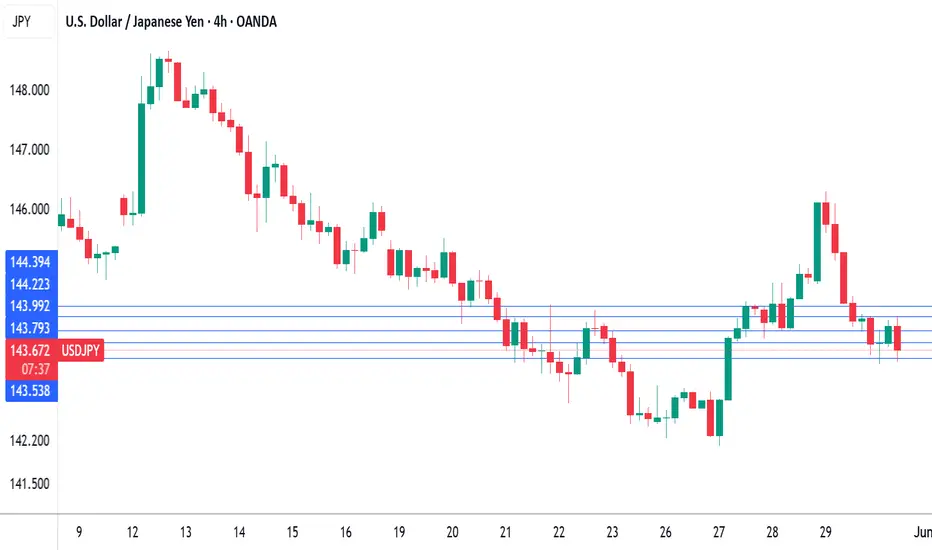
The latest prices of USD/JPY are fluctuating around the range of 1.43922 to 1.44275, with an average price of 1.43917. The earlier pullback from higher levels indicates some downward pressure. On the upside, the pair may encounter resistance near the 144.20 level, with the next key resistance at around 144.50 and the first major resistance at 145.00. A close above the 145.00 level could lay the foundation for further gains.
Under the above scenario, the pair may even break through the 146.00 resistance level, with the next major target for bulls near the 147.80 resistance level.
Humans need to breathe, and perfect trading is like breathing—maintaining flexibility without needing to trade every market swing. The secret to profitable trading lies in implementing simple rules: repeating simple tasks consistently and enforcing them strictly over the long term.

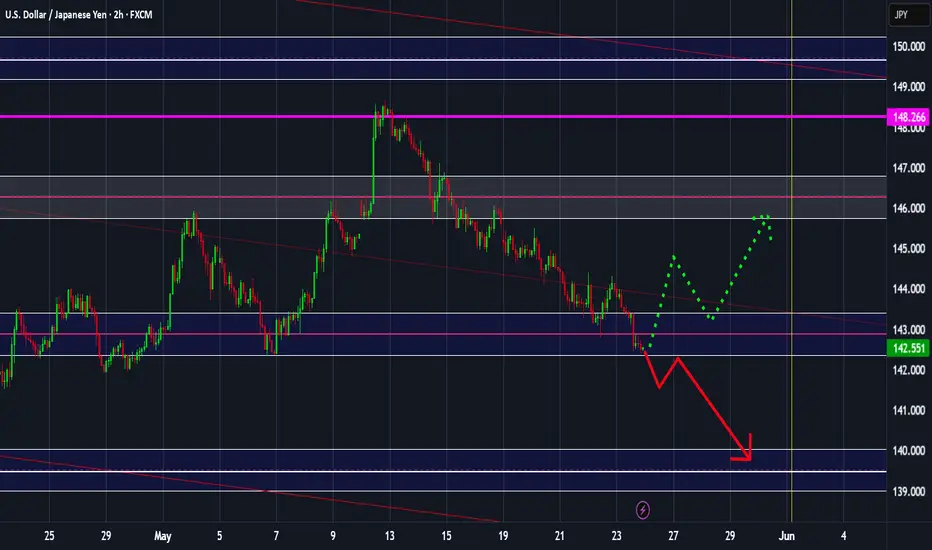
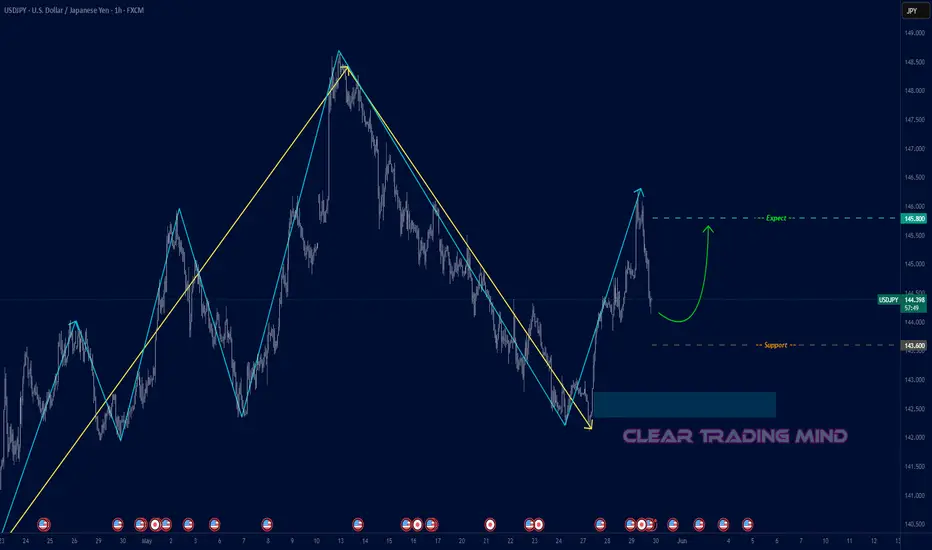
USDJPY starting bullish move?Hello traders, this is a complete multiple timeframe analysis of this pair. We see could find significant trading opportunities as per analysis upon price action confirmation we may take this trade. Smash the like button if you find value in this analysis and drop a comment if you have any questions or let me know which pair to cover in my next analysis.

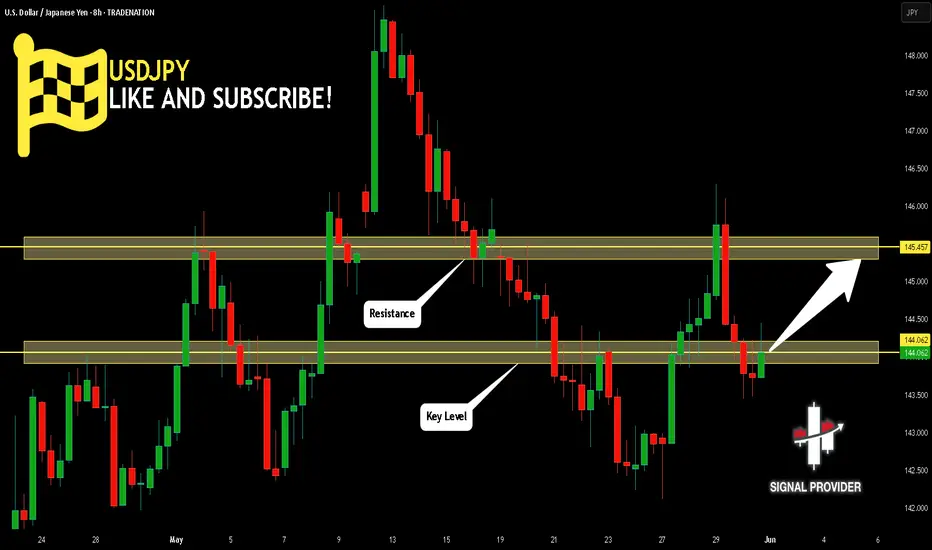
USDJPY Will Grow! Long!
Here is our detailed technical review for USDJPY.
Time Frame: 8h
Current Trend: Bullish
Sentiment: Oversold (based on 7-period RSI)
Forecast: Bullish
The market is trading around a solid horizontal structure 144.062.
The above observations make me that the market will inevitably achieve 145.457 level.
P.S
We determine oversold/overbought condition with RSI indicator.
When it drops below 30 - the market is considered to be oversold.
When it bounces above 70 - the market is considered to be overbought.
Disclosure: I am part of Trade Nation's Influencer program and receive a monthly fee for using their TradingView charts in my analysis.
Like and subscribe and comment my ideas if you enjoy them!
USDJPY 4H Analysis – Market Dynamics ChangingDear Traders,
Guys, the bearish trend in USDJPY has now shifted into a bullish uptrend. My target level for USDJPY is 146.330. Once it reaches my target, I will share updates under this post.
Friends, every single like from you is my biggest source of motivation when it comes to sharing my analysis.
A huge thank you to everyone who supports me with their likes!

Bullish USDJPY The video is self-explanatory.
UJ failing to break a strong weekly and daily support zone, which increases the probability of a bullish trend for the next days or weeks.

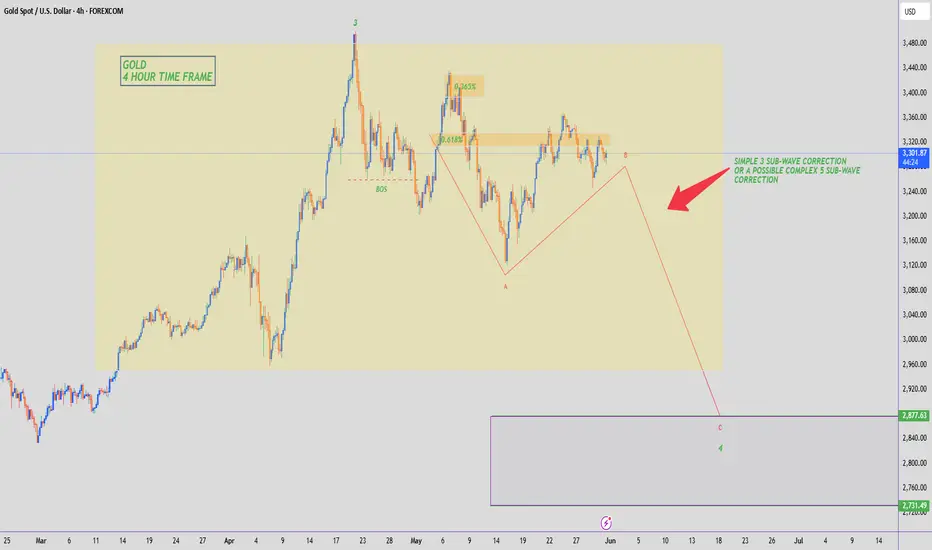
GOLD - WAVE 4 CORRECTION TO $2,800 (UPDATE)Gold has once again rejected the 0.618 Fib level & dropped back into the lower bound of the range zone overnight, which is what we like to see.
But overall, we remain within the range so we exercise patience & keep an eye out for any possible alternatives which might happen for Gold. Nice profits for us either way.
Japan core inflation hits two-year high, yen gains groundThe yen is higher on Friday. Iin the European session, USD/JPY is trading at 143.63, down 0.37% on the day.
Tokyo core CPI climbed to 3.6% y/y in May, up from 3.4% in April and above the market estimate of 3.5%. This marked the highest level since Jan. 2025. Tokyo core inflation is viewed as the leading indicator of nationwide inflation trends and is closely monitored by the Bank of Japan. Tokyo core CPI, which excludes fresh food, was driven higher due to due higher non-fresh food prices, particularly rice which has soared 93% over the past year.
The jump in core CPI bolsters the case for a BoJ rate hike. The markets had anticipated a rate hike in October but today's strong inflation report could accelerate the timing of the next rate hike. At the same time, the uncertainty caused by US trade policy may force the BoJ to delay any rate hikes until the impact of US tariffs on Japan's economy becomes clearer.
US President Trump's controversial tariffs have sent the financial markets on wild swings. Now, US courts are weighing in on whether Trump exceeded his authority when he imposed the tariffs. A trade court panel ruled this week that most of the tariffs were illegal but on Thursday, an appeals court granted the Trump administration a temporary pause, keeping the tariffs in effect.
The legal fight over the tariffs has just begun and could go all the way to the US Supreme Court. In the meantime, the legal challenge has blown a hole in Trump's tariff policy and is causing even more uncertainty in the financial markets.
USD/JPY takes fresh dip on renewed trade uncertaintyThanks to ongoing trade uncertainty and troubles in the bond market, the USD/JPY looks like is going to end the week on a negative note, after coming down sharply in the last day and a half, which means the weekly gains have more than halved.
The US dollar had actually clawed back a bit of ground in early Friday trading after taking a hit the day before. The rebound came despite fresh drama around Donald Trump’s tariff policies, which—unsurprisingly—are once again stirring the pot. A federal appeals court gave the president a temporary lifeline, pausing a ruling that could have derailed much of his economic agenda.
The White House team wasted no time doubling down: Trump, they insist, isn’t backing off. Tariffs are sticking around. But the mood got murkier when Treasury Secretary Scott Bessent admitted that US-China trade talks are “a bit stalled.” Then came Trump’s latest post on Truth Social, where he accused China of “totally violating” the trade deal with the US.
Markets didn’t take it well. US indices dipped, USD/JPY slid, and even the euro managed to push the dollar back a touch.
As well as well as trade uncertainty eyes will turn to incoming US data next week, among them the monthly jobs report on Friday.
The US jobs report is always important as it could impact the Fed’s future policy decisions. Traders will want to see whether the trade war uncertainty is negatively impacting the jobs market too, after several macro data, including consumption data in GDP report and consumer sentiment surveys, have come out weaker in recent weeks. JOLTS jobs data and ISM PMIs are also due out earlier in the week.
The US dollar has been under pressure in the last three months or so, with the euro performing admirably during this time despite US tariffs.
With the US recently losing its final top-tier credit rating at the hands of Moody’s a couple of weeks ago, investors are worried that debt concerns and government spending will push yields even higher and thus they are shorting Treasuries and the dollar, buying foreign currencies, including the euro. This makes the EUR/USD outlook remain fairly resilient around the 1.12-1.15 range.
By Fawad Razaqzada, market analyst with FOREX.com

USDJPY: Weekly overviewHello Traders, US news could move this pair dramatically.
I've made the white zone no trade because of strong additional zone around 148.225 for the bullish side and a sharp move needed to reach the zone.
The zone around 142.892 is more suitable for short trades, regarding the trend and distance from median of the channel. This zone is only suitable for long if the break be strong enough to overpass the median of the channel.
The indicated levels are determined based on the most reaction points and the assumption of approximately equal distance between the zones.
Some of these points can also be confirmed by the mathematical intervals of Murray.
You can enter with/without confirmation. IF you want to take confirmation you can use LTF analysis, Spike move confirmation, Trend Strength confrimation and ETC.
SL could be placed below the zone or regarding the LTF swings.
TP is the next zone or the nearest moving S&R, which are median and borders of the drawn channels.
*******************************************************************
Role of different zones:
GREEN: Just long trades allowed on them.
RED: Just Short trades allowed on them.
BLUE: both long and short trades allowed on them.
WHITE: No trades allowed on them! just use them as TP points
LONG ON USD/JPYUJ has given a choc (change or character) at a major demand zone.
JPY index structure is currently bearish.
I will buying UJ to the next swing high looking to catch 100-200 pips
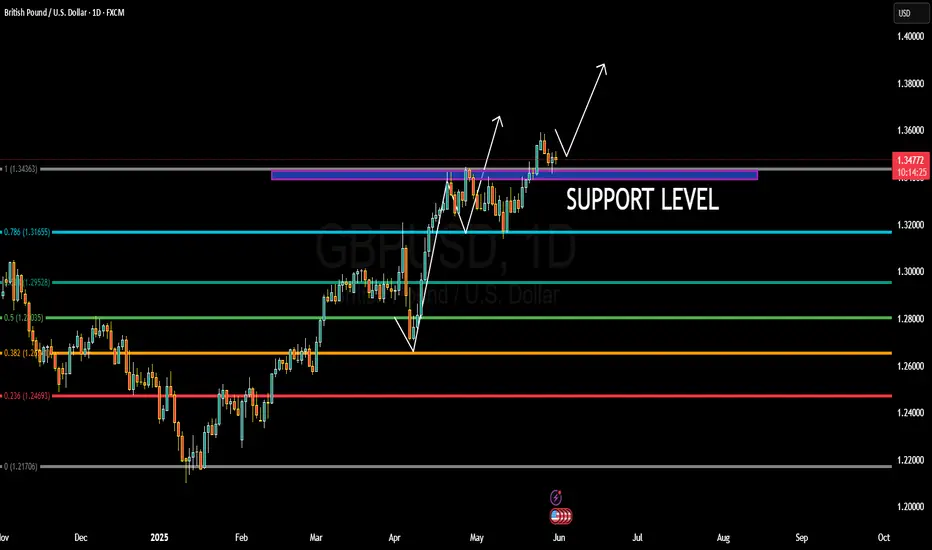
GBPUSD BULLISH OR BEARISH DETAILED ANALYSIS ??GBPUSD has successfully completed its retest of the 1.34300–1.34500 support zone and is now showing strong signs of resuming its bullish momentum. The recent structure confirms a classic bullish continuation pattern, as price bounced cleanly off a critical support level that previously acted as resistance. This level has now flipped into a solid demand zone, giving buyers confidence to push toward the 1.40000 psychological target. Price action continues to respect the uptrend with higher lows forming since mid-April, suggesting strength and institutional accumulation.
From a macroeconomic perspective, the British pound remains fundamentally supported. Recent UK inflation data surprised to the upside, causing the market to delay rate cut expectations from the Bank of England. In contrast, the US dollar is weakening due to rising expectations that the Federal Reserve could initiate rate cuts later this year as inflation cools and labor market data softens. This divergence in policy outlooks between the BoE and the Fed is fueling bullish pressure on GBPUSD, making the 1.40000 level a realistic and high-probability target.
Technical confluence also supports this bullish wave. Fibonacci retracement levels drawn from the recent swing low to the high align closely with the support zone at 1.34300, which acted as a perfect retest before the next leg higher. Additionally, the bullish engulfing candles and consistent daily closes above the support level add further confirmation to the upside bias. As long as the pair holds above 1.34300, the structure favors bulls with strong momentum to test and potentially break the 1.38000 intermediate level on the way to 1.40000.
GBPUSD remains a high-confidence bullish opportunity, aligning both technically and fundamentally. The recent breakout and retest phase is complete, and the pair now appears poised for a sustained rally. With bullish market sentiment, favorable UK data, and USD softness across the board, this setup offers an excellent risk-to-reward ratio for medium-term swing traders targeting the 1.40000 zone.
Yen Strengthens Beyond 144 on InflationThe Japanese yen rose past 144 per dollar, extending gains after Tokyo’s core inflation beat expectations, increasing the likelihood of a 25 bps BOJ rate hike in July.
BOJ Governor Kazuo Ueda said recent forecast adjustments were due to global risks and lower oil prices but reaffirmed the short-term policy stance remains focused on the 2% inflation goal. The yen also gained from safe-haven flows after a U.S. court reinstated Trump’s reciprocal tariffs.
Resistance is at 144.50, with further resistance at 145.40 and 146.10. Support levels stand at 143.50, 143.00, and 142.10.
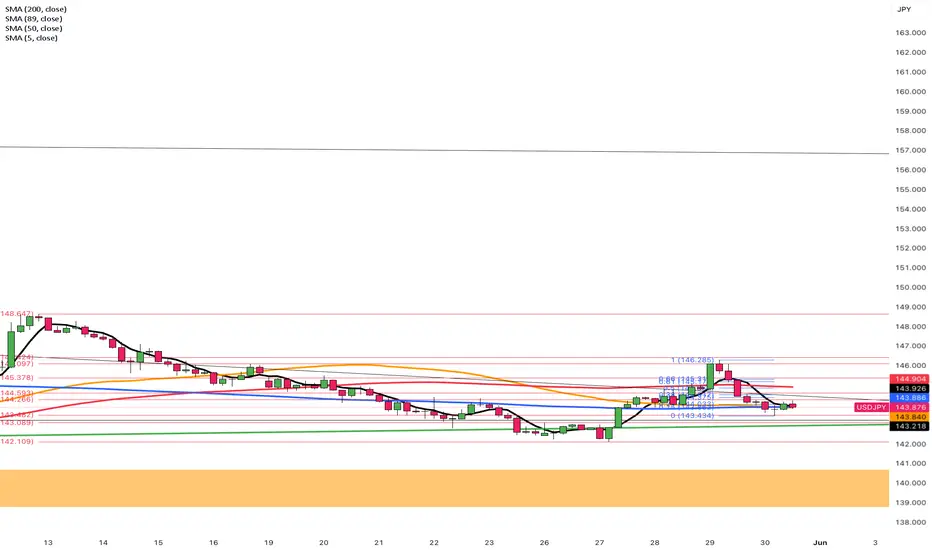
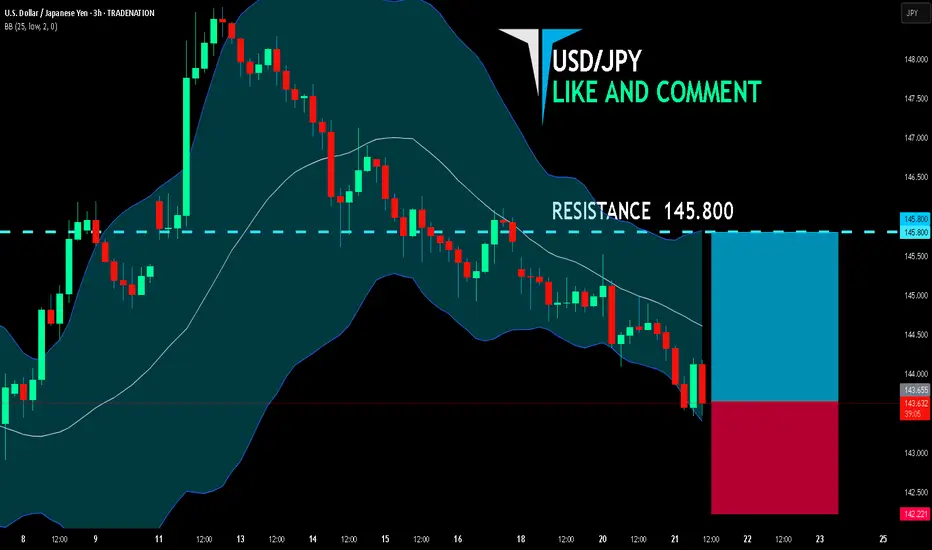
USD/JPY BEST PLACE TO BUY FROM|LONG
USD/JPY SIGNAL
Trade Direction: long
Entry Level: 143.655
Target Level: 145.800
Stop Loss: 142.221
RISK PROFILE
Risk level: medium
Suggested risk: 1%
Timeframe: 3h
Disclosure: I am part of Trade Nation's Influencer program and receive a monthly fee for using their TradingView charts in my analysis.
✅LIKE AND COMMENT MY IDEAS✅
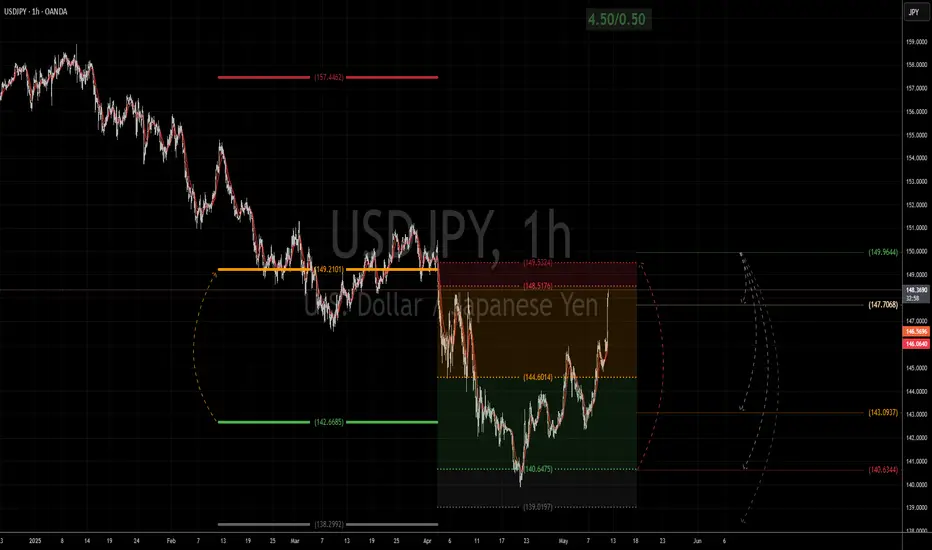
USDJPY - Predictive Analysis & Forecasting USDJPY
Scales
- S: pending 149.964 activation
- M: nears cycle completion from 140.648 to 148.52-149.53 target range
- L: 142.67 activation triggered 149.21 pivot
Forecast & Targets
- ST: limited upside to 149.96 max
- MT: bearish to 143.09 min, 138.29 max
#USDJPY #Forex #CROW2.0
4xForecaster
------
Originally published in BlueSky
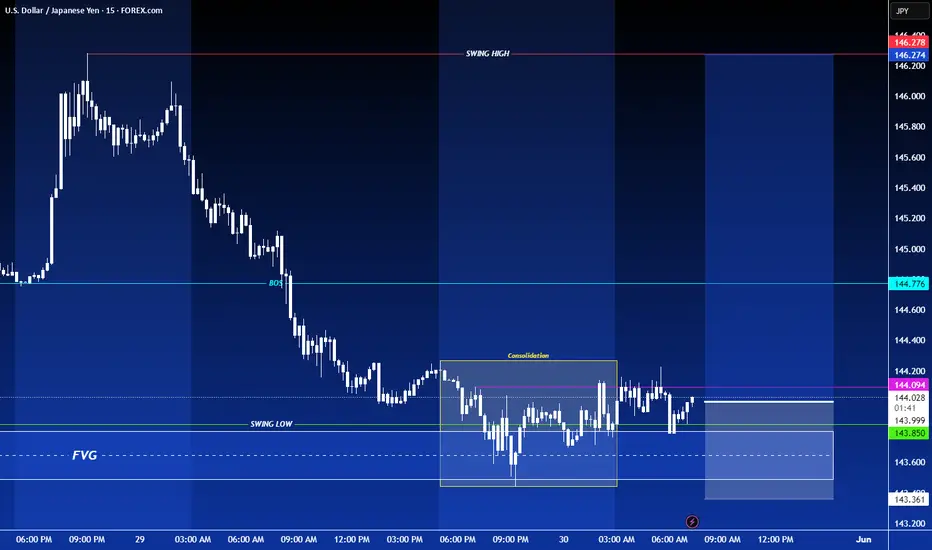
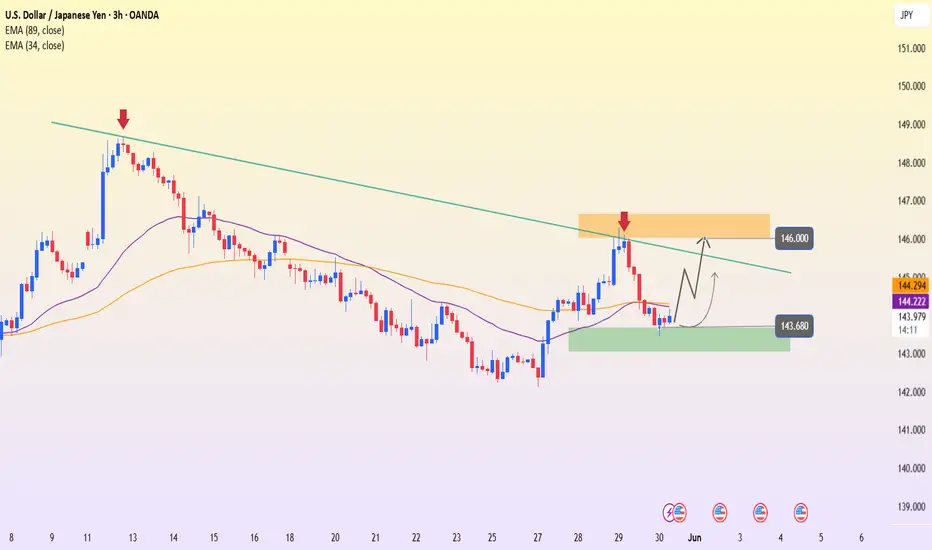
USDJPY – Supportive news, price may break resistance soonUSDJPY is supported by positive U.S. economic data, as the PCE index remains elevated—reinforcing expectations that the Fed will keep interest rates higher for longer. This has boosted bond yields and the USD, driving USDJPY upward.
On the H3 technical chart, USDJPY has rebounded from the support zone around 143.680. Both the EMA 34 and EMA 89 lie below the price, reinforcing the recovery momentum. The pair is now expected to approach the 146.000 resistance area—where it intersects with the long-term descending trendline that has rejected price at least twice before.
If buying pressure holds and 146.000 is decisively broken, a short-term bullish trend will likely be confirmed. However, another rejection could lead to a retest of the previous support zone. Overall, the current trend slightly favors the buyers.
Fundamental Market Analysis for May 30, 2025 USDJPYThe Japanese yen (JPY) attracted strong follow-through buying for the second consecutive day on Friday and continued to recover from a two-week low reached the previous day against the US dollar. Global risk sentiment deteriorated after a federal appeals court on Thursday suspended a recent ruling blocking US President Donald Trump's radical tariffs. This is evident from the general weakening of sentiment in the stock markets and is contributing to a recovery in demand for traditional safe-haven assets, including the JPY.
Meanwhile, optimistic macroeconomic data from Japan released today, including strong consumer inflation figures in Tokyo, confirm the need for further interest rate hikes by the Bank of Japan (JPY) and provide additional support for the JPY. On the other hand, the US dollar (USD) is consolidating after a sharp reversal yesterday amid concerns about the deterioration of the US financial situation and bets that the Federal Reserve (Fed) will stick to its easing policy. This further contributes to the continued decline of the USD/JPY pair.
Trading recommendation: SELL 143.800, SL 144.200, TP 142.900
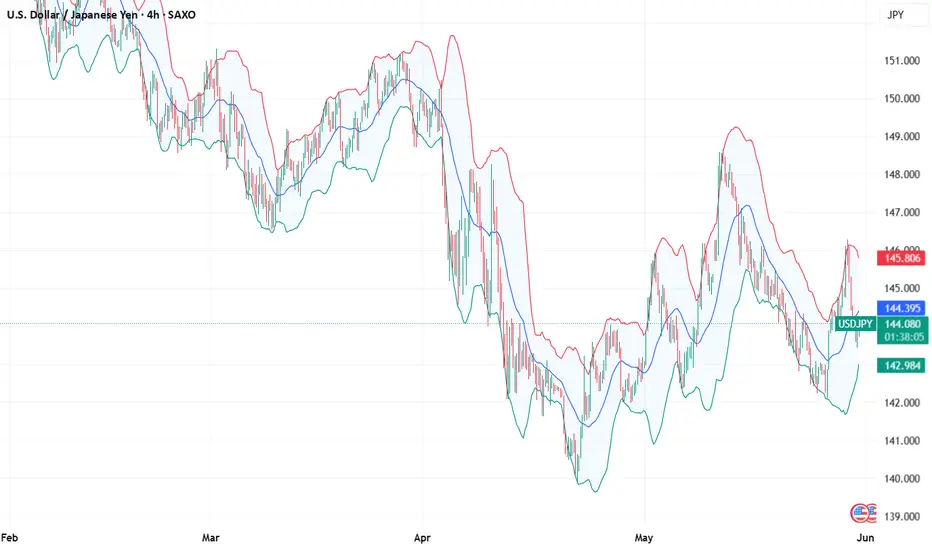
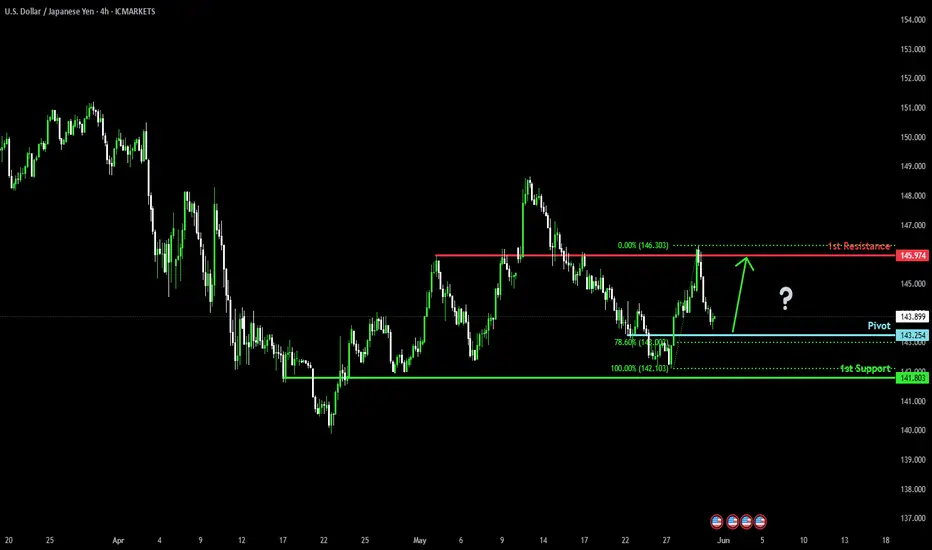
Could the price bounce from here?USD/JPY is falling towards the pivot and could bounce to the 1st resistance, which acts as a pullback resistance.
Pivot: 143.25
1st Support: 141.80
1st Resistance: 145.97
Risk Warning:
Trading Forex and CFDs carries a high level of risk to your capital and you should only trade with money you can afford to lose. Trading Forex and CFDs may not be suitable for all investors, so please ensure that you fully understand the risks involved and seek independent advice if necessary.
Disclaimer:
The above opinions given constitute general market commentary, and do not constitute the opinion or advice of IC Markets or any form of personal or investment advice.
Any opinions, news, research, analyses, prices, other information, or links to third-party sites contained on this website are provided on an "as-is" basis, are intended only to be informative, is not an advice nor a recommendation, nor research, or a record of our trading prices, or an offer of, or solicitation for a transaction in any financial instrument and thus should not be treated as such. The information provided does not involve any specific investment objectives, financial situation and needs of any specific person who may receive it. Please be aware, that past performance is not a reliable indicator of future performance and/or results. Past Performance or Forward-looking scenarios based upon the reasonable beliefs of the third-party provider are not a guarantee of future performance. Actual results may differ materially from those anticipated in forward-looking or past performance statements. IC Markets makes no representation or warranty and assumes no liability as to the accuracy or completeness of the information provided, nor any loss arising from any investment based on a recommendation, forecast or any information supplied by any third-party.
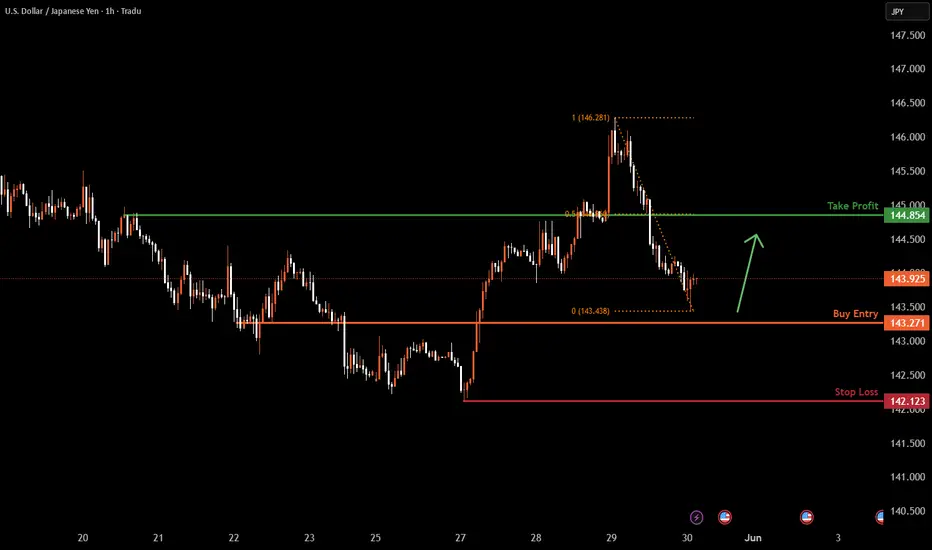
USDJPY H1 I Bullish Reversal Based on the H1 chart analysis, the price is falling our buy entry level at 143.27, a pullback support.
Our take profit is set at 144.85, a pullback resistance that aligns with the 50% Fibonacci retracement.
The stop loss is placed at 142.12, a swing low support.
High Risk Investment Warning
Trading Forex/CFDs on margin carries a high level of risk and may not be suitable for all investors. Leverage can work against you.
Stratos Markets Limited (tradu.com ):
CFDs are complex instruments and come with a high risk of losing money rapidly due to leverage. 63% of retail investor accounts lose money when trading CFDs with this provider. You should consider whether you understand how CFDs work and whether you can afford to take the high risk of losing your money.
Stratos Europe Ltd (tradu.com ):
CFDs are complex instruments and come with a high risk of losing money rapidly due to leverage. 63% of retail investor accounts lose money when trading CFDs with this provider. You should consider whether you understand how CFDs work and whether you can afford to take the high risk of losing your money.
Stratos Global LLC (tradu.com ):
Losses can exceed deposits.
Please be advised that the information presented on TradingView is provided to Tradu (‘Company’, ‘we’) by a third-party provider (‘TFA Global Pte Ltd’). Please be reminded that you are solely responsible for the trading decisions on your account. There is a very high degree of risk involved in trading. Any information and/or content is intended entirely for research, educational and informational purposes only and does not constitute investment or consultation advice or investment strategy. The information is not tailored to the investment needs of any specific person and therefore does not involve a consideration of any of the investment objectives, financial situation or needs of any viewer that may receive it. Kindly also note that past performance is not a reliable indicator of future results. Actual results may differ materially from those anticipated in forward-looking or past performance statements. We assume no liability as to the accuracy or completeness of any of the information and/or content provided herein and the Company cannot be held responsible for any omission, mistake nor for any loss or damage including without limitation to any loss of profit which may arise from reliance on any information supplied by TFA Global Pte Ltd.
The speaker(s) is neither an employee, agent nor representative of Tradu and is therefore acting independently. The opinions given are their own, constitute general market commentary, and do not constitute the opinion or advice of Tradu or any form of personal or investment advice. Tradu neither endorses nor guarantees offerings of third-party speakers, nor is Tradu responsible for the content, veracity or opinions of third-party speakers, presenters or participants.
USDJPY Bullish Pullback Setup – Targeting 145.800
USDJPY has broken out of the previous downtrend structure and is now showing a potential bullish continuation pattern.
- The recent impulse move from the demand zone (highlighted in blue) confirms buying interest around 143.600.
- The current pullback could offer a buy opportunity, especially if the price retests the 143.600 support zone or forms a higher low.
- As long as the price holds above this key support, we expect the pair to continue upward toward the next major resistance at 145.800.
USDJPY is forming a clean bullish correction after an impulsive move up. If support at 143.600 holds, the next bullish leg could extend to 145.800. Watch for bullish confirmation near the pullback zone.
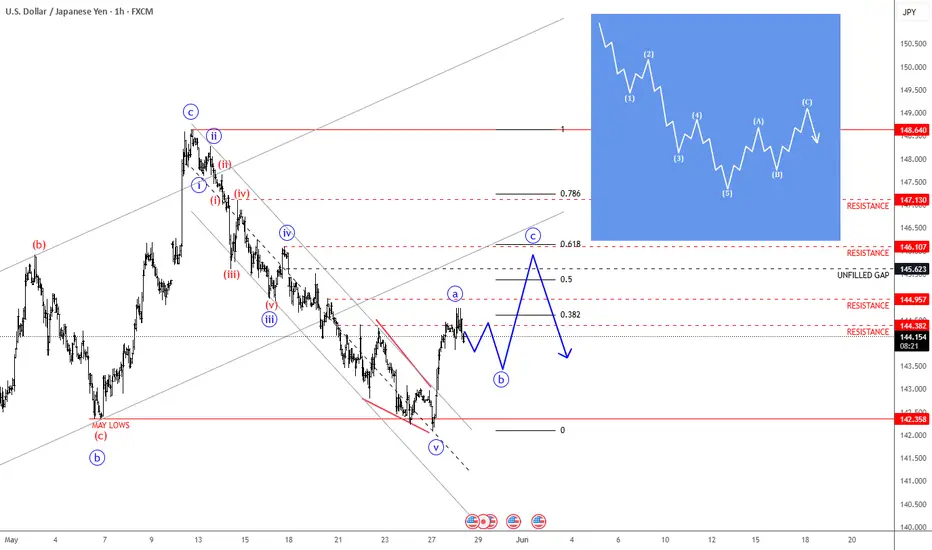
USDJPY Faces An Intraday Corrective RecoveryUSDJPY Faces An Intraday Corrective Recovery after a bearish impulse, which can later send the price lower from technical and Elliott wave pespective.
USDJPY is sharply bouncing after reaching May lows within the wedge pattern for wave »v« of an impulse, so it can be now trading in a higher degree abc correction, which can recover the price back to 145 – 146 resistance area before bears return.
Basic bearish Elliott wave pattern shows that a five-wave impulsive decline indicates for more weakness after a corrective three-wave pause.
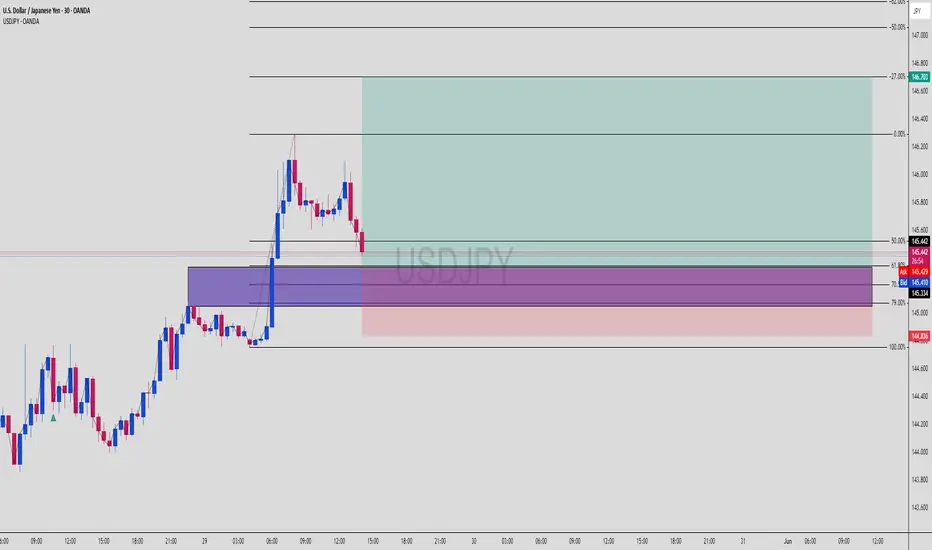
USDJPY SMC Play | Order Block + Fibo 61.8 = Precision EntryUSDJPY | Confluence Entry in Motion 🚀
A beautifully aligned setup using Smart Money Concepts, with a clear entry mapped out at the OB + Fib 61.8% retracement zone. Price just tapped into the purple zone — now it’s all eyes on bullish momentum confirmation.
📊 1. Market Overview
USDJPY has been trending bullish, with a strong impulsive move followed by a retracement — price is now sitting at a key decision zone.
The zone is a refined bullish Order Block (purple) aligning perfectly with:
✅ 61.8% Fibonacci retracement
✅ 70.5% golden zone
✅ Strong imbalance below
We’re seeing a beautiful reaction candle off this area as price hunts liquidity.
🧠 2. Why This Trade Makes Sense (SMC Breakdown)
Here’s the logic:
Price broke structure to the upside
Pullback into OB + discounted pricing
Clean liquidity sweep just beneath the short-term low
Room for continuation toward higher timeframe POI (top green zone)
This is a textbook SMC + Fibonacci sniper setup.
🎯 3. Entry Zone (Purple Box)
📍 OB Zone: 145.200 – 145.334
🧮 Fib Levels:
— 50%: 145.595
— 61.8%: 145.334
— 70.5%: ~145.200
— 100% (SL): 144.836
Your entry's beautifully layered with confluences = 🔥 Risk/Reward.
🚀 4. Target Zones
🟢 TP1: 146.000
🟢 TP2: 146.703
(TOP of the Fibonacci extension, completing the full bullish leg)
⚖️ 5. Risk-Reward Setup
✅ SL: 144.836
✅ Entry: around 145.334
✅ TP: 146.703
👉 RRR: Over 1:4 — institutional grade 🔥
🛡️ 6. Trade Management Tips
✅ Wait for bullish engulfing or LTF break of structure for confirmation
🕰️ Drop to M15 for precise sniper confirmation entry
🔄 If it taps again with more imbalance left = re-entry possible
📌 Save this if you love high confluence entries
🔥 Drop “SMC Sniper” in the comments if you're watching this pair
👀 Follow for daily setups just like this — clean, confident, and calculated
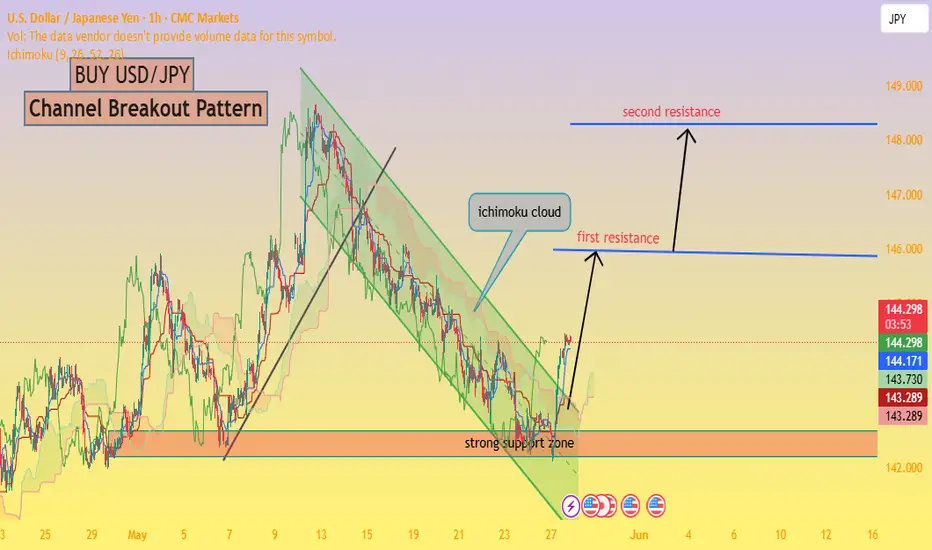
USD/JPY 1H Analysis – Channel Breakout and Buy SignalOverview:**
The USD/JPY chart shows a **bullish breakout from a descending channel**, supported by technical indicators like the Ichimoku Cloud and a strong demand zone. This setup suggests a potential bullish reversal and upward momentum.
*Key Technical Points:**
* **Descending Channel Breakout:**
Price action has broken out of a falling channel, indicating a shift in market sentiment from bearish to bullish.
* **Strong Support Zone:**
Around 143.28 – 143.73, the price found significant support, which aligns with a previous demand zone. This area held firm, helping trigger the breakout.
* **Ichimoku Cloud:**
Price is emerging above the Ichimoku Cloud, signaling a potential start of an uptrend. If the price maintains above the cloud, bullish momentum may strengthen.
* **Resistance Levels:**
* **First Resistance:** Near 146.00 – a critical area to watch for short-term profit-taking.
* **Second Resistance:** Around 148.00 – a more extended target if bullish continuation holds.
---
### **Trading Idea:**
**BUY USD/JPY** on successful retest of the breakout or sustained move above the Ichimoku Cloud.
* **Entry:** 144.30–144.40 zone
* **Target 1:** 146.00
* **Target 2:** 148.00
* **Stop Loss:** Below 143.20 (under the support zone)
---
Conclusion:**
The chart presents a classic **bullish channel breakout** supported by the Ichimoku indicator and price action at a strong support zone. As long as the price holds above the breakout level and Ichimoku Cloud, the upside targets at 146 and 148 remain valid.
Let me know if you want this formatted as a trade plan or journal entry.
To ensure you do not miss the upcoming analysis, be sure to follow me!
Please leave a remark and a like!