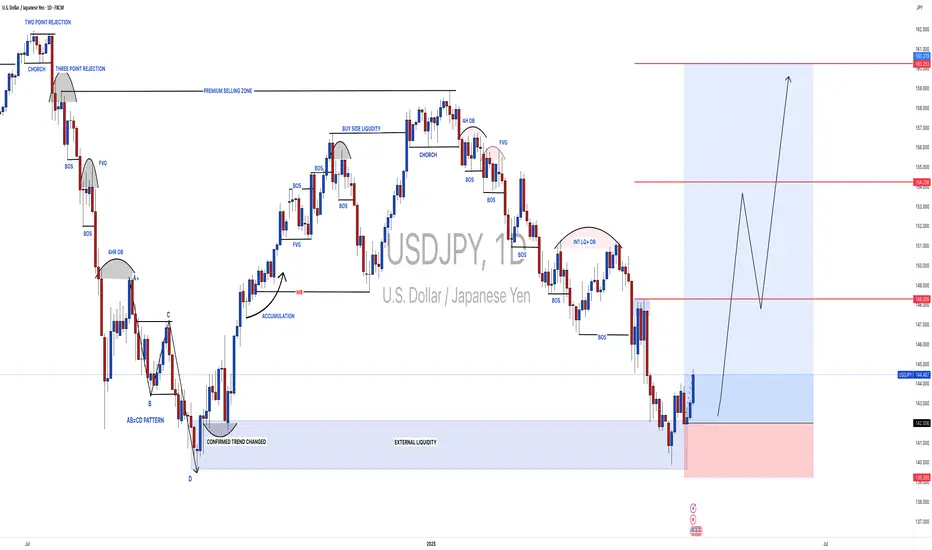
USDJPY: 300+ Pips From Previous Idea, What Hold Next? Hey Everyone
USDJPY is on a roll! It’s rebounded a whopping 300+ pips and is now on the positive side. We reckon it’s going to keep climbing in the coming days as DXY is starting to regain its strength.
And here’s the cherry on top: there’s some exciting news coming up, including the NFP tomorrow. This could really boost the USDJPY to a new record high.
But remember, when trading, it’s crucial to manage your risk carefully.
Now, let’s talk about the potential for a significant market movement. We’ve spotted a chance for a substantial bullish swing that could reach around 2050 pips. We’ve also identified three potential targets, so you can choose the one that best fits your analysis.
The main driver behind this move is the reversal of the Japanese Yen (JPY) from a bullish trend to a bearish one. So, let’s be cautious and use precise risk management techniques during this period.
Good luck and happy trading! 😊
Oh, and if you’d like to help us out, here are a few things you can do:
- Like our ideas
- Comment on our ideas
- Share our ideas
Thanks a bunch for your support! 😊
Cheers,
The Setupsfx_ Team
USDJPY
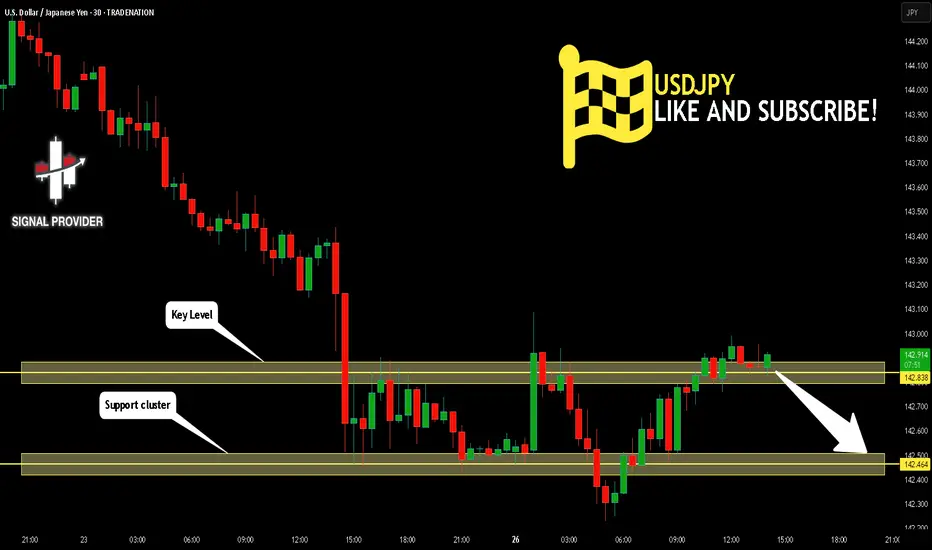
USDJPY Is Bearish! Short!
Take a look at our analysis for USDJPY.
Time Frame: 30m
Current Trend: Bearish
Sentiment: Overbought (based on 7-period RSI)
Forecast: Bearish
The market is testing a major horizontal structure 142.838.
Taking into consideration the structure & trend analysis, I believe that the market will reach 142.464 level soon.
P.S
Please, note that an oversold/overbought condition can last for a long time, and therefore being oversold/overbought doesn't mean a price rally will come soon, or at all.
Disclosure: I am part of Trade Nation's Influencer program and receive a monthly fee for using their TradingView charts in my analysis.
Like and subscribe and comment my ideas if you enjoy them!
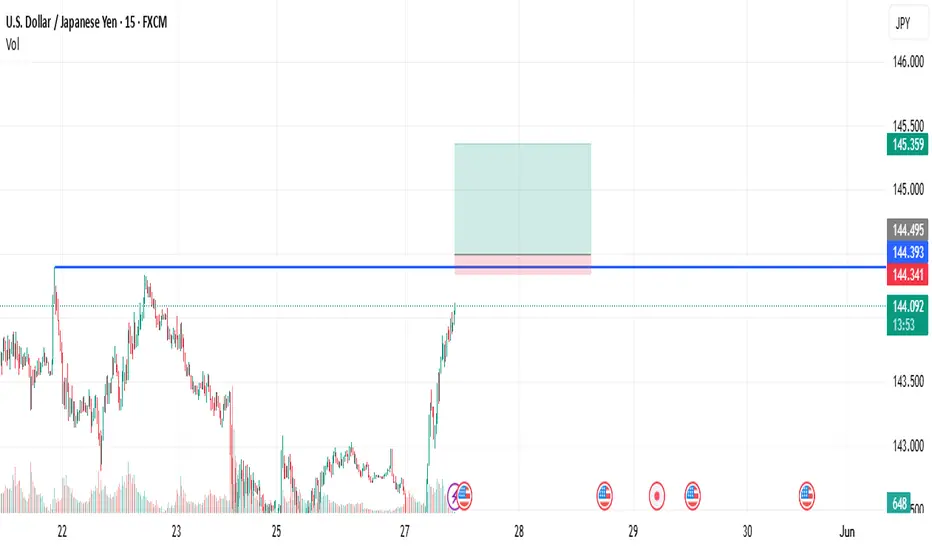
USDJPY Breakout Watch | Bullish Momentum Toward Key ResistanceUSD/JPY is showing strong bullish momentum on the 15-minute chart, breaking out of a consolidation range with increased volume.
Technical Highlights:
Price has surged with strong bullish candles, showing clean impulsive movement.
The key level at 144.39 is being tested as potential breakout resistance.
If price sustains above this zone, it may target the next resistance area near 145.35.
Clean price structure with volume supporting upward movement.
Risk is managed with a stop below the breakout level, targeting a favorable risk-to-reward ratio.
This setup reflects trend continuation with bullish momentum and clear technical structure.
📈 Watching closely for confirmation and follow-through above key breakout zone.
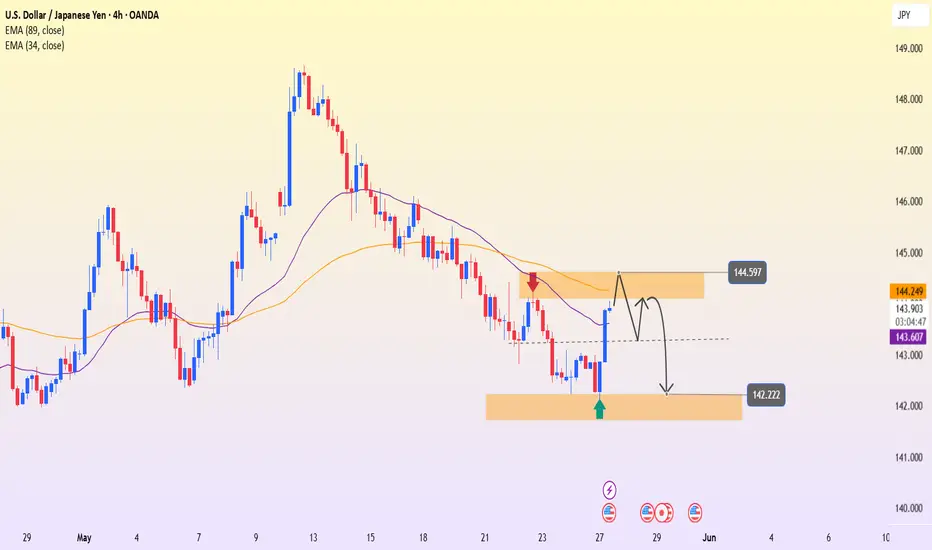
Downtrend Awaiting ConfirmationUSDJPY has just made a technical rebound from the support zone at 142.22 up to the resistance area around 144.60 — a confluence with both the EMA 34 and EMA 89. However, based on the chart, this zone has previously acted as a reversal point, and price is now retesting that same level of rejection.
The current price action suggests a high likelihood of a small double-top pattern forming around 144.60. If selling pressure re-emerges here, the market could reverse and head back down toward 142.22, aligning with the developing downtrend.
Moody’s recent warning on U.S. credit rating has placed pressure on the USD, while the JPY continues to hold its safe-haven appeal amid market uncertainty.
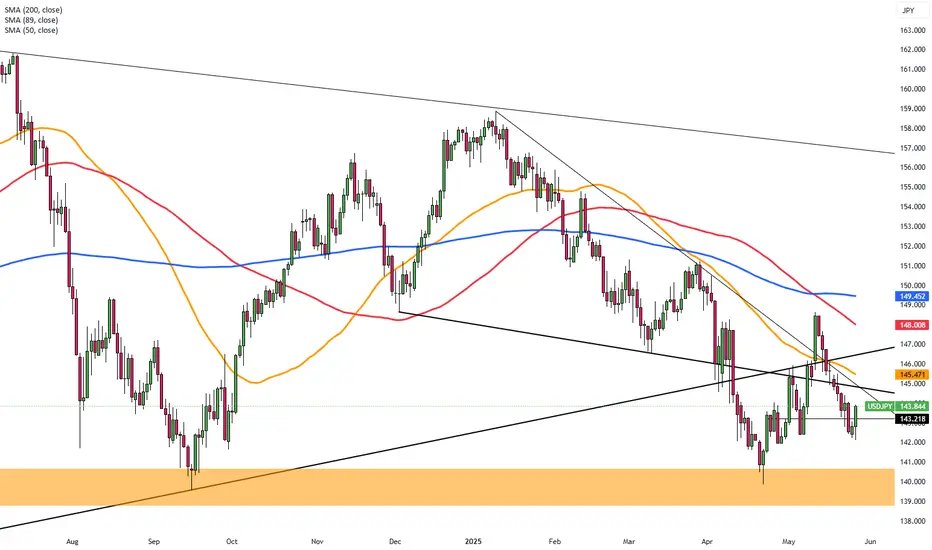
Yen Reaches Highest Level in a MonthThe Japanese yen strengthened toward 142 per dollar on Tuesday, its highest in four weeks, driven by safe-haven inflows and weak dollar sentiment tied to Trump’s fiscal plan. Worries over a widening U.S. deficit weighed on the greenback, while speculation of a 25% iPhone tariff added to trade conflicts. Domestically, expectations for more BoJ tightening rose after core inflation surprised at 3.5%, a two-year high.
Resistance stands at 148.60, with further levels at 149.80 and 151.20. Support is found at 139.70, then 137.00 and 135.00.
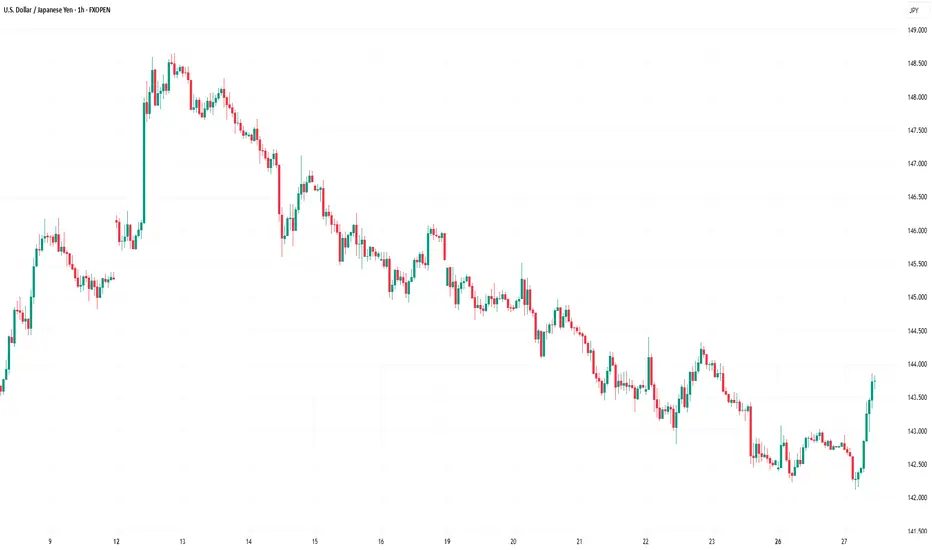
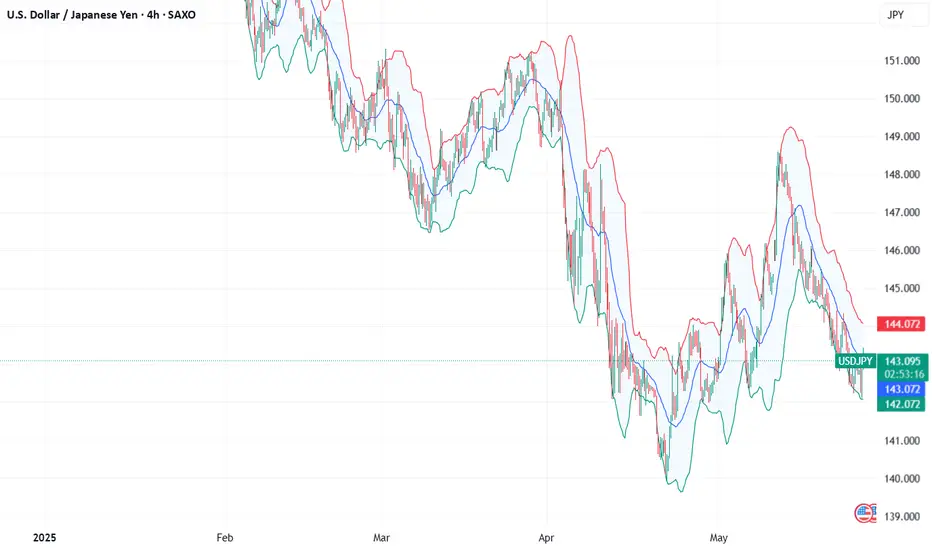
Analysing the Volatility Spike on the USD/JPY ChartAnalysing the Volatility Spike on the USD/JPY Chart
The USD/JPY chart offers plenty of noteworthy insights for analysis:
→ A one-month low was recorded today (marked by the arrow);
→ This was followed by a sharp upward reversal, with a series of large bullish candlesticks forming on the intraday chart.
Why Is USD/JPY Moving Sharply Today?
The primary driver appears to be recent statements from Bank of Japan Governor Kazuo Ueda.
According to Trading Economics, this morning Ueda:
→ warned of rising core inflation risks linked to increasing food prices;
→ indicated that the Bank of Japan is prepared to adjust its monetary policy in order to achieve a stable inflation target.
Latest data show that Japan’s core inflation unexpectedly rose to 3.5% — the highest level in two years — reinforcing the case for further rate hikes. However, what's particularly striking is that despite Ueda’s hawkish tone, the yen is weakening.
Technical Analysis of the USD/JPY Chart
Yen fluctuations formed a downward trajectory (marked in orange) in the second half of May, partly driven by US dollar weakness. Following a period of relative calm, the market has shifted into high gear — the ATR indicator is climbing sharply from multi-month lows, breaking through resistance at the 143.0 level.
This aggressive price action on the USD/JPY chart today suggests we may be witnessing an attempted bullish breakout from the channel. In light of this, it is possible that the surge in volatility reflects a fundamental shift in market sentiment — one that could potentially lead to the development of an upward trend.
This article represents the opinion of the Companies operating under the FXOpen brand only. It is not to be construed as an offer, solicitation, or recommendation with respect to products and services provided by the Companies operating under the FXOpen brand, nor is it to be considered financial advice.
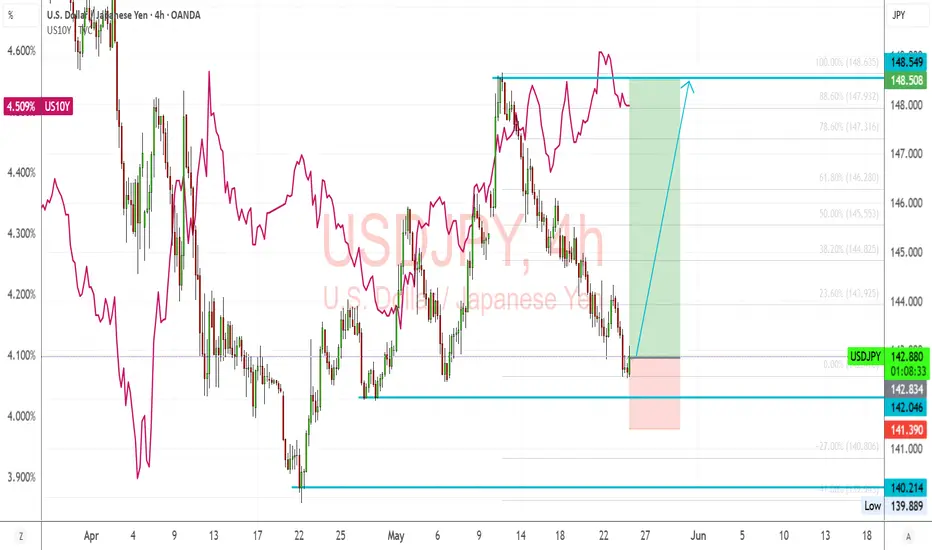
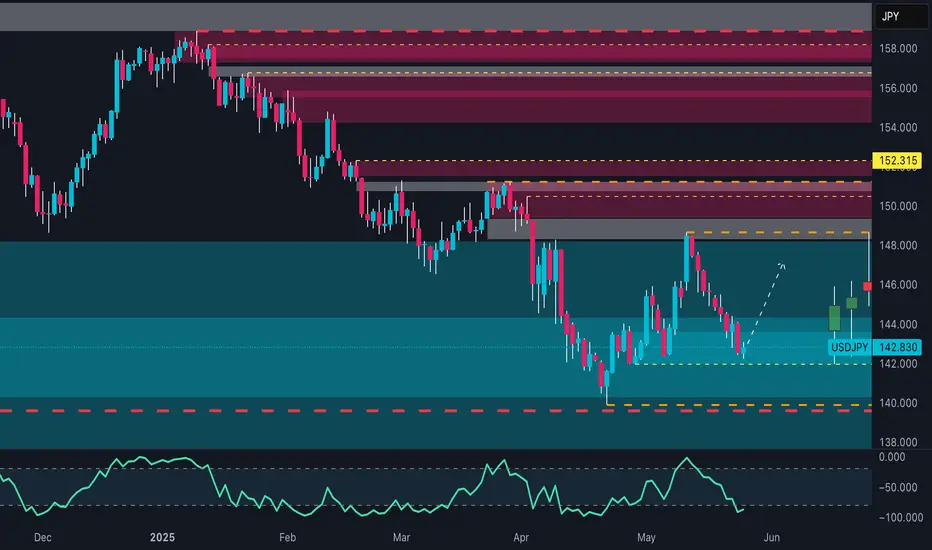
USDJPY Analysis – Yield Support Signals Potential UpsideUSDJPY is currently sitting at a key support zone around 142.80–143.00, showing signs of a potential bullish reversal. This support area has previously acted as a strong launchpad for price rallies.
🟢 Technical Setup:
Price action has formed a clean higher low structure, bouncing off horizontal support.
The US10Y Treasury Yield (pink line) has rebounded sharply and is diverging to the upside — a leading indicator for USDJPY strength.
The Fib retracement from the last swing move aligns well with the 0% zone, suggesting the dip might be complete.
A bullish reaction from here targets the 148.50 zone, with intermediate resistance around 145.00–146.00.
🟠 Risk Levels:
Invalidated below 141.40 (structure break).
Stops could be placed below 142.00, targeting a 2:1 or better risk-reward ratio.
🔍 Macro-Fundamental Insight:
U.S. Yields are firming despite mixed Fed signals — this gives strength to USD, especially against low-yielders like the JPY.
BOJ remains dovish with no urgency to normalize rates, keeping the yen weak.
With risk appetite improving and bond yields lifting, carry trade dynamics favor USDJPY upside.
✅ Conclusion:
As long as US10Y yields remain firm and USD holds above 142.00, USDJPY has a strong probability of rallying toward 148.50. Look for confirmation with higher highs on the 4H chart and continued divergence between yield and price.
USDJPY | FVG + OB + Weak Low Target = Textbook SMC Setup📊 USDJPY | 1H Bearish Play – Smart Money In Control
We’re seeing a classic setup where price retraces into a bearish zone of confluence and prepares for a selloff toward internal liquidity. Check the breakdown:
🔻 1. Structure Shift Confirmed
Price broke structure on the downside after forming a lower high
Current move is a retracement into discount OB zone
Clear rejection is forming, signaling short momentum incoming
🟪 2. Zone Confluence
📌 Order Block (OB): Sitting just under the 61.8% Fib
📌 Fair Value Gap (FVG): Mitigated perfectly
📌 Fib Retracement: Price reacts between 61.8% and 70.5% — classic Smart Money play
📌 Previous Demand Turned Supply: This level is now acting as a rejection zone
This is stacked confluence — just how Smart Money likes to move.
💣 3. Entry Strategy
Entry Zone: 142.55 (midpoint of the OB reaction area)
Stop Loss: Above 143.443 (above OB + liquidity wick)
Take Profit: 139.888 (weak low, previous liquidity resting point)
⚖️ 4. Risk-to-Reward Ratio (RRR)
🎯 TP = 139.888
📍 Entry = 142.550
🔐 SL = 143.443
✅ RRR ≈ 1:3.5
A great example of high-probability short setup using pure Smart Money logic.
📉 5. Why This Works
Retail traders will try to long at this zone hoping for a breakout
Smart Money uses this zone to engineer liquidity
They tap into the FVG/OB, then target internal liquidity and weak lows
Clean, controlled sell-off expected down to 139.888
🧠 SMC Insights
This chart is all about liquidity engineering:
Push up into OB
Reject at premium pricing
Drive down to weak low to collect stops
Possibly reverse or continue trend from there
💬 Comment “FVG TAP + OB = 🔥” if you spotted this setup early
💾 Save it before the drop happens
📤 Share with a fellow SMC trader who needs this breakdown

Fundamental Market Analysis for May 27, 2025 USDJPYThe Japanese yen (JPY) is attracting fresh buyers in Tuesday's Asian session following the release of strong inflation data. Additionally, comments from Bank of Japan Governor Kazuo Ueda left the door open for further policy tightening by the central bank. This is in sharp contrast to expectations that the Federal Reserve (Fed) will continue to cut interest rates this year, and is proving to be a key factor that is providing a nice lift for the yen.
In addition, persistent geopolitical risks related to the protracted war between Russia and Ukraine and conflicts in the Middle East are contributing to the yen's safe haven status. The US dollar (USD), on the other hand, remains near its lowest level since April 22 amid concerns over the deteriorating US fiscal situation. This contributes to the USD/JPY pair's fall to 142.000, or more than a one-month low, and supports the prospects for further losses.
Trading recommendation: SELL 143.300, SL 143.900, TP 142.000
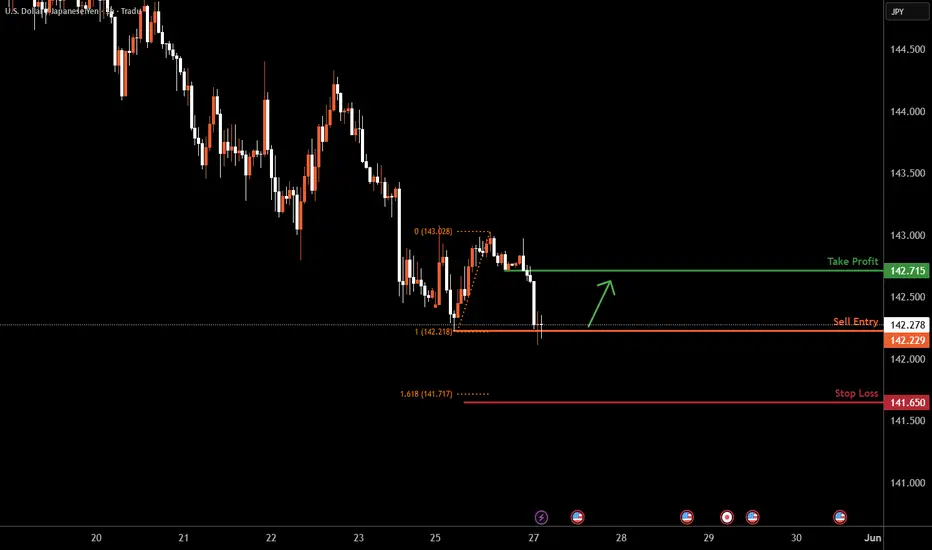
USDJPY H1 I Bullish Rise Based on the H1 chart analysis, we can see that the price has just bounced off our buy entry at 142.31. a swing low support.
Our take profit is set at 142.71, a pullback resistance.
The stop loss is placed at 141.65, below the 161.8% Fibo extension.
High Risk Investment Warning
Trading Forex/CFDs on margin carries a high level of risk and may not be suitable for all investors. Leverage can work against you.
Stratos Markets Limited (tradu.com ):
CFDs are complex instruments and come with a high risk of losing money rapidly due to leverage. 63% of retail investor accounts lose money when trading CFDs with this provider. You should consider whether you understand how CFDs work and whether you can afford to take the high risk of losing your money.
Stratos Europe Ltd (tradu.com ):
CFDs are complex instruments and come with a high risk of losing money rapidly due to leverage. 63% of retail investor accounts lose money when trading CFDs with this provider. You should consider whether you understand how CFDs work and whether you can afford to take the high risk of losing your money.
Stratos Global LLC (tradu.com ):
Losses can exceed deposits.
Please be advised that the information presented on TradingView is provided to Tradu (‘Company’, ‘we’) by a third-party provider (‘TFA Global Pte Ltd’). Please be reminded that you are solely responsible for the trading decisions on your account. There is a very high degree of risk involved in trading. Any information and/or content is intended entirely for research, educational and informational purposes only and does not constitute investment or consultation advice or investment strategy. The information is not tailored to the investment needs of any specific person and therefore does not involve a consideration of any of the investment objectives, financial situation or needs of any viewer that may receive it. Kindly also note that past performance is not a reliable indicator of future results. Actual results may differ materially from those anticipated in forward-looking or past performance statements. We assume no liability as to the accuracy or completeness of any of the information and/or content provided herein and the Company cannot be held responsible for any omission, mistake nor for any loss or damage including without limitation to any loss of profit which may arise from reliance on any information supplied by TFA Global Pte Ltd.
The speaker(s) is neither an employee, agent nor representative of Tradu and is therefore acting independently. The opinions given are their own, constitute general market commentary, and do not constitute the opinion or advice of Tradu or any form of personal or investment advice. Tradu neither endorses nor guarantees offerings of third-party speakers, nor is Tradu responsible for the content, veracity or opinions of third-party speakers, presenters or participants.
USDJPY BUYTargets @ 144.57 TP1 - 2.1bn @ 145 TP2 - Entries at Structure Breaks or 141 Area combined with Volume - FOMC provide Direction
USD/JPY Breakdown: Is 140 the Next Target? Smart Money Says Yes!USD/JPY is currently in a highly interesting technical and macro phase, characterized by divergences between price action and institutional positioning, negative seasonal signals, and retail sentiment that goes against what would typically be expected in a reversal scenario. Let’s break it down:
1. Institutional Positioning (COT Report)
The COT data reveals a mixed picture with bearish implications for USD/JPY:
On the USD side, non-commercial traders continue to increase their net long exposure (+2,044 new long contracts this week). However, this rise is almost equally offset by +1,975 new shorts, indicating indecision and hedging activity.
For the Japanese Yen, non-commercials (speculators) are significantly rebuilding long JPY positions, while commercials have started covering their short exposure.
📌 Implication: The net flow favors the Yen, meaning bearish pressure on USD/JPY. The increase in JPY long positions reflects expectations of a stronger Yen in the short to medium term.
2. Historical Seasonality
Seasonal data reinforces the bearish bias:
In May and June, USD/JPY has historically posted negative returns.
The 5-year average shows -0.57 in May and -0.76 in June, with both the 2Y and 10Y averages confirming a similar downward seasonal pattern.
📌 Implication: The current seasonal window does not favor a USD rebound vs. the Yen. Historically, the likelihood of downside increases into early summer.
3. Retail Sentiment
Retail traders are heavily long, with 64% positioned long on USD/JPY versus 36% short.
📌 Implication: From a contrarian perspective, this is a bearish signal. Markets tend to move against retail positioning, adding further downside risk.
4. Price Action & Technical Structure (Daily Chart)
On the weekly chart:
Price broke the key 144.00 support decisively, closing the week at 142.81.
Structure shows lower highs and lower lows, typical of a bearish trend.
RSI is falling but still above oversold levels, leaving room for further downside.
First demand zone: 141.50–142.20. A confirmed break could open the way to 140.00–139.80.
Key resistance on any pullback: 145.00–146.00.
📌 Implication: The confirmed break of support activated a bearish continuation setup, unless short-term bounces offer new sell opportunities near resistance.
5. Market Depth
Market depth shows a strong cluster of long orders above current levels, while short volumes appear fragmented. This suggests any short-term rally could face aggressive selling between 144.50–145.50.
🎯 Conclusion & Operational Outlook
The overall context points to a high probability of further downside in USD/JPY over the short to medium term:
Smart money is rotating toward the Yen.
Seasonal patterns historically support a drop in May–June.
Contrarian retail sentiment adds additional bearish weight.
The weekly chart confirms a break of structure, opening space below 141.50.
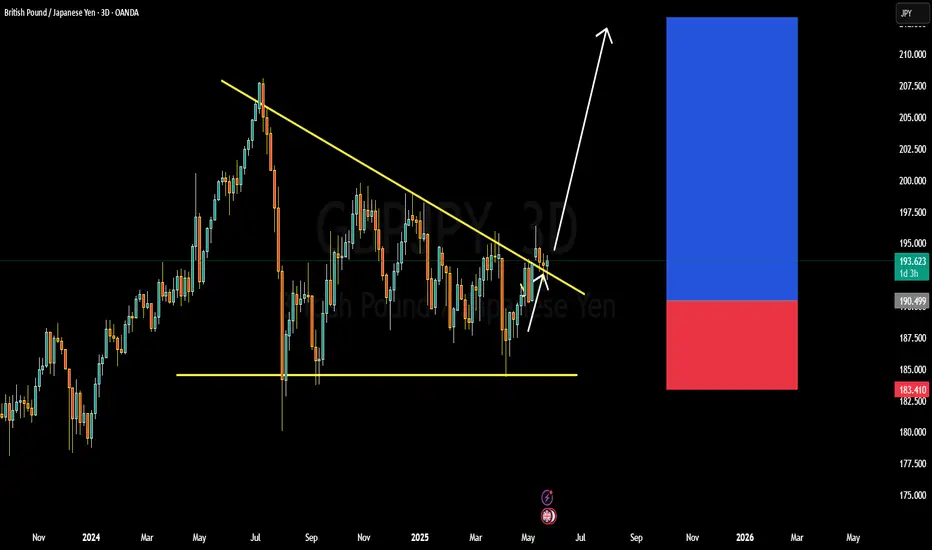
GBPJPY BULLISH OR BEARISH DETAILED ANALYSISGBPJPY has successfully broken out of a long-term descending trendline on the 3D timeframe, which had capped price action for months. The breakout is now confirmed with multiple candle closes above the trendline and a retest holding firm around 190.500. This shift in structure signals a major bullish reversal, and I’m now targeting the 199.600 level as the next potential upside objective.
From a fundamental perspective, the British pound is strengthening amid persistent inflationary pressures in the UK, which are keeping the Bank of England firmly in the hawkish camp. With CPI still elevated and wage growth remaining sticky, the BoE has little room to cut rates aggressively anytime soon. In contrast, the Bank of Japan continues to hold a dovish tone with ultra-accommodative monetary policy, offering a wide interest rate differential that favors GBP longs, especially in carry trade setups.
Technically, this setup offers a clean risk-reward profile. The breakout above the descending structure combined with a strong support zone around 190.500 gives this move a solid foundation. We’re seeing momentum build with higher highs and higher lows forming across multiple timeframes. As long as GBPJPY holds above the 190.000 zone, the bullish bias remains valid and the path toward 199.600 looks open and sustainable.
Traders should keep a close eye on short-term pullbacks as potential re-entry zones. With a macro tailwind behind GBP strength and continued JPY weakness, this pair is primed for further upside. I’m riding this bullish wave with a medium-term outlook and adjusting my position based on intraday market behavior.
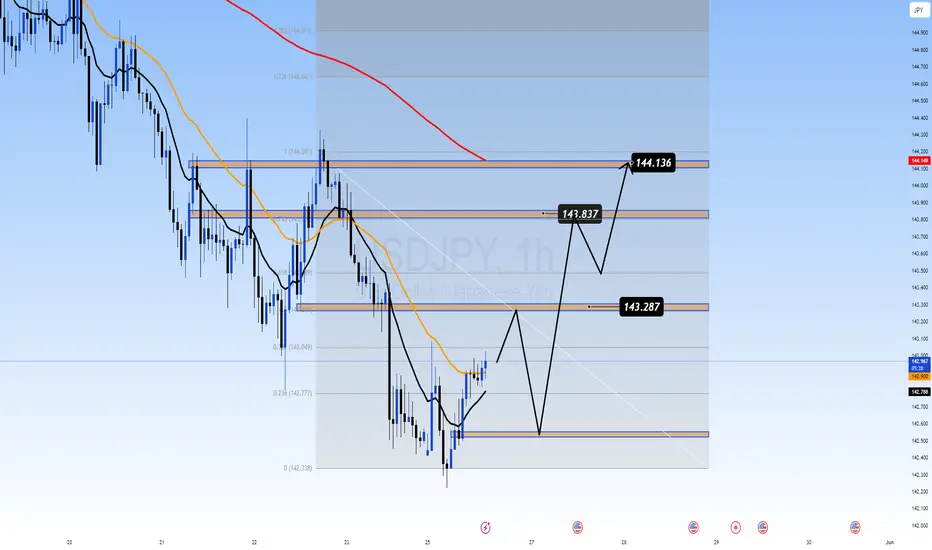
USDJPY – Diverging Policies Drive Yen into Pressure Zone near 14USDJPY – Diverging Policies Drive Yen into Pressure Zone near 144
🌍 Macro Landscape: JPY Stuck Between Two Diverging Forces
In recent weeks, the US dollar has regained strength as the Federal Reserve remains committed to its "higher-for-longer" interest rate stance. On the flip side, the Bank of Japan (BoJ) is maintaining an ultra-loose monetary policy, widening the yield spread between the USD and JPY, and putting pressure on the yen.
The surge in US 10-year yields toward 4.5% is further dampening demand for JPY as a safe haven, prompting institutional capital outflows from the yen and inflows into USD-based assets.
🏦 Central Bank Policy Divergence: Fed Remains Firm, BoJ Stays Dovish
Federal Reserve: FOMC members continue to signal patience on rate cuts. Recent inflation data (PCE, CPI) shows sticky price pressure, especially in services.
Bank of Japan: BoJ remains hesitant to normalize policy despite inflation consistently above the 2% target.
This policy divergence is reminiscent of the conditions that pushed USDJPY above 151 last year — and current dynamics hint that history may repeat.
🌐 Capital Flows: JPY Loses Safe-Haven Appeal
Global capital flow models indicate a major shift. While gold and the US dollar are once again sought-after hedges amid US-China tensions and EU fiscal risk, the Japanese yen is being overlooked.
Japan’s debt-to-GDP ratio — the highest in the G7 — forces BoJ to maintain low rates to keep the fiscal structure sustainable. As a result, JPY is no longer viewed as a reliable store of safety.
📊 Technical Structure: Momentum Building Toward 144.1
On the H1 chart:
Price bounced sharply from the 142.33 demand zone, forming a higher low.
EMA 13 – 34 – 89 show a bullish alignment ("fan-out formation") confirming short-term bullish momentum.
Resistance near 144.13–144.20 is key: a clean breakout could trigger an extended rally to 145.00+
However, this zone may also trigger profit-taking, especially if traders react to upcoming macro data.
🎯 Trade Strategy Recommendations
Scenario 1 – Buy the Pullback (Preferred):
Entry: 142.70 – 142.90
Stop-Loss: 142.30
Take-Profit: 143.80 → 144.13 → 144.60
Scenario 2 – Breakout Momentum Buy:
Entry: 144.15
Stop-Loss: 143.70
Take-Profit: 145.00 → 145.50
⚠️ Key Events to Watch:
US PCE Price Index (April): If hotter-than-expected, this would reinforce the Fed’s hawkish tone and lift USD.
BoJ Governor Speech (end of week): Any unexpected hawkish shift could trigger a short-term rebound in JPY.
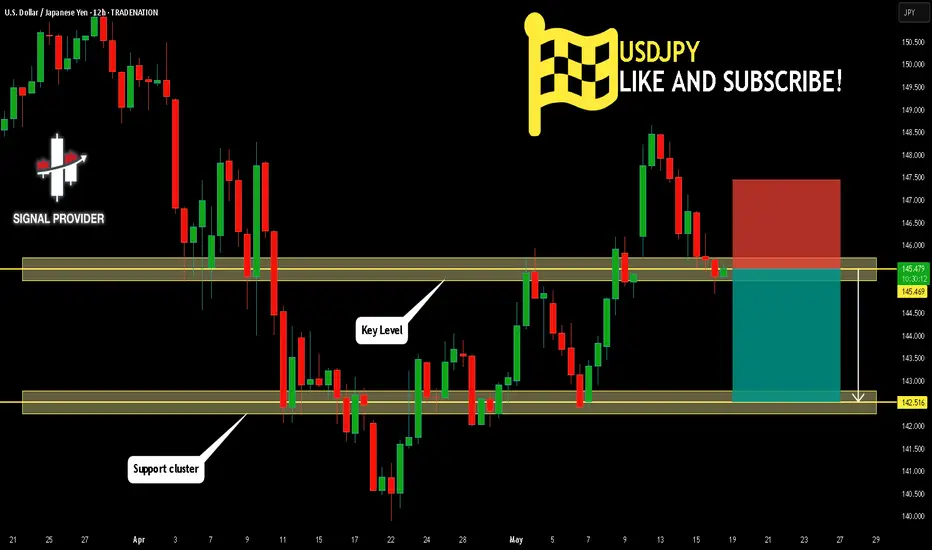
USDJPY Will Go Lower From Resistance! Sell!
Please, check our technical outlook for USDJPY.
Time Frame: 12h
Current Trend: Bearish
Sentiment: Overbought (based on 7-period RSI)
Forecast: Bearish
The market is testing a major horizontal structure 145.469.
Taking into consideration the structure & trend analysis, I believe that the market will reach 142.516 level soon.
P.S
The term oversold refers to a condition where an asset has traded lower in price and has the potential for a price bounce.
Overbought refers to market scenarios where the instrument is traded considerably higher than its fair value. Overvaluation is caused by market sentiments when there is positive news.
Disclosure: I am part of Trade Nation's Influencer program and receive a monthly fee for using their TradingView charts in my analysis.
Like and subscribe and comment my ideas if you enjoy them!
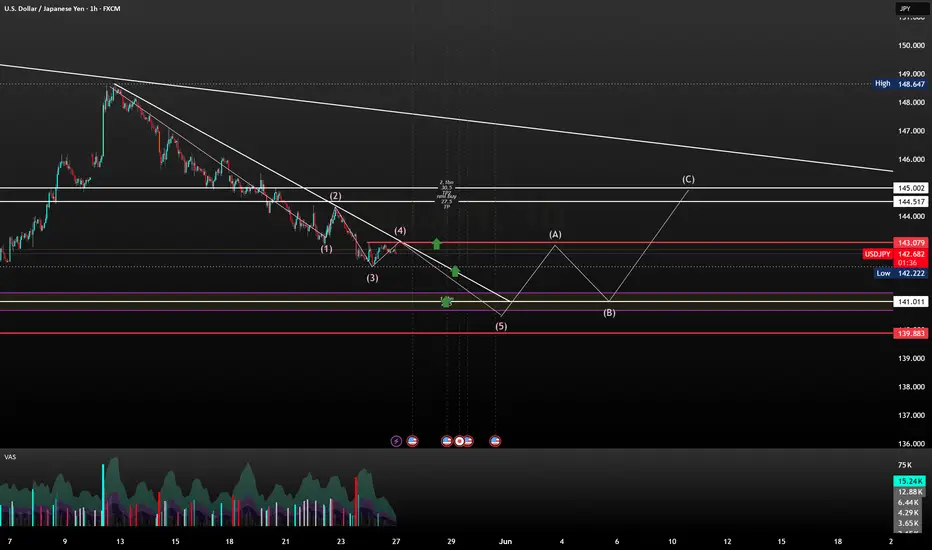
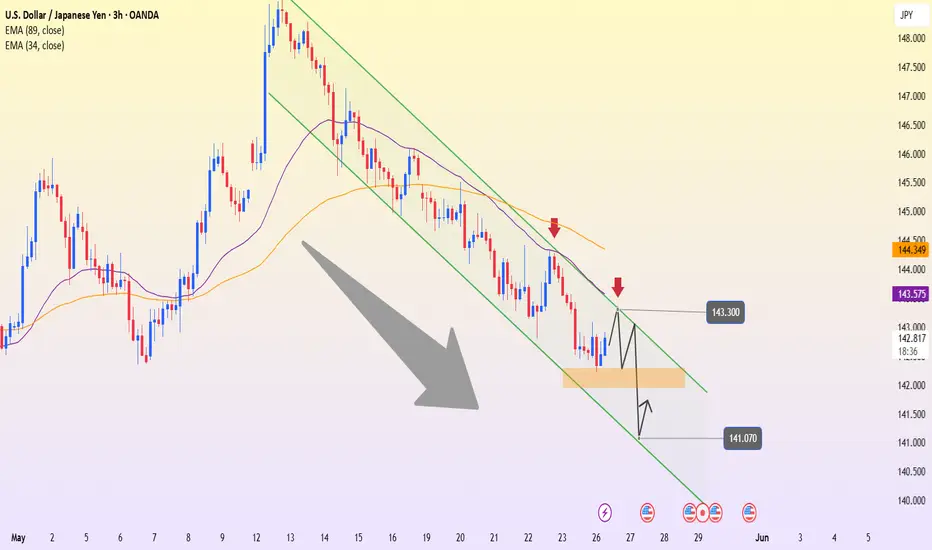
USDJPY – Bearish Channel Holds, Eyes on Support BreakUSDJPY is currently trading within a clearly defined bearish channel on the 3H timeframe, consistently forming lower highs and lower lows. After a slight bounce from the 142.50 support zone, the price is now heading toward the 143.30 resistance area — which aligns with the upper boundary of the channel. This is a zone likely to face rejection and renewed selling pressure.
On the news front, Moody’s recently downgraded the U.S. credit rating due to concerns over prolonged budget deficits, putting pressure on the USD. Although the interest rate gap between the Fed and the BoJ still favors the dollar, current market sentiment is making it harder for USDJPY to maintain a strong rally.
If the 143.30 resistance holds, the price is likely to be pushed back down to retest the 141.07 support zone — a previous low and the lower boundary of the descending channel. A confirmed break below this level would signal further downside, with the next target below the 140.00 mark.
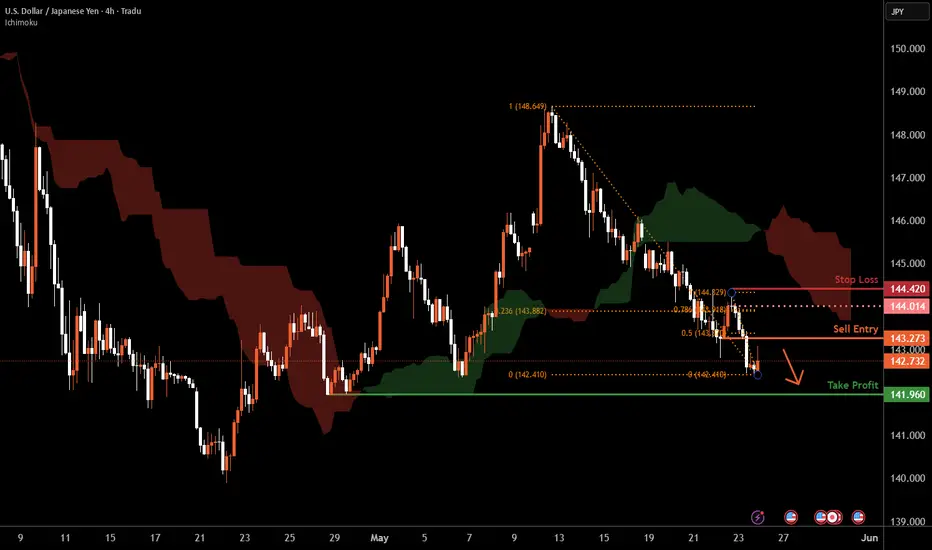
USD/JPY H4 | Overhead pressures remain?USD/JPY is rising towards a pullback resistance and could potentially reverse off this level to drop lower.
Sell entry is at 143.27 which is a pullback resistance that aligns with the 50.0% Fibonacci retracement.
Stop loss is at 144.42 which is a level that sits above the 23.6% and 78.6% Fibonacci retracements and a swing-high resistance.
Take profit is at 141.96 which is a multi-swing-low support.
High Risk Investment Warning
Trading Forex/CFDs on margin carries a high level of risk and may not be suitable for all investors. Leverage can work against you.
Stratos Markets Limited (tradu.com ):
CFDs are complex instruments and come with a high risk of losing money rapidly due to leverage. 63% of retail investor accounts lose money when trading CFDs with this provider. You should consider whether you understand how CFDs work and whether you can afford to take the high risk of losing your money.
Stratos Europe Ltd (tradu.com ):
CFDs are complex instruments and come with a high risk of losing money rapidly due to leverage. 63% of retail investor accounts lose money when trading CFDs with this provider. You should consider whether you understand how CFDs work and whether you can afford to take the high risk of losing your money.
Stratos Global LLC (tradu.com ):
Losses can exceed deposits.
Please be advised that the information presented on TradingView is provided to Tradu (‘Company’, ‘we’) by a third-party provider (‘TFA Global Pte Ltd’). Please be reminded that you are solely responsible for the trading decisions on your account. There is a very high degree of risk involved in trading. Any information and/or content is intended entirely for research, educational and informational purposes only and does not constitute investment or consultation advice or investment strategy. The information is not tailored to the investment needs of any specific person and therefore does not involve a consideration of any of the investment objectives, financial situation or needs of any viewer that may receive it. Kindly also note that past performance is not a reliable indicator of future results. Actual results may differ materially from those anticipated in forward-looking or past performance statements. We assume no liability as to the accuracy or completeness of any of the information and/or content provided herein and the Company cannot be held responsible for any omission, mistake nor for any loss or damage including without limitation to any loss of profit which may arise from reliance on any information supplied by TFA Global Pte Ltd.
The speaker(s) is neither an employee, agent nor representative of Tradu and is therefore acting independently. The opinions given are their own, constitute general market commentary, and do not constitute the opinion or advice of Tradu or any form of personal or investment advice. Tradu neither endorses nor guarantees offerings of third-party speakers, nor is Tradu responsible for the content, veracity or opinions of third-party speakers, presenters or participants.
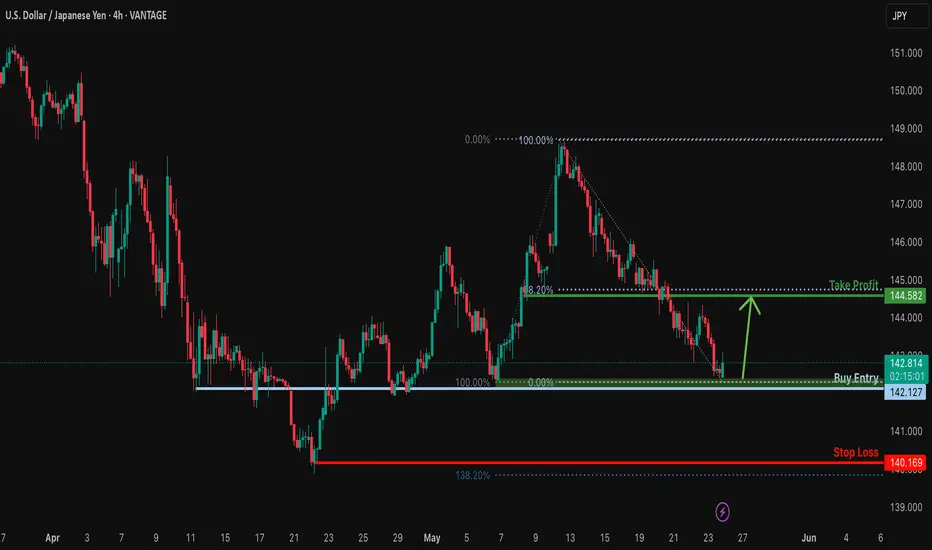
Bullish bounce off overlap support?USD/JPY is falling towards the support level which is an overlap support and could bounce from this level to our take profit.
Entry: 142.12
Why we like it:
There is an overlap support level.
Stop loss: 140.16
Why we like it:
There is a pullback support level that is slightly above the 145% Fibonacci extension.
Take profit: 144.58
Why we lik eit:
There is a pullback resistance that aligns with the 38.2% Fibonacci retracement.
Enjoying your TradingView experience? Review us!
Please be advised that the information presented on TradingView is provided to Vantage (‘Vantage Global Limited’, ‘we’) by a third-party provider (‘Everest Fortune Group’). Please be reminded that you are solely responsible for the trading decisions on your account. There is a very high degree of risk involved in trading. Any information and/or content is intended entirely for research, educational and informational purposes only and does not constitute investment or consultation advice or investment strategy. The information is not tailored to the investment needs of any specific person and therefore does not involve a consideration of any of the investment objectives, financial situation or needs of any viewer that may receive it. Kindly also note that past performance is not a reliable indicator of future results. Actual results may differ materially from those anticipated in forward-looking or past performance statements. We assume no liability as to the accuracy or completeness of any of the information and/or content provided herein and the Company cannot be held responsible for any omission, mistake nor for any loss or damage including without limitation to any loss of profit which may arise from reliance on any information supplied by Everest Fortune Group.
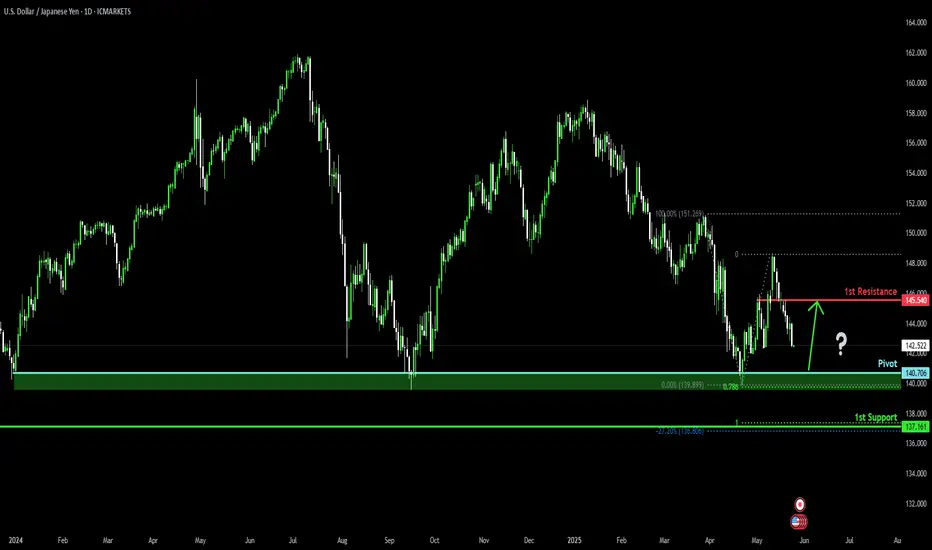
Falling towards pullback support?USD/JPY is falling towards the pivot which is a pullback support and could bounce to the 1st resistance which acts as a pullback resistance.
Pivot: 140.70
1st Support: 137.16
1st Resistance: 145.54
Risk Warning:
Trading Forex and CFDs carries a high level of risk to your capital and you should only trade with money you can afford to lose. Trading Forex and CFDs may not be suitable for all investors, so please ensure that you fully understand the risks involved and seek independent advice if necessary.
Disclaimer:
The above opinions given constitute general market commentary, and do not constitute the opinion or advice of IC Markets or any form of personal or investment advice.
Any opinions, news, research, analyses, prices, other information, or links to third-party sites contained on this website are provided on an "as-is" basis, are intended only to be informative, is not an advice nor a recommendation, nor research, or a record of our trading prices, or an offer of, or solicitation for a transaction in any financial instrument and thus should not be treated as such. The information provided does not involve any specific investment objectives, financial situation and needs of any specific person who may receive it. Please be aware, that past performance is not a reliable indicator of future performance and/or results. Past Performance or Forward-looking scenarios based upon the reasonable beliefs of the third-party provider are not a guarantee of future performance. Actual results may differ materially from those anticipated in forward-looking or past performance statements. IC Markets makes no representation or warranty and assumes no liability as to the accuracy or completeness of the information provided, nor any loss arising from any investment based on a recommendation, forecast or any information supplied by any third-party.
WHO LOVES A STRONG JPY ( YEN )BASKET FORECAST Q2 W22 Y25WHO LOVES A STRONG JPY ( YEN )BASKET FORECAST Q2 W22 Y25
Professional Risk Managers👋
Welcome back to another FRGNT chart update📈
Diving into some Forex setups using predominantly higher time frame order blocks alongside confirmation breaks of structure.
Let’s see what price action is telling us today!
✅The JPY Basket tracks the overall strength of the JPY against a weighted average of other currencies.
✅It can be used as an indicator of YEN strength which can be a tool for analysing and potentially hedging for or against the Index.
✅ Pairs to watch - GBPJPY, USDJPY EURJPY, CADJPY, AUDJPY
🔑 Remember, to participate in trading comes always with a degree of risk, therefore as professional risk managers it remains vital that we stick to our risk management plan as well as our trading strategies.
📈The rest, we leave to the balance of probabilities.
💡Fail to plan. Plan to fail.
🏆It has always been that simple.
❤️Good luck with your trading journey, I shall see you at the very top.
🎯Trade consistent, FRGNT X

USD/JPY Breakdown Incoming? 4 Powerful Signals Say 'Short Now'! The current landscape for USD/JPY signals a potential bearish reversal, supported by a convergence of technical, sentiment, and fundamental factors. Following a strong bullish leg from the 140 zone, price has reached the 146–147 resistance area, where it is currently being rejected. Price action has broken below the ascending channel that began in early April, suggesting a loss of bullish momentum and a possible transition into a deeper corrective phase.
From the COT (Commitment of Traders) perspective, the picture aligns with this bias. Non-commercials on the USD Index (DXY) are aggressively reducing exposure on both long and short sides, resulting in a net position of -615 contracts. This reflects growing uncertainty or waning confidence in dollar strength as U.S. monetary policy enters a potential pivot zone. Meanwhile, JPY futures still show a strong net long position by speculators (194,226 long vs. 21,958 short), even after a significant long liquidation of over 9,700 contracts. Commercial traders, typically positioned opposite to trend, remain heavily net short—hinting at possible strength ahead for the yen.
Seasonality adds further weight: May is historically a bearish month for USD/JPY. The 5, 10, and 15-year averages all show negative returns, with a structural downside tendency, especially in the final two weeks of the month.
Retail sentiment further supports this case. Data shows that 68% of retail traders are currently long USD/JPY. Interpreting this through a contrarian lens, it implies growing downside potential, as over-positioned retail traders often precede a move in the opposite direction.
Lastly, technical analysis (daily timeframe) reinforces the bearish scenario. The break below the bullish channel invalidates the recent structure, and the RSI is trending lower with plenty of room to move down before hitting oversold levels. Immediate support zones lie between 143 and 141. A potential retest of 145.80–146.30 would offer a favorable entry for fresh shorts in line with a developing bearish swing structure.
🎯 Conclusion
All elements—technical structure, COT data, seasonal weakness, and retail sentiment—are converging toward a bearish USD/JPY outlook. Institutional traders are cutting dollar longs, seasonal forces are negative, and retail positioning is overly long. With price structure now broken, the bearish bias is well supported, targeting 143 first and 141 as a deeper move, pending price action confirmation.

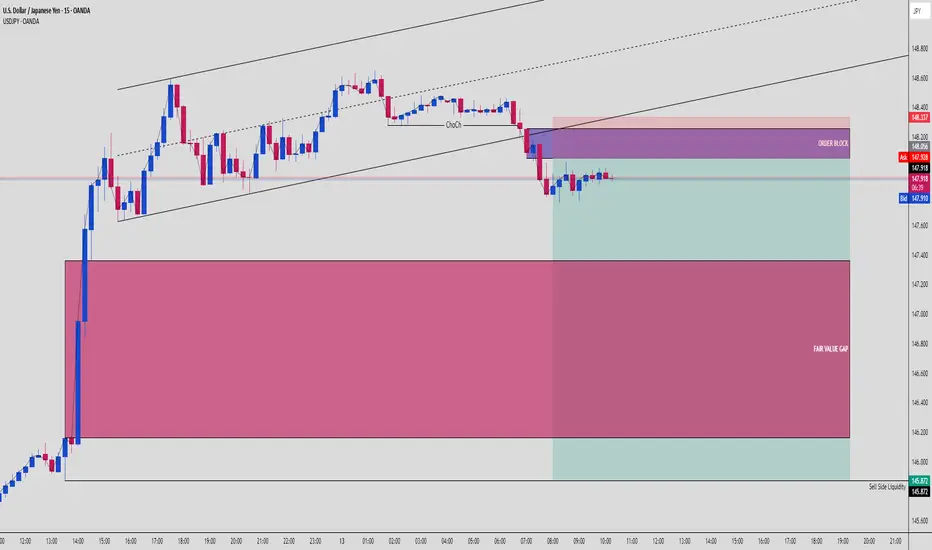
USDJPY Just Flipped — Liquidity Has a New Target🧠 Smart Money Breakdown: USDJPY | 15-Min Chart
We’ve got a textbook bearish reversal setup forming right now on USDJPY, and Smart Money traders are paying close attention.
🔄 1. Change of Character (ChoCh)
The first key sign was a ChoCh, which flipped the internal structure from bullish to bearish. This signals a potential shift in market control from buyers to sellers — Smart Money often initiates big moves after such a flip.
🟫 2. Bearish Order Block + Rejection Wick
Price pulled back right into a fresh bearish Order Block (OB) around the 148.056–148.337 zone. This OB lines up perfectly with the upper trendline + internal liquidity area.
Price is now rejecting hard from this level, signaling Smart Money sell-side pressure.
🕳 3. Fair Value Gap (FVG) Below
Below current price lies a clean FVG, serving as a magnet for price. Smart Money often targets these imbalances to rebalance the market.
The gap extends from around 146.200 to 147.400 — with Sell Side Liquidity resting right below at 145.872. That’s the likely kill zone. 💀
📐 4. Trade Setup (R:R Approx. 3.5:1)
🔼 Entry Zone: 147.980–148.050 (inside OB)
❌ Stop Loss: Just above OB: 148.400
✅ Target: 145.872 (Sell Side Liquidity sweep)
Perfect for swing traders and intraday SMC setups.
📊 Strategy:
Look for:
Bearish engulfing candle confirmation
Break of minor internal low (lower TF BOS)
Entry on OB rejection with tight SL above high
Bonus: Enter partials on FVG fill, hold runner to liquidity.
📎 Confluences:
✅ ChoCh confirmed
✅ Bearish OB
✅ Price rejecting from premium zone
✅ FVG below = imbalance magnet
✅ Sell-side liquidity clearly marked
⚠️ Risk Reminder:
Let price show intent before jumping in
Use confirmation, not assumption
Trade what the chart says, not what you hope
🔚 Summary:
Smart Money has flipped the script. With a strong ChoCh, OB rejection, and an FVG inviting price lower, this setup screams bearish continuation.
🔻 Expecting a clean run into liquidity. Stay sharp. 🧠
💬 Drop a “💀” if you’re eyeing the same setup.
📈 Follow for more clean SMC plays weekly.
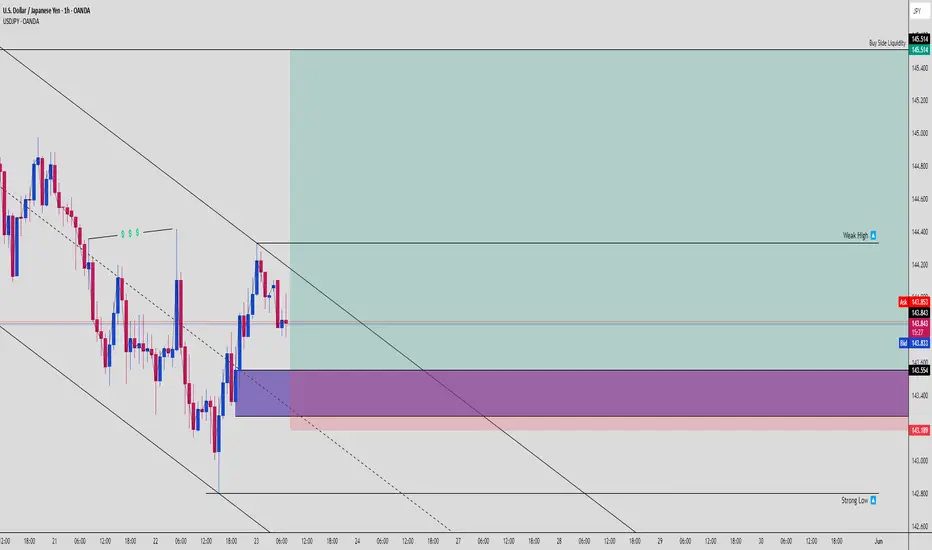
USDJPY: Smart Money Reloads at Demand ZoneThis pair is showing some next-level institutional behavior right now, and the play is looking ripe for a long position — here's why:
📉 Previous Sell-Off = Liquidity Engineering
USDJPY had a strong downward leg creating a perfect internal liquidity pool, then took out that internal high (marked by triple liquidity tags 💵💵💵) just above a descending channel. That was your classic fakeout / inducement trap.
🎯 Price Tapped Into a Fresh Bullish Order Block
Price dipped deep into a refined OB (purple zone) aligned with the lower channel and then wicked hard out of it. That move created a bullish rejection wick, confirming buyer interest from smart money.
You can see price forming a micro HL structure at the edge of the demand zone — premium setup for continuation.
📍 Key Confluences:
✅ OB sits right around the mid-channel EQ
✅ Demand zone is built on top of a strong low (142.680 area)
✅ Strong risk-to-reward setup aiming for weak high and buy-side liquidity
✅ Rejection aligns with a bullish change of character (ChoCh) from lower timeframes
💥 Targets:
🔹 TP1 - Weak High at 144.400
🔹 TP2 - Buy Side Liquidity sweep at 145.514
🔹 Extended Target - Ride it to channel top / HTF imbalance fill above 146.000
📈 Trade Idea Summary:
Entry Zone: Anywhere in the OB range from 143.554 to 143.189
Stop Loss: Below 143.000 or the strong low
Risk-Reward: Easily 1:5+ if targeting full range move
🚨 Why It Matters:
This chart screams smart money accumulation at the bottom of a channel. Retail traders might still be shorting the retracement — but smart money is loading longs while price consolidates at demand.
If price clears the weak high, it could ignite a bullish rally into the upper supply zones where liquidity lies.
💬 Comment "UJ MOVE" if you're entering this sniper long!
🔁 Repost this if you’re tracking it with your team!