USDJPY Analysis todayHello traders, this is a complete multiple timeframe analysis of this pair. We see could find significant trading opportunities as per analysis upon price action confirmation we may take this trade. Smash the like button if you find value in this analysis and drop a comment if you have any questions or let me know which pair to cover in my next analysis.
Usdjpyanalysis

USD/JPY Trapped in Consolidation QuagmireDuring the European session, the USD/JPY exchange rate oscillated around 143.10, extending the consolidation pattern triggered by the weak US dollar overnight. Influenced by the worse-than-expected US May ADP and ISM services data, the US Dollar Index fell to a six-week low of 98.60, and the USD/JPY rate also hit a low of 142.53. Subsequently, it rebounded slightly supported by the stable results of Japan's 30-year government bond auction and the decline in yields. Currently, the market is widely focused on the upcoming US May Non-Farm Payrolls (NFP) report and is reassessing the path of the Federal Reserve's monetary policy outlook.
Humans need to breathe, and perfect trading is like breathing—maintaining flexibility without needing to trade every market swing. The secret to profitable trading lies in implementing simple rules: repeating simple tasks consistently and enforcing them strictly over the long term.
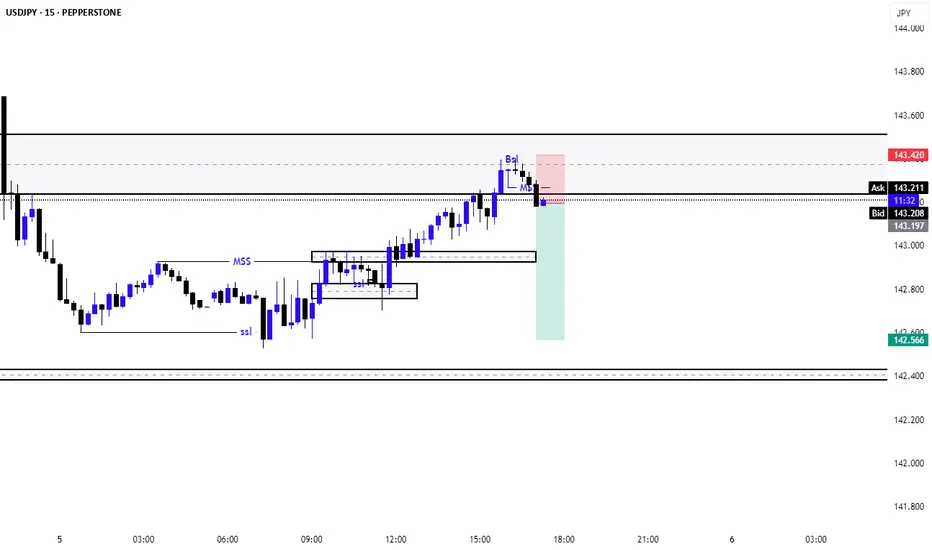
USDJPY sellPEPPERSTONE:USDJPY 15m chart price reached to FVG level. As bias already on sell side im looking for sell from here.
Senario
1. trend bias sell
2. 15m price reached previous FVG level
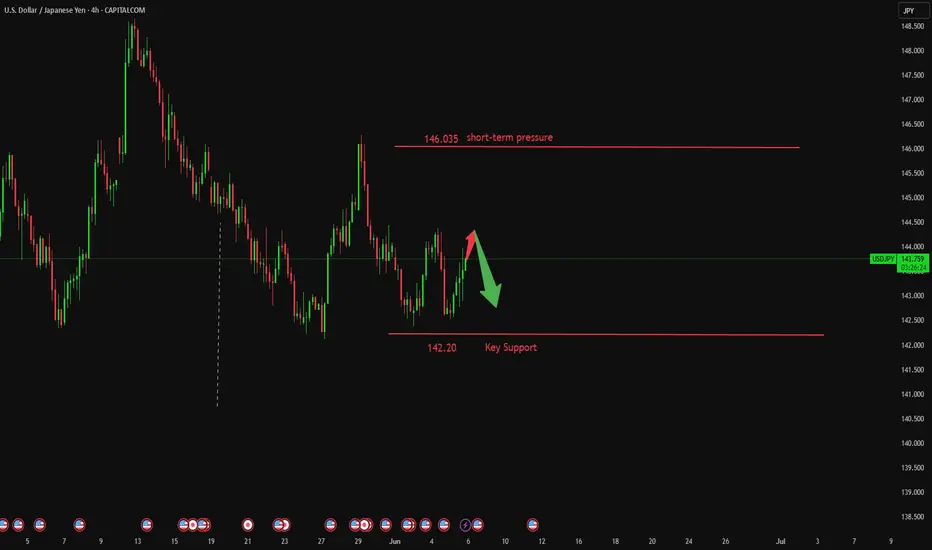
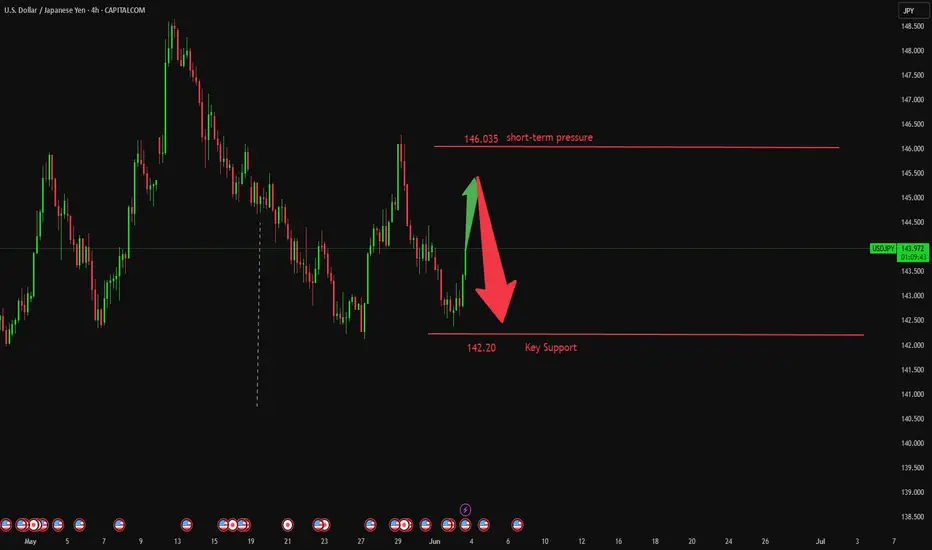
USD/JPY Analysis: Bears Put Pressure on Key SupportUSD/JPY Analysis: Bears Put Pressure on Key Support
As shown on the USD/JPY chart, the pair is hovering near key support at ¥142.50 per US dollar.
While demand was strong enough at the end of May to lift the exchange rate from this level to a peak around ¥146.00, USD/JPY has once again retreated to the ¥142.50 area.
Why has USD/JPY declined?
On one hand, the US dollar has weakened following disappointing economic data released yesterday. The figures revealed a sharp slowdown in private sector hiring and an unexpected contraction in the US services sector, fuelling concerns over a possible recession.
On the other hand, yen strength is being driven by the Bank of Japan's apparent willingness to raise interest rates — reaffirmed on Tuesday by Governor Kazuo Ueda — which has reinforced expectations of a tightening cycle.
USD/JPY Technical Analysis
In early June, the ¥142.50 level had already shown its role as support (as indicated by the arrow), but it is once again under pressure — a sign of bearish dominance.
Yesterday, sellers broke through local support at ¥143.57, which may now act as resistance.
More US economic data is due on Friday, with key labour market figures set to be released at 15:30 GMT+3. These could potentially trigger a bearish attempt to break below the ¥142.50 level on the USD/JPY chart.
This article represents the opinion of the Companies operating under the FXOpen brand only. It is not to be construed as an offer, solicitation, or recommendation with respect to products and services provided by the Companies operating under the FXOpen brand, nor is it to be considered financial advice.
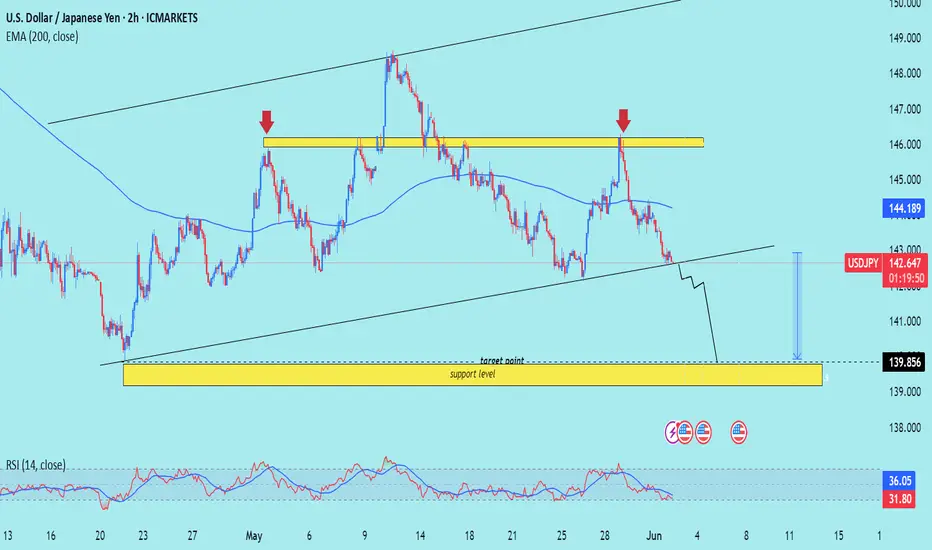
USD/JPY) breakout bearish trand analysis Read The captionSMC trading point update
Technical analysis of the USD/JPY (US Dollar / Japanese Yen) pair on a 2-hour timeframe. Here's the idea behind the analysis:
---
Overall Idea: Bearish Move Toward Support
---
Key Levels
Resistance Zone (Yellow Box, Top): Marked with two red arrows — shows strong price rejection around 146.00–147.00 area.
Support Zone (Yellow Box, Bottom): Around 139.85, marked as a target point and support level.
These two zones form the range in which price has been reacting.
---
Current Price Action
Price is currently trading at 142.649, well below the 200 EMA (at 144.190), which is a bearish signal.
It has broken below the mid-range and seems to be heading toward the lower support zone (139.85).
---
Trend & Structure
The price is following a downward trend after rejecting from the resistance zone.
The channel suggests a further leg down is likely to complete a measured move.
A temporary retest of the broken trendline might occur before continuation down.
---
RSI (Relative Strength Index)
Currently around 31.83, nearing oversold territory, indicating the potential for:
A short-term bounce before further downside, or
A reversal near the key support zone.
---
Projection
The projection arrow (blue) suggests a bullish rebound from the 139.85 support zone.
This aligns with a potential buy opportunity once support is confirmed.
Mr SMC Trading point
---
Conclusion (Trade Idea Summary)
Short-Term Bias: Bearish
Medium-Term Setup: Look for a buy opportunity around 139.85, if price reacts well.
Key Steps:
1. Watch for price to reach 139.85.
2. Look for bullish reversal patterns or confirmations at that level (e.g., bullish engulfing, RSI divergence).
3. If confirmed, a potential long trade could target back toward the 144–145 zone.
Please Support boost this analysis )
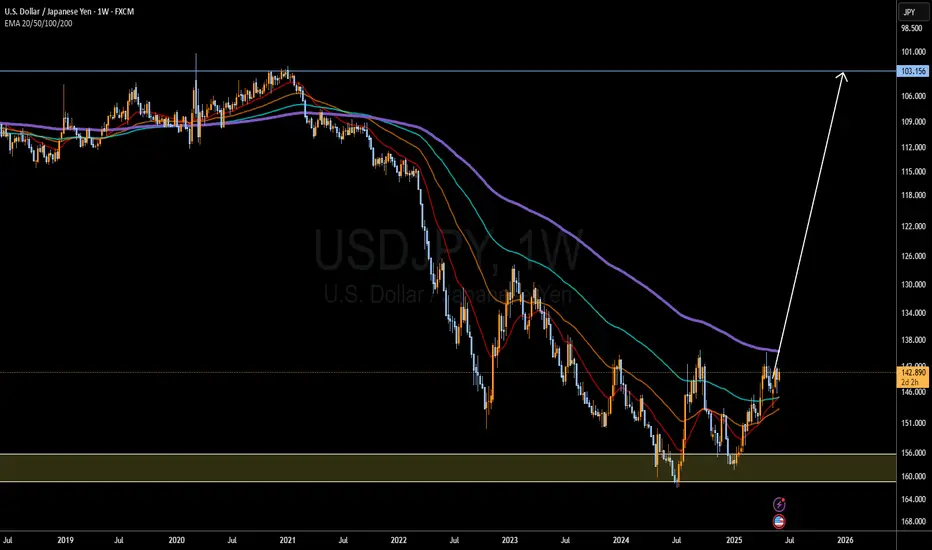
Japanese Yen to Da Moon!I compared the yen to every single currency pair and USDJPY is the most volatile. BOJ will raise interest rates to 0.75%-1% by late 2025/early 2026. And IF the FED chooses to lower rates that will further exacerbate Yen strength.
103.156 TP, but TBH I see price breaking well past that point and yen will make new all time highs. The dollar will get desecrated across all currencies, the yen will destroy it the hardest. Most likely BTC will also peak around this same time period and youll see and end to the bull cycle and we will enter BTC bear cycle but that is beside the point.
Potential Black Swan Event: the US enters into a recessionary environment, while I dont think this is likely bc everyone is saying that, it will be possible if we see a further escalation in the Ukraine conflict or if the US chooses to enter war with Iran. War is the only situation I see potential US recession.
I predicted then yen would get dusted during COVID, now I predict yen will make never seen before gains for the next 5 years minimum. Let's see how this plays out.
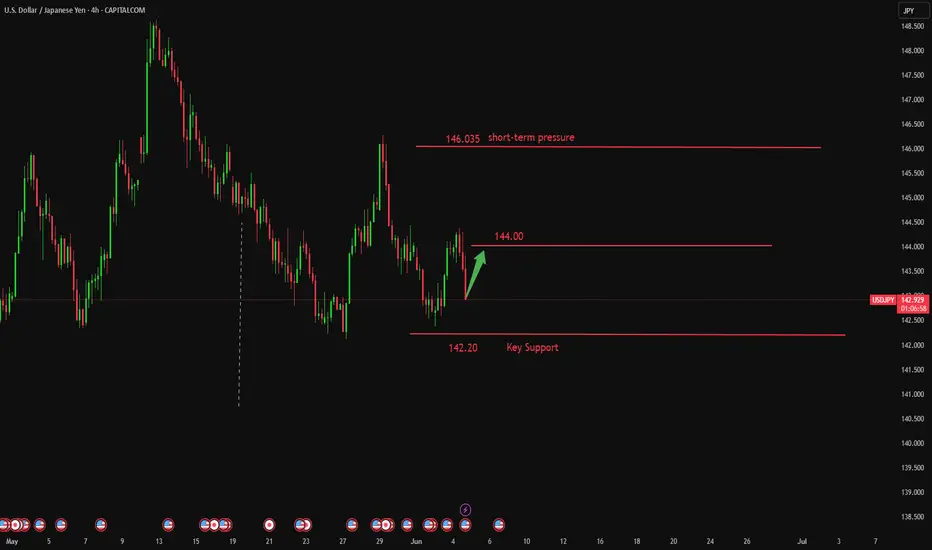
Is the 144 level becoming a key battleground for positioning?The USD/JPY exchange rate has staged a mild rebound for the second consecutive day, though it remained capped below the 144.00 level during the European session. Despite short-term signs of stabilization, the pair remains broadly pressured by a dual combination of fundamental expectations and technical resistance. Persistently constrained by selling pressure above 144.00 and failing to achieve a volume-supported breakout, the exchange rate is expected to continue trading within a range-bound consolidation between 142.00 and 144.80. Focus remains on the multi-empty battles in the 143.40 and 142.30 zones.
Humans need to breathe, and perfect trading is like breathing—maintaining flexibility without needing to trade every market swing. The secret to profitable trading lies in implementing simple rules: repeating simple tasks consistently and enforcing them strictly over the long term.
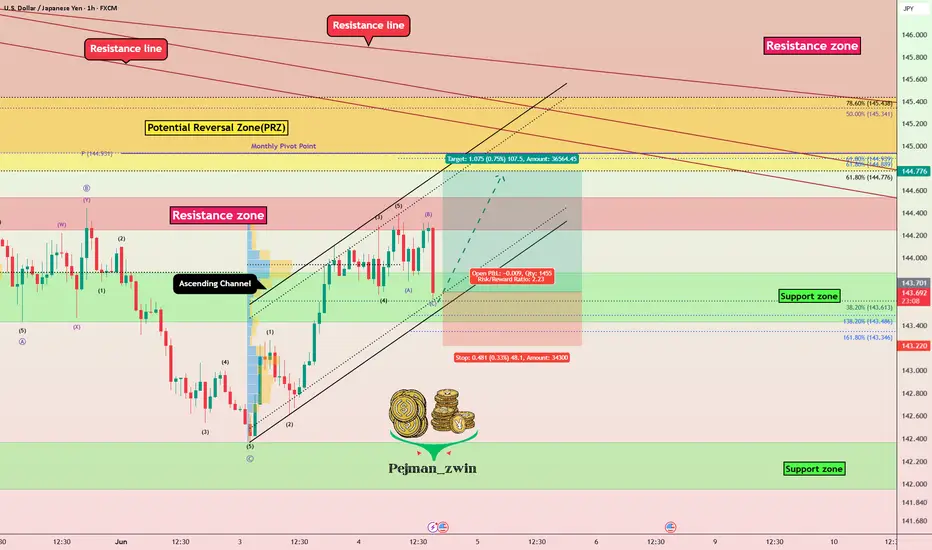
USDJPY Tests Channel Support After ADP Shock — Rebound Ahead?In the last hour's candle after the ADP Non-Farm Employment Change Index was released, USDJPY ( FX:USDJPY ) started to fall, but considering the position of this pair, I think we can have a good Risk-To-Reward even if the Stop Loss (SL) is touched.
USDJPY is trading near the lower line of the ascending channel and the Support zone(143.870 JPY-143.430 JPY) .
From an Elliott Wave perspective , USDJPY appears to be completing a corrective pattern .
I expect USDJPY to rise at least to the Potential Reversal Zone(PRZ) .
Note: Stop Loss = 143.220 JPY
Please respect each other's ideas and express them politely if you agree or disagree.
U.S. Dollar/Japanese Yen Analyze (USDJPY), 1-hour time frame.
Be sure to follow the updated ideas.
Do not forget to put a Stop loss for your positions (For every position you want to open).
Please follow your strategy and updates; this is just my Idea, and I will gladly see your ideas in this post.
Please do not forget the ✅' like '✅ button 🙏😊 & Share it with your friends; thanks, and Trade safe.
USDJPY M15 Support & Resistance Levels🚀 Here are some key zones I've identified on the 15m timeframe.
These zones are based on real-time data analysis performed by a custom software I personally developed.
The tool is designed to scan the market continuously and highlight potential areas of interest based on price action behavior and volume dynamics.
Your feedback is welcome!

usdjpy 1 hour BUYPEPPERSTONE:USDJPY As we can see on 1 hour chart price came to another level. And after some consolidation price rejected from level. I'm looking for sell from this level and probably price push down.

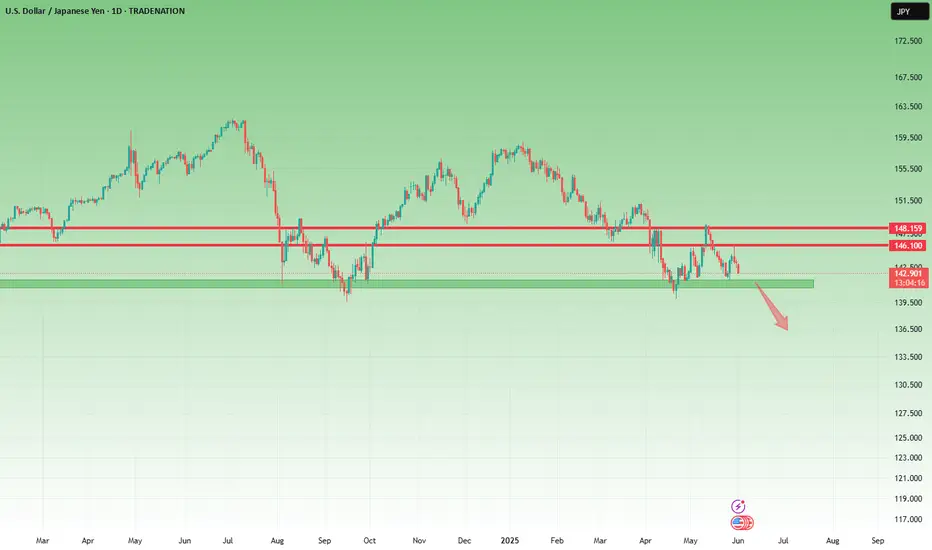
UsdJpy could break 142 and fall 500 pipsSince early May, I’ve been highlighting the 142 support zone on USDJPY as a potential reversal area — with a suggested upside target at 146.
The market respected this level twice, reversing from 142 and rallying past 146 both times.
However, last week’s move into 146 was sharply rejected, forming a strong daily Pin Bar exactly at resistance — a classic sign of exhaustion.
Now, price is rolling back toward support, and after multiple tests of the 142 zone, we may be very close to a downside break.
🧩 Add to this the fact that DXY also looks ready to break lower, and the probability of a USDJPY fall increases even more.
📉 Trading Plan:
Sell rallies, with invalidation above 146, and a target at 137, aiming for a 1:2 risk-reward setup.
Disclosure: I am part of TradeNation's Influencer program and receive a monthly fee for using their TradingView charts in my analyses and educational articles.
Prices are testing the 142.55 support level.Bank of Japan (BOJ) Governor Kazuo Ueda stated on Tuesday that the central bank would raise interest rates if the economy re-accelerates, adding that wage growth must regain momentum. Currently, Trump's tariff policies have dimmed the economic outlook, making it potentially not the optimal time for a rate hike. However, policymakers stand ready to raise rates if the economy rebounds after a brief pullback. The remarks bolstered the Japanese yen, with prices now testing the 142.55 support level. A decisive break below this level would form a lower low, confirming the continuation of the downtrend and shifting bearish targets toward the 140.01 support level.
Humans need to breathe, and perfect trading is like breathing—maintaining flexibility without needing to trade every market swing. The secret to profitable trading lies in implementing simple rules: repeating simple tasks consistently and enforcing them strictly over the long term.
Trading Strategy:
sell@144.50-145.00
TP:143.00-142.50
USD/JPY M15 Support & Resistance Levels🚀 Here are some key zones I've identified on the 15m timeframe.
These zones are based on real-time data analysis performed by a custom software I personally developed.
The tool is designed to scan the market continuously and highlight potential areas of interest based on price action behavior and volume dynamics.
Your feedback is welcome!

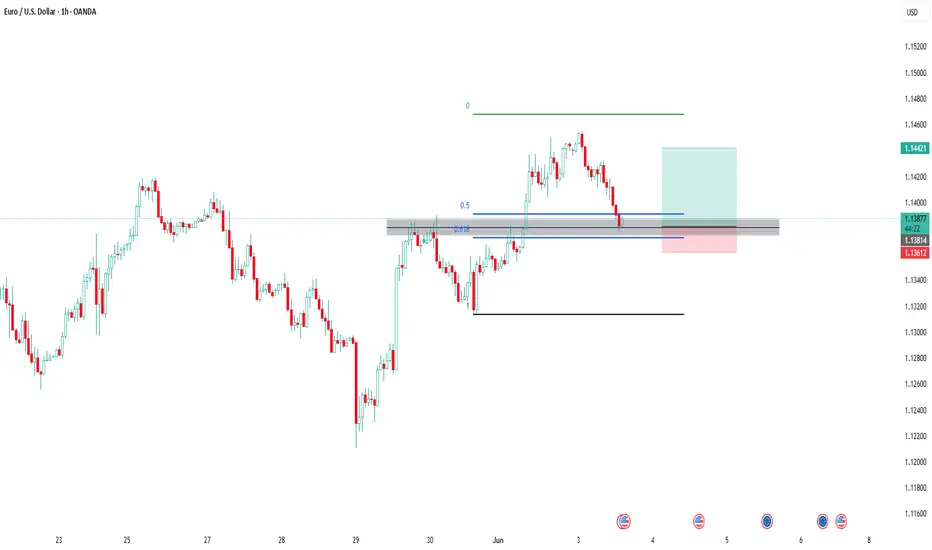
EUR USD Trade Setup 1 hour timeframe EUR USD Trade Setup 1 hour timeframe
EUR USD has formed a Bullish Break and Retest pattern on the 1 hour timeframe and the price is currently at the retest level.
USDJPY Analysis todayHello traders, this is a complete multiple timeframe analysis of this pair. We see could find significant trading opportunities as per analysis upon price action confirmation we may take this trade. Smash the like button if you find value in this analysis and drop a comment if you have any questions or let me know which pair to cover in my next analysis.

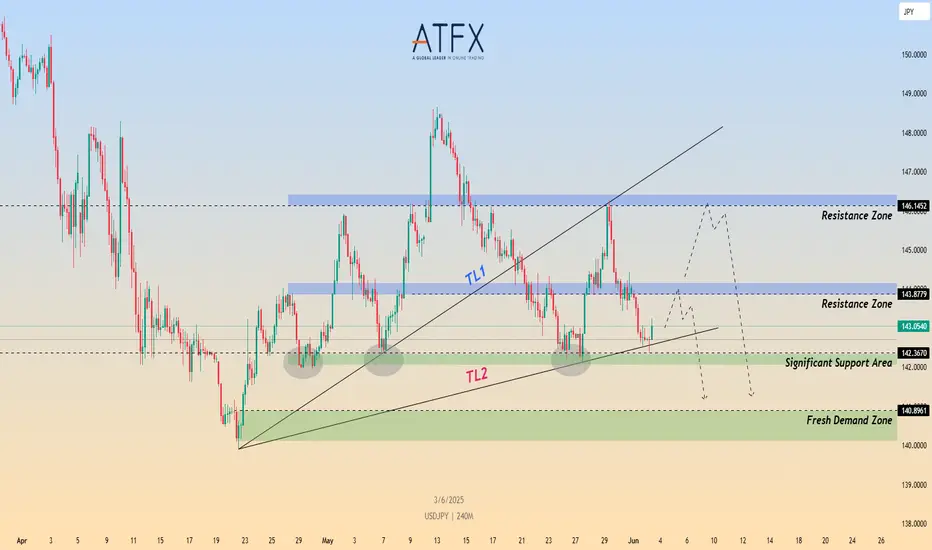
Risk, Rates, and Reversals: What’s Next for USD/JPY?CMCMARKETS:USDJPY FX:USDJPY USD/JPY rebounded slightly to 143.10 but remains under pressure after slipping from the 144.50 on BoJ-Fed divergence and rising geopolitical tensions. While the BoJ appears cautious about accelerating its balance sheet tapering beyond FY2026, it still signals further rate hikes amid persistent domestic inflation, offering the yen structural support.
Technically, price is reacting off the lower trendline TL2, aligned with the 142.30–142.40 significant support zone. This area has held multiple times in the past and may offer a bullish pullback toward the 143.80 or even 146.15 resistance zones. However, failure to break above these levels could expose USD/JPY to renewed downside toward the 140.89 demand base.
Short-term recovery depends on Friday’s NFP and risk sentiment around trade tensions. A break below 142.30 would invalidate the bullish rebound and open downside to support near 140.89.
Resistance : 143.87 , 146.14
Support : 142.36 , 140.89
Short I opened a short position yesterday at the price of 147.50.
Currently the price is 146.18. The price has dropped quite a bit but I think it still has a good short entry opportunity with a reasonable risk reward.
Reasons for short trade:
The price has reached the major support level around 149 on the 22nd April. Since then, the price has moved up to the fair value gap area between 149.2 and 148.2 (blue rectangular box), and also the order block.
That area is also the Fib 0786 area. I look at Fib 0.786 as the last line of defence and it is usually a hard line to break.
The price hit the area and started to move to the downside. Momentum indicators are still in the bull territory but the lines have crossed and clearly moving to the downside.
My macro bias for USD is bearish and the current price set up support my bias. The risk reward is good enough for me to enter.
My trade set up:
Entry: 147.51Stop: 148.95Target: 142.478 (Fib 0.236)
Risk:Reward= 1:3.5
Currently the price is 146.17. It just broked below Fib 0.618. Entry now can give you 1:1.5 risk reward.
USDJPY I Trading Plan and Forecast Welcome back! Let me know your thoughts in the comments!
** USDJPY Analysis - Listen to video!
We recommend that you keep this pair on your watchlist and enter when the entry criteria of your strategy is met.
Please support this idea with a LIKE and COMMENT if you find it useful and Click "Follow" on our profile if you'd like these trade ideas delivered straight to your email in the future.
Thanks for your continued support!Welcome back! Let me know your thoughts in the comments!

A rebound is inevitable. Execute!During the European session, the USD/JPY price trended lower overall, with prices gradually declining from higher levels, indicating that bearish forces remained dominant. The pair started its downward movement from near 144.049 and continued to move lower. Notably, the USD/JPY exchange rate faced resistance at the 146.00 psychological level and is currently moving toward the support zone at 142.35. If prices reach this area, buyers are expected to enter the market after setting clear risk parameters below the support level, preparing for a potential rebound toward the 148.00 resistance level. On the flip side, sellers will look for prices to break below this level to increase bearish bets, with a further downside target set at the 140.00 threshold.
Humans need to breathe, and perfect trading is like breathing—maintaining flexibility without needing to trade every market swing. The secret to profitable trading lies in implementing simple rules: repeating simple tasks consistently and enforcing them strictly over the long term.
Trading Strategy:
buy@142.20-142.50
TP:145.50-146.00

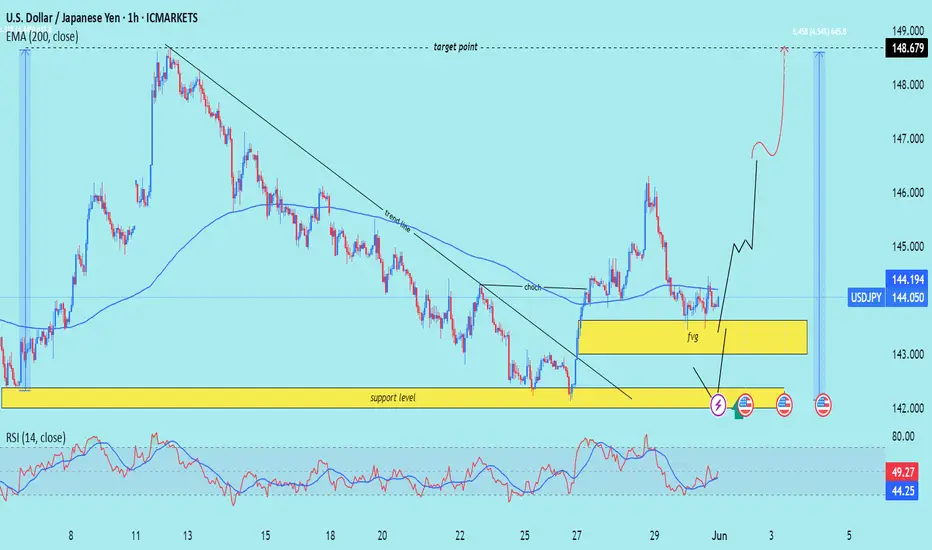
USD/JPY) bullish choch Analysis Read The ChaptianSMC trading point update
Technical analysis of USD/JPY presents a bullish outlook with Smart Money Concepts (SMC)-based logic. Here's a breakdown of the idea and key elements:
---
Chart Summary
Current Market Context
Price: ~144.05
EMA 200: Acting as dynamic resistance at 144.19
Trendline: Broken, signaling a potential shift in market structure
Change of Character (ChoCh): Confirmed around 143.3, marking a bullish transition
---
Key Zones Identified
1. Support Level (Strong Demand Zone)
Around 141.8–142.5
Marked by historical rejections
Possible mitigation of unfilled orders here
2. Fair Value Gap (FVG)
Between 143.0–143.8
Price may return to fill this imbalance before rising
---
Projected Move
Price is expected to:
1. Dip into the FVG or Support Zone to mitigate imbalance
2. Reverse and make a bullish rally
3. Reach the target point near 148.68 (approx. +4.55%)
---
RSI Analysis (14-period)
Current RSI: ~49 (neutral)
No overbought/oversold condition
Room for upside momentum
---
Notable Features
Break of structure (ChoCh) → Bullish signal
EMA crossover potential → Bullish confluence
Multiple FVG fills + support reaction → Entry confirmation opportunities
Economic events marked → Be cautious of volatility spikes
Mr SMC Trading point
---
Trading Idea Summary
Buy Entry Zone: 141.8–143.0 (support or FVG)
Stop Loss: Below 141.5
Target: 148.68
Risk/Reward: Favorable (approx. 1:3+)
Pales support boost 🚀 analysis follow)
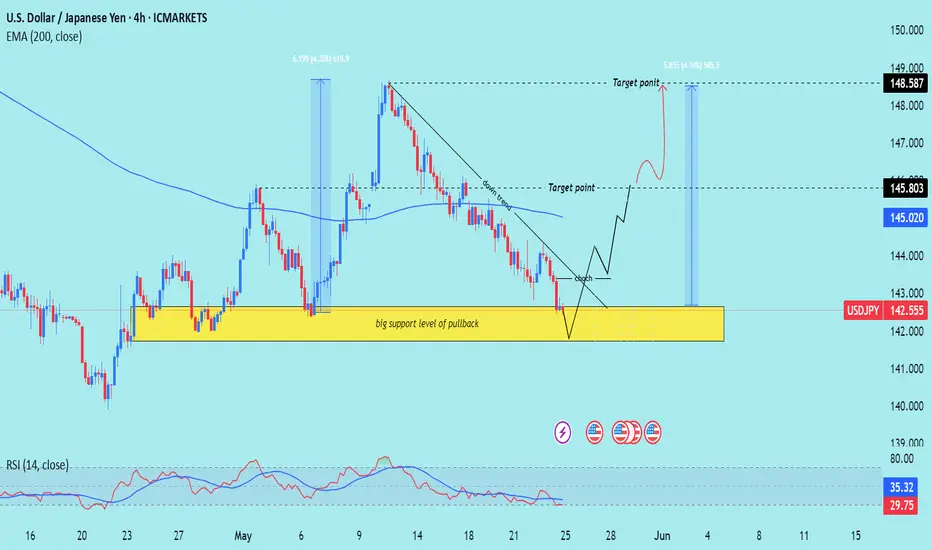
USD/JPY) Bullish reversal analysis Read The ChaptianMr SMC Trading point update
Technical analysis for the USD/JPY (U.S. Dollar / Japanese Yen) on the 4-hour timeframe. Here's a detailed breakdown of the idea and strategy:
---
Key Components of the Chart:
1. Strong Support Zone:
The yellow zone is labeled as a “big support level of pullback”, around the 142.00 – 141.20 range.
Price has historically bounced from this zone, suggesting demand and buyer interest.
2. Bullish Structure Setup:
Price is forming a double bottom or potential reversal pattern in the support zone.
A downtrend line is clearly marked, and a break above this trendline would signal bullish continuation.
3. EMA 200 (at 145.020):
The EMA is currently acting as dynamic resistance.
A breakout above the EMA would confirm further bullish momentum.
4. RSI Indicator:
RSI is currently below 30, indicating the market is oversold – a common precursor to a bullish reversal.
5. Target Levels:
Target 1: 145.803 – likely the first resistance level or EMA retest.
Target 2: 148.587 – a prior high and strong resistance area.
6. Projection:
Price is expected to bounce from support, break the trendline, retest, and then rally to higher levels.
---
Trade Idea Summary:
Bias: Bullish
Entry Zone: Near 142.00 – 141.20 (support zone)
Confirmation: Break above the descending trendline + bullish RSI divergence
Targets:
TP1: 145.803
TP2: 148.587
Invalidation: Break and close below 141.00 (support zone broken)
Mr SMC Trading point
---
Risk Management Suggestion:
Use a tight stop-loss below the support zone, considering it's the key reversal area. Also, keep an eye on fundamental factors such as U.S. and Japan interest rate decisions or key economic events (indicated by the icons on the chart).
Pales support boost 🚀 analysis follow)
Is a new round of decline impending?
The latest prices of USD/JPY are fluctuating around the range of 1.43922 to 1.44275, with an average price of 1.43917. The earlier pullback from higher levels indicates some downward pressure. On the upside, the pair may encounter resistance near the 144.20 level, with the next key resistance at around 144.50 and the first major resistance at 145.00. A close above the 145.00 level could lay the foundation for further gains.
Under the above scenario, the pair may even break through the 146.00 resistance level, with the next major target for bulls near the 147.80 resistance level.
Humans need to breathe, and perfect trading is like breathing—maintaining flexibility without needing to trade every market swing. The secret to profitable trading lies in implementing simple rules: repeating simple tasks consistently and enforcing them strictly over the long term.

USDJPY starting bullish move?Hello traders, this is a complete multiple timeframe analysis of this pair. We see could find significant trading opportunities as per analysis upon price action confirmation we may take this trade. Smash the like button if you find value in this analysis and drop a comment if you have any questions or let me know which pair to cover in my next analysis.
