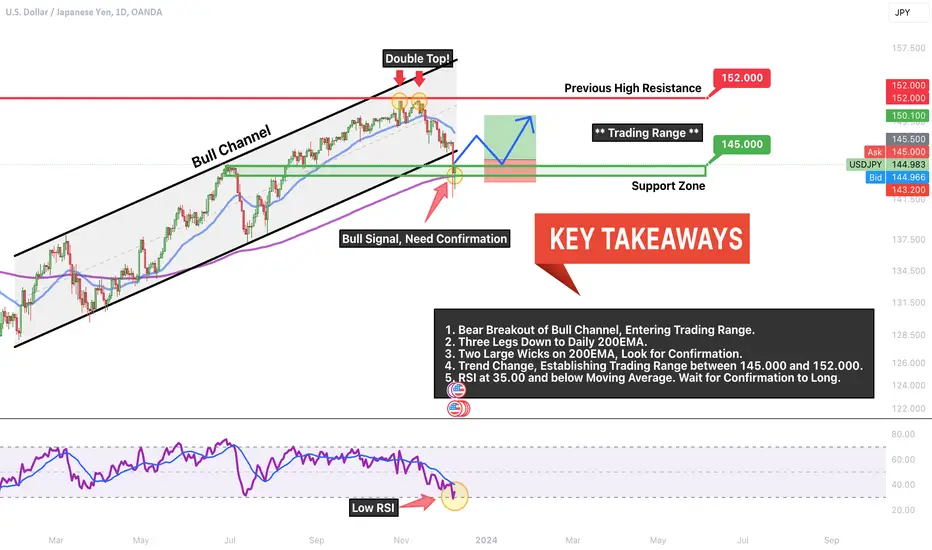
USDJPY → Bear Run Complete! Bounce back to 152.000? Let's AnswerUSDJPY has officially broken out of the bull channel it's been in since February 2023 and fell hard into the Weekly 200EMA! The final Daily bear candle closed with a large wick over 1/3 the total size and the following Daily candle closed with a long tail as well. Does that mean we're going up?
How do we trade this? 🤔
A bear breakout on a bull channel after the double top reversal is usually a signal that we're about to enter a trading range (sideways price action). We have a good show of Support at the 200EMA and possibly up to the previous high in the bull channel between 143.850 and 144.850, but we need confirmation to ensure that this Support zone is real which includes a strong bull followthrough candle on the Daily chart.
Look to long toward the bottom of the trading range after it's been established, an entry around the 145.000 area is reasonable looking for a 1:1 scalp or 1:2 swing on a lower timeframe.
💡 Trade Idea 💡
Long Entry: 145.500
🟥 Stop Loss: 143.200
✅ Take Profit: 150.100
⚖️ Risk/Reward Ratio: 1:2
🔑 Key Takeaways 🔑
1. Bear Breakout of Bull Channel, Entering Trading Range.
2. Three Legs Down to Daily 200EMA.
3. Two Large Wicks on 200EMA, Look for Confirmation.
4. Trend Change, Establishing Trading Range between 145.000 and 152.000.
5. RSI at 35.00 and below Moving Average. Wait for Confirmation to Long.
⚠️ Risk Warning! ⚠️
Past performance is not necessarily indicative of future results. You are solely responsible for your trades. Trade at your own risk!
Like 👍 and comment if you found this analysis useful!
Usdjpybullish
USDJPY → Drop to 144.000!? Or Fly back to 152.000? Let's Answer.USDJPY fell from the double top as predicted in last week's analysis, hitting my take profits all the way down to 147.120. Will there be more downside or are we ripe for a rip back to 152.000?
How do we trade this? 🤔
This analysis shows us three clean support areas: 146.000 (Bull Channel Support), 145.000 (Previous High), and 144.000 (200EMA). It's reasonable to zoom into small timeframes and look for short scalp setups down to those levels. Since the macro trend is bullish, I would be careful to hold any shorts now that the gap from 152.000 has closed the majority of the way. The RSI is still below the moving average and has *some* room to fall, supporting the short-term bear bias.
Long-term, look to get long! We'll need a strong show of support with a bull signal bar and confirmation candle closing on or near its high and for the RSI to head upward breaking above the Moving Average.
💡 Trade Ideas 💡
Short Entry: 146.850
🟥 Stop Loss: 150.000
✅ Take Profit: 143.700
⚖️ Risk/Reward Ratio: 1:1
Long Entry: 145.500
🟥 Stop Loss: 143.200
✅ Take Profit: 150.100
⚖️ Risk/Reward Ratio: 1:2
🔑 Key Takeaways 🔑
1. Bull Channel, Bias to Long.
2. Double Top Reversal Signal. Still Gaps to Fill.
3. Wait for Support at Channel Support, Previous High, or 200EMA.
4. Previous Channel High of 145.000 Final Target.
5. RSI at 35.00, below Moving Average. Supports Short-term Short, Long-Term Long.
⚠️ Risk Warning! ⚠️
Past performance is not necessarily indicative of future results. You are solely responsible for your trades. Trade at your own risk!
Like 👍 and comment if you found this analysis useful!

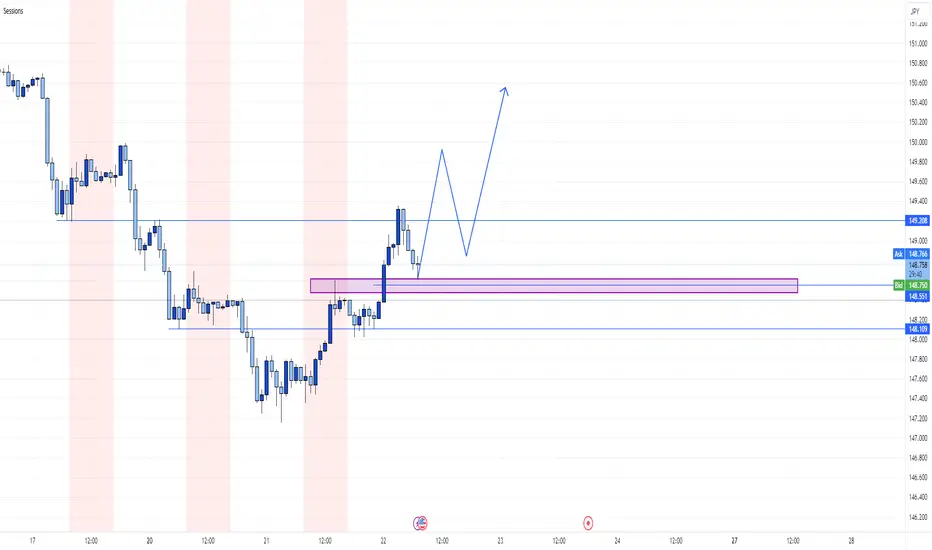
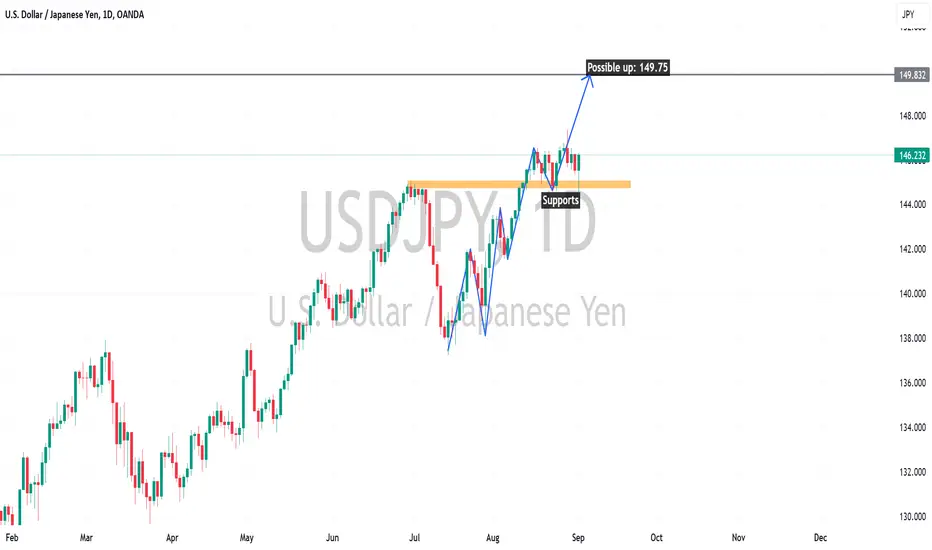
22 NOVEMBER USDJPY ASSESSMENTBullish on USDJPY based on daily timeframe. If USDJPY can get pasted 150 range and come back to retest subsequent entries could be taken. I think news will push it up as it is holiday season, and the FED did not increase interest rates.
USDJPY BuyAs we all know that the economic condition of Japan is not fine, and they are also facing natural disasters. I still believe that Yen will remain weak in coming week. Better to look buying opportunities on such pairs which have YEN.
USDJPY BuyJapanese Yen showed its strength last week but on Friday it was weak. I think next whole week Japanese Yen will be weak and it is good to buy all Japanese pairs.
USDJPY BuyDo not think that the pair is overbought and it will now, look at Japan economy and their policy. Japan will strong but not now. They are doing great work but their currency is weak against the all pairs.
USDJPY BullishAs I am saying since last two months that JPY is not strong enough and it will remain in bearish mode and now, we can see the currencies again JPY are going straight up, and I think it will remain up (Pairs)
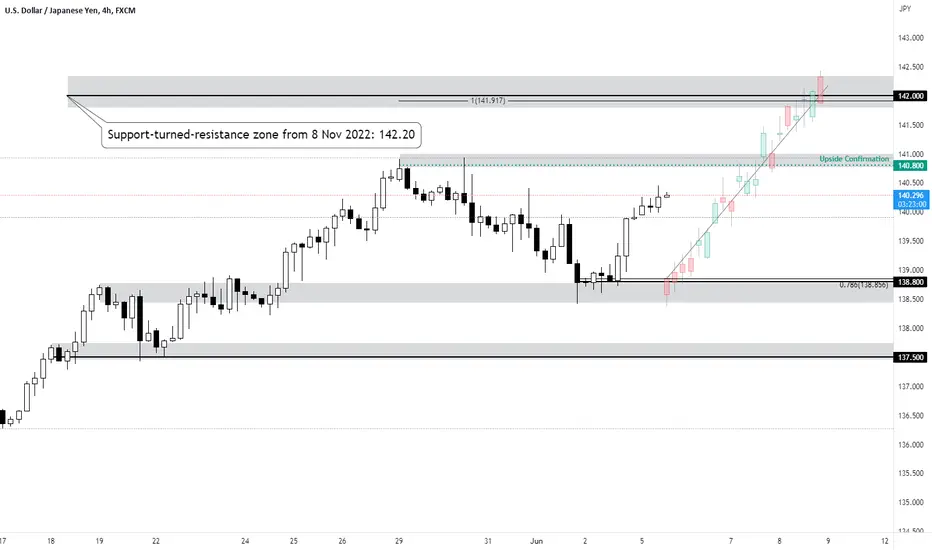
USDJPY H4: Bullish outlook seen, further upside above 138.80Price is hovering above a key support zone at 138.80 on the H4 timeframe. A throwback to this zone, which coincides with the 78.6% Fibonacci retracement, could present an opportunity to ride the bounce to the resistance zone at 140.40, which is in line with the 78.6% Fibonacci retracement. Stochastic RSI is in the oversold region below 20, supporting our bullish bias.

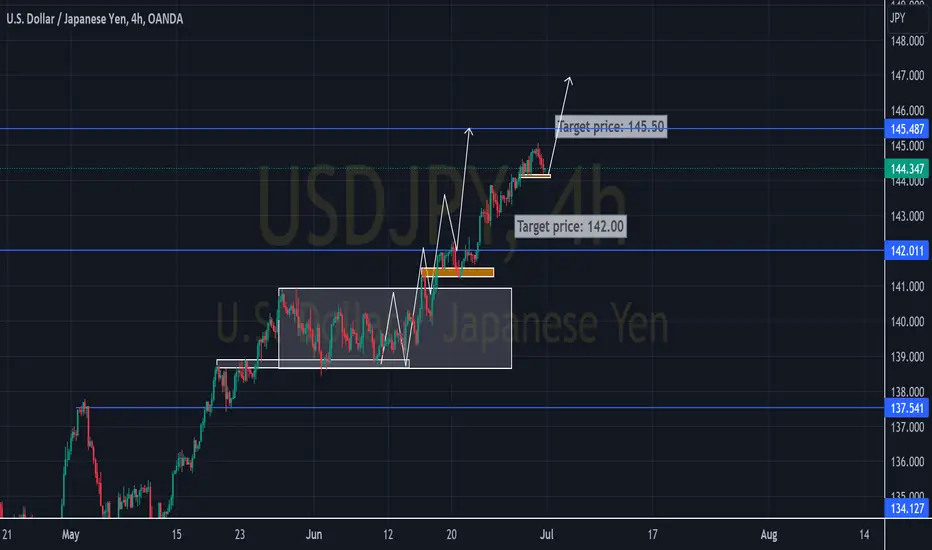
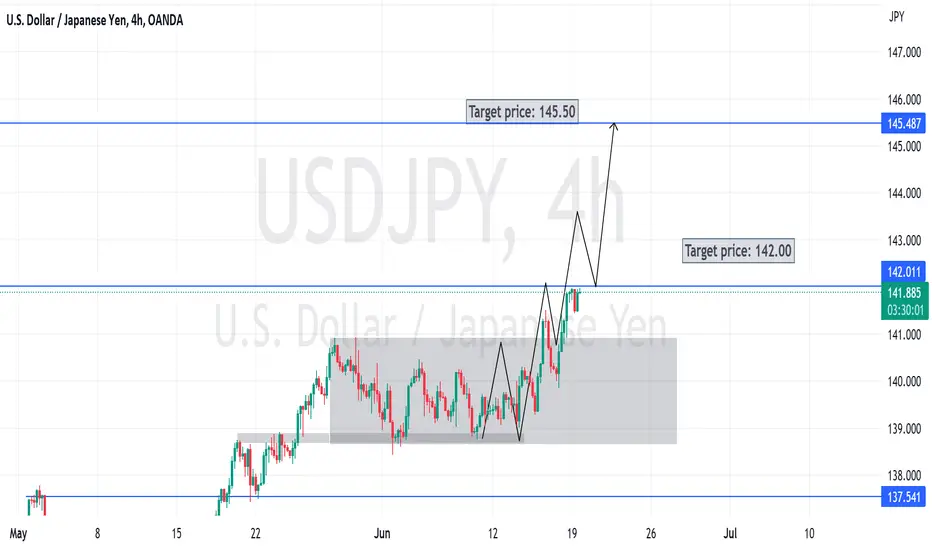
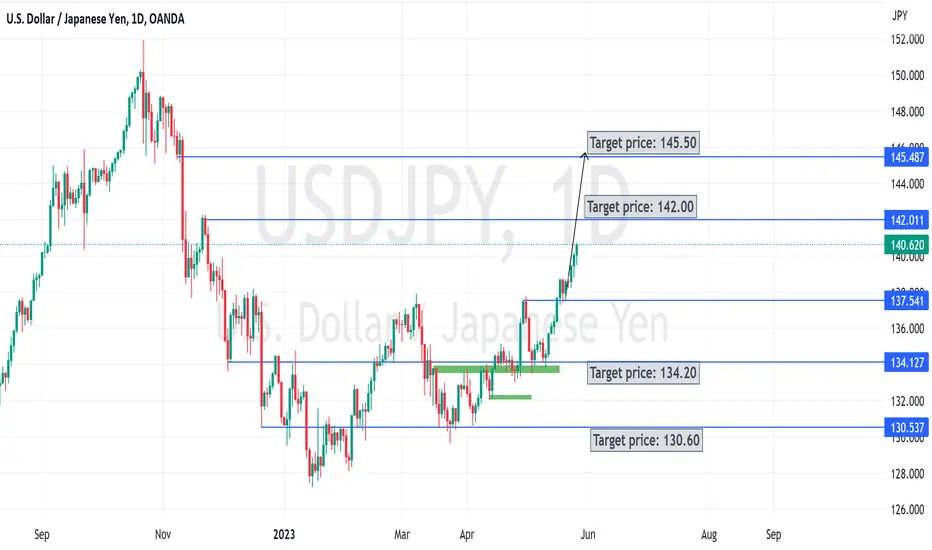
Bullish Outlook on USDJPY- 5 Jun 2023Currently, there is bullish order flow, with higher lows and higher highs created. A break above upside confirmation at 140.80, followed by a throwback to support zone at 138.80, which nears the 78.6% Fibonacci retracement level, could provide bullish acceleration towards the resistance zone at 142.00, which coincides with the 100% Fibonacci extension level. Price is currently hovering above ichimoku cloud and 20 EMA, supporting our bullish bias.
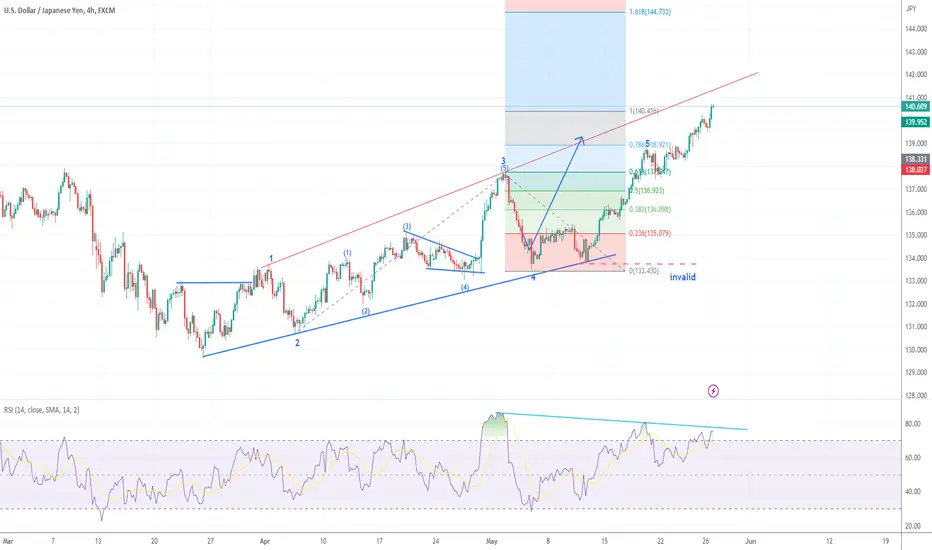
USDJPY 28May2023USDJPY last week had a good bullish performance. likely to respond to the trendline area & if you see the RSI divergence has occurred. could be one of the markers of a reversal or there may be a small correction and continue to be bullish again until the US debt payment announcement.
USDJPY AnalysisUSD is much stronger than Japanese Yen. Japan economy is not in the good condition. As per my analysis Yen will remain weak for the whole next week. Better to look buying opportunity on it.
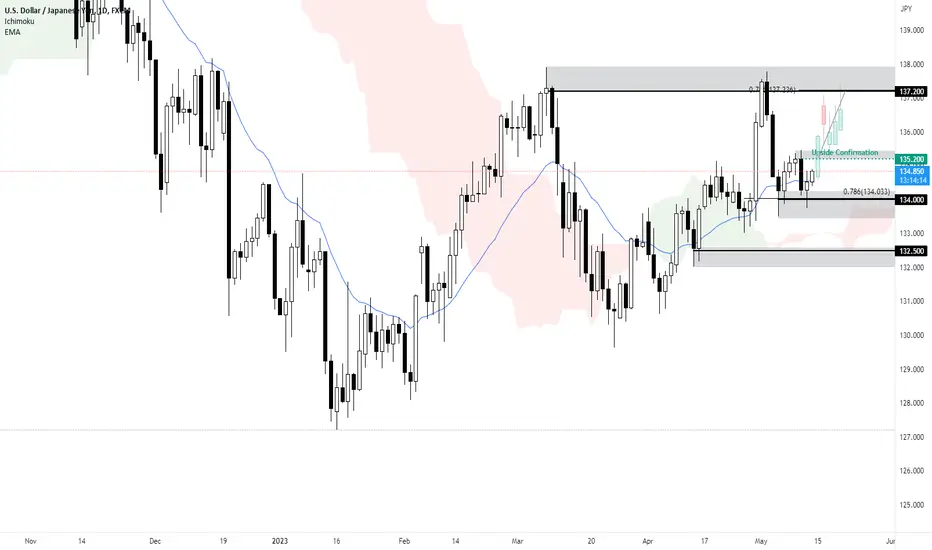
Bullish Outlook on USDJPY - 12 May 2023Price tested a key support zone at 134 on the Daily timeframe, which is in line with the 78.6% Fibonacci retracement. A break above the confirmation level at 135.2 could provide bullish acceleration towards the resistance zone at 137.2, which coincides with the 78.6% Fibonacci extension level. Price is holding above the Ichimoku cloud and 20 EMA, supporting our bullish bias.
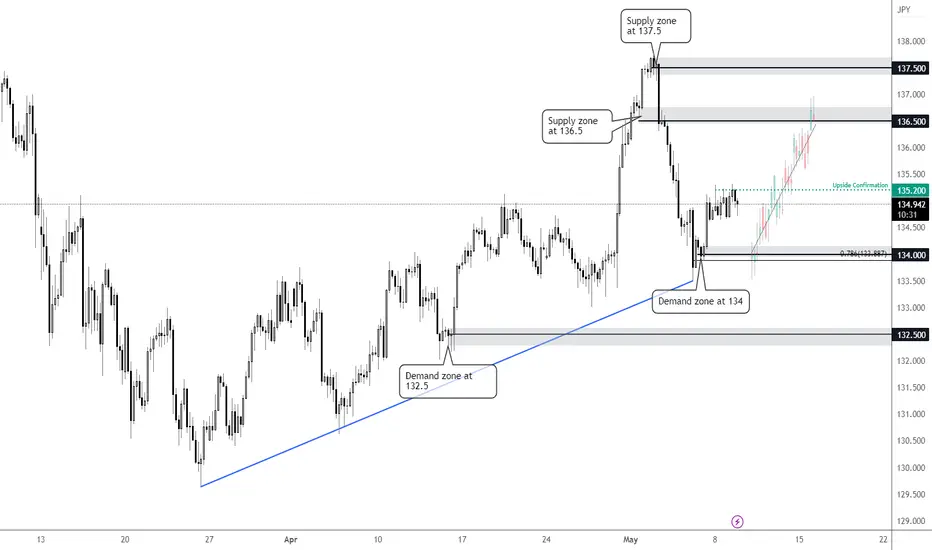
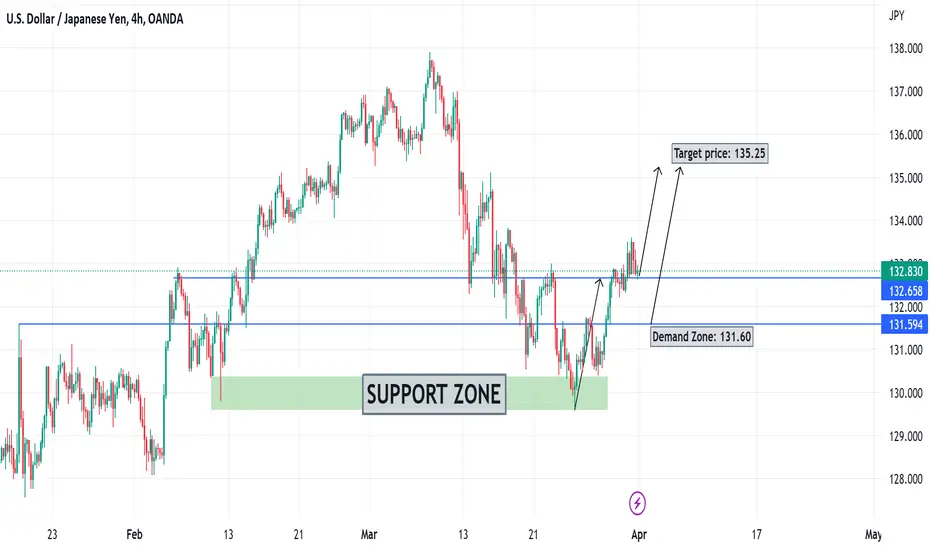
USDJPY 4H: Bullish outlook seen, further upside above 136.5Price is bullish, forming higher highs and higher lows. Price is currently hovering above a key demand zone at 134 on the H4 timeframe. A throwback to this demand zone, which coincides with the 78.6% Fibonacci retracement, followed by a break above our upside confirmation at 135.2 could provide the bullish acceleration to the supply zone at 136.5.
USDJPY BuyUSDJPY is taking support on its major levels. Japanese yen is not stronger, as we all knows Japan did not increased it interest.
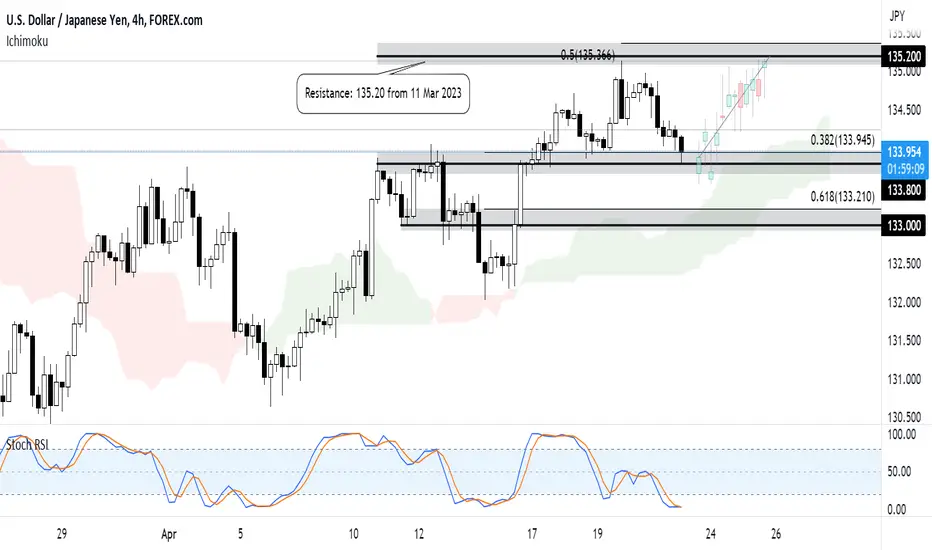
Bullish outlook on USDJPY - 21 April 2023Price is testing a key support zone at 133.80 on the H4 timeframe, which is in line with the 38.2% Fibonacci retracement. A throwback to this zone could present the opportunity to ride the bounce to the resistance zone at 135.20, which coincides with the 50% Fibonacci extension level and graphical high. Price is holding above the Ichimoku cloud and Stochastic RSI is in the oversold region below 20, supporting our bullish bias.
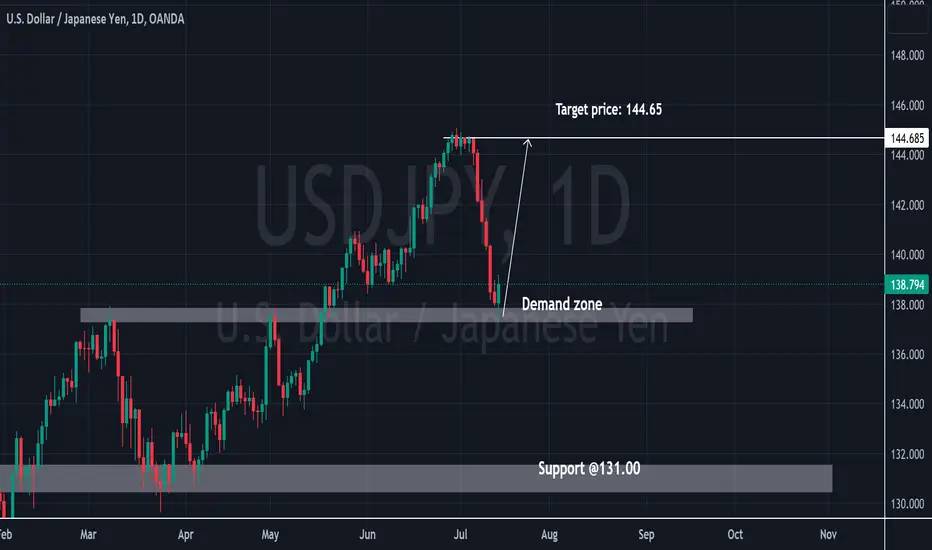
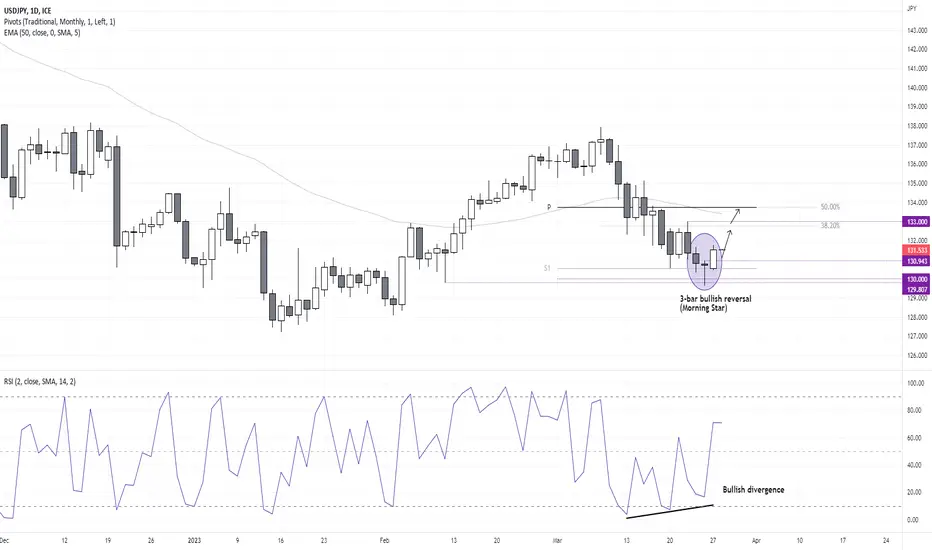
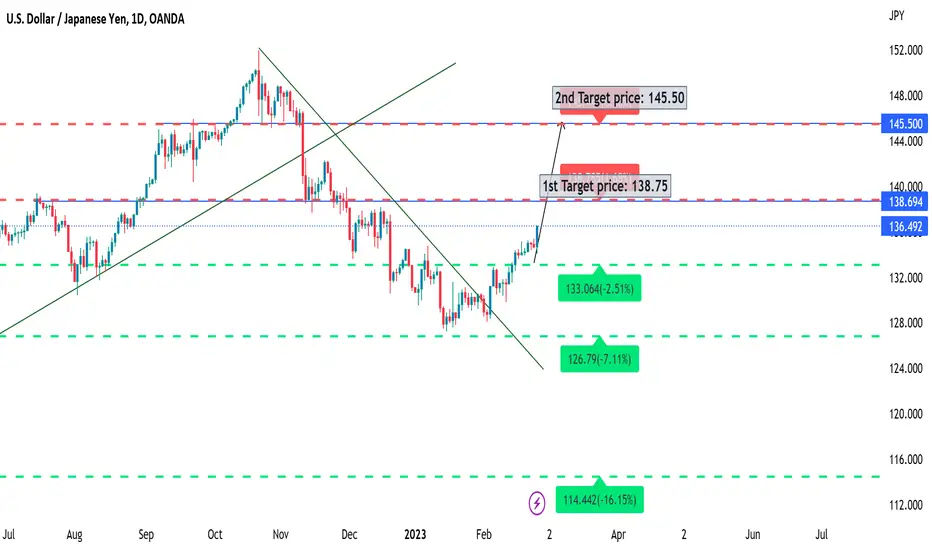
3-bar bullish reversal on USD/JPYAfter an extended pullback on the USD/JPY daily chart, we think it is time for the pair to revert higher.
A bullish divergence formed with the RSI (2) and a bullish pinbar formed on after a failed attempt to break below 130. Being a round number, there's reasonable chance of demand down at that level, and yesterday's up day is part of a 3-day bullish reversal (Morning Star).
- The bias remains bullish above Friday's low, although bulls could seek bullish setups on lower timeframes if prices pull back towards Friday's high - or wait for a break of yesterday's high to assume bullish continuation.
- An initial target is around the 38.2% Fibonacci ratio / 133 handle
- A Second target could be around the monthly pivot / 200-day EMA / 50% retracement level
USDJPY BuyUSD seems stronger than JPY. I think JPY is weaker than all its pair. It is better to look buying setup on all JPY pairs next week.
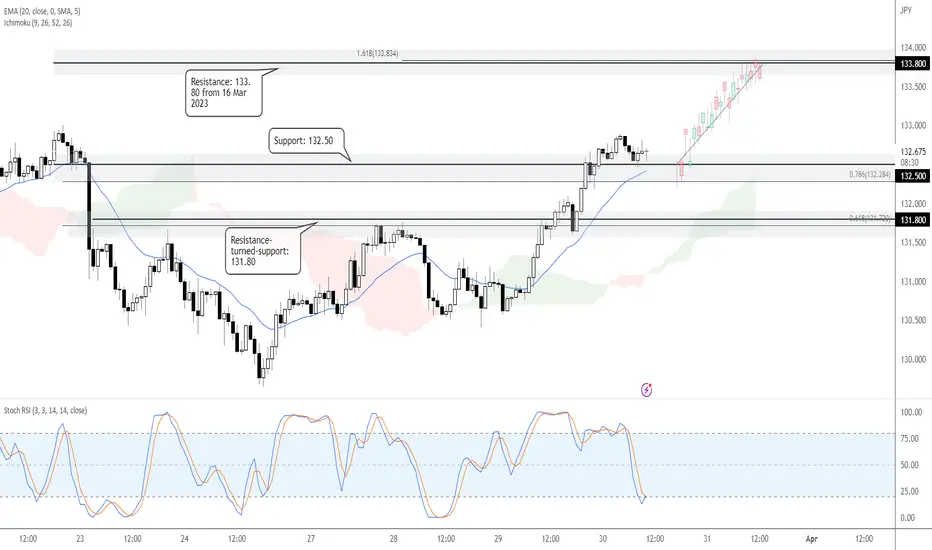
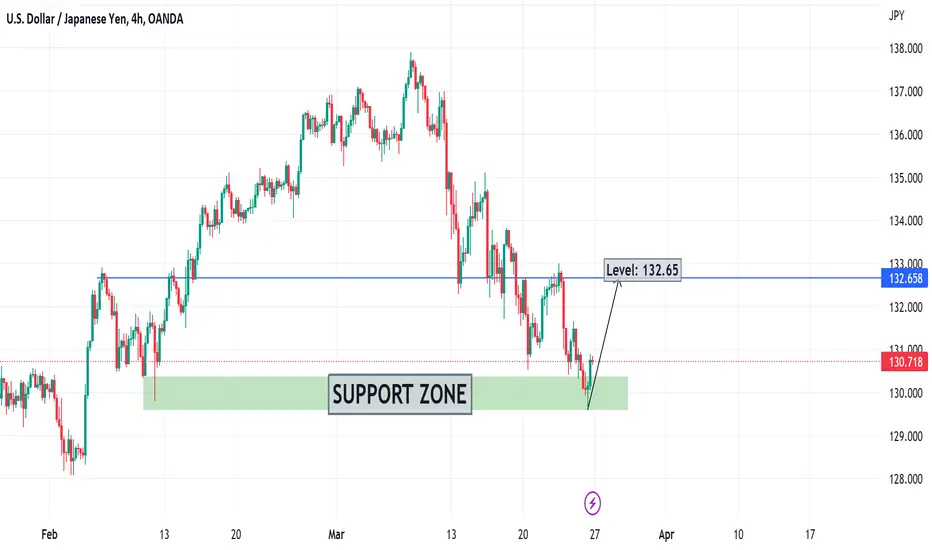
USDJPY H1: Bullish outlook seen, further upside above 132.50Price is currently hovering above a key support zone at 132.50 on the H1 timeframe. A throwback to this support zone, which coincides with the 78.6% Fibonacci retracement, could provide the bullish acceleration to the resistance zone at 133.80, in line with the 161.8% Fibonacci extension. Price is holding above the 20 EMA and Ichimoku cloud, while Stochastic RSI is in the oversold region below 20, supporting our bullish bias.
USDJPY BuyThe USDJPY took support at major level. I believe USDJPY will rise if JPY continue to show weakness.
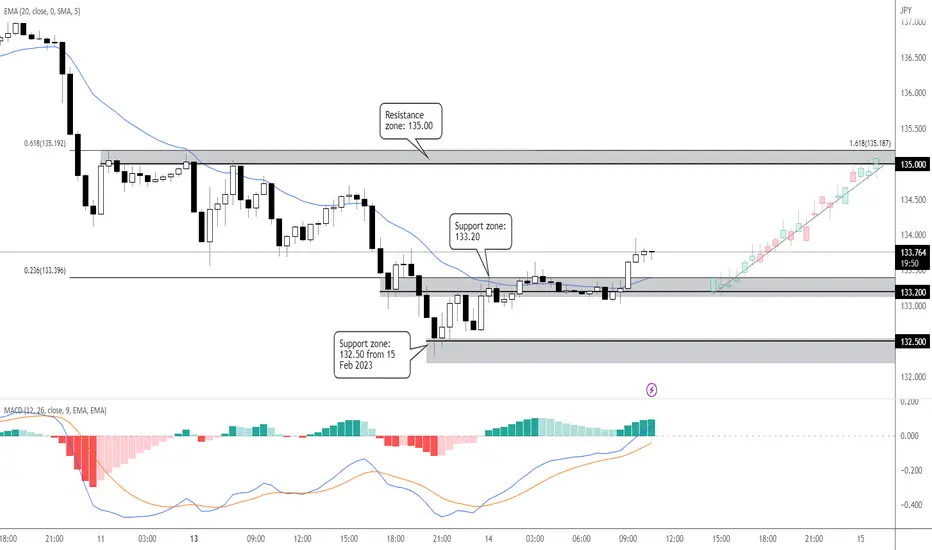
USDJPY M30: Bullish outlook seen, further upside above 133.20Prices have broken above a key resistance-turned support zone at 133.20 on the M30 timeframe, in line with the 23.6% FIbonacci retracement. A throwback to this zone could present an opportunity to ride the bounce to the resistance zone at 135.00, which coincides with the 161.8% Fibonacci extension and 61.8% Fibonacci retracement. Price is holding above the 20 EMA, while MACD is showing bullish momentum, supporting our bullish bias.
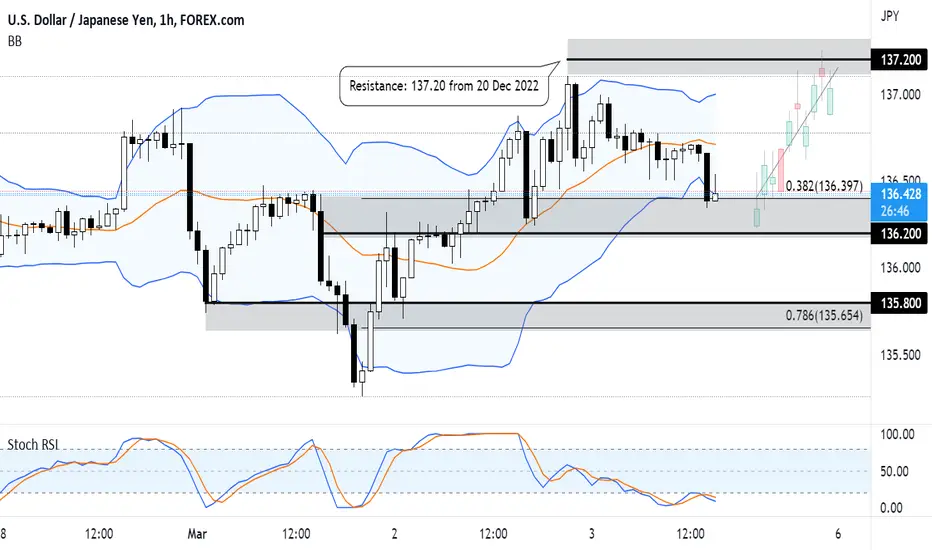
Bullish outlook on USDJPY - 3 March 2023On the H1 timeframe, prices are testing a support zone at 136.20, which is in line with the 38.2% Fibonacci retracement. A throwback to this zone presents an opportunity to ride the bounce to the resistance zone at 137.20. Stochastic RSI is in the oversold region below 20, and price is hovering near the bottom of the Bollinger Bands, supporting our bullish bias.
USDJPY BuyUSDJPY will rise more against the JPY. I think USD is stronger than JPY and this pair will rise gradually. Better to look buying opportunity on it.
USDJPY BuyJapanese Yen looking weaker, against the USD. I think every support is the chance to buy USDJPY.
