USDJPY Long Bias Forecast Q3 W35 D28 Y25 – NY Session 🗓️ USDJPY Long Bias Forecast
Q3 W35 D28 Y25 – NY Session
Top-Down Technical Outlook
🔹 Weekly Timeframe
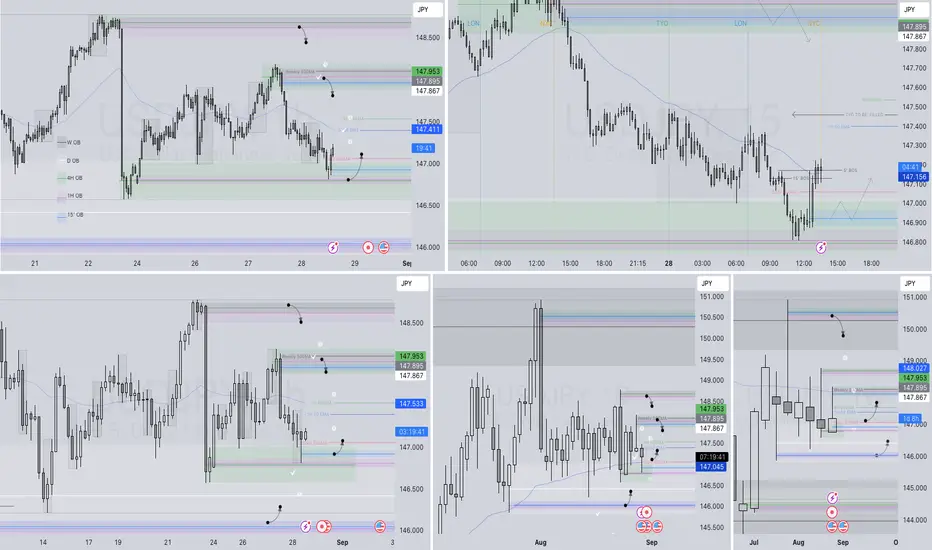
Price Action: Strong rejection from the Weekly 50 EMA, acting as dynamic support.
Note: With two trading days left in the week, the previous weekly wick remains a key area — it may still fill, suggesting further upside potential.
Implication: Structure suggests continuation to the upside, but current price must confirm with internal shifts before entry.
🔹 Daily Timeframe
Current Price: Hovering around the Daily 50 EMA – a key equilibrium level.
Expectation: Potential bullish reaction if buyers defend this zone.
Risk Consideration: Aggressive long entries must be approached cautiously without a confirmed change in internal structure (CHOIS).
🔹 4H Timeframe
Confluence:
Bullish wick closure on the last candle suggests rejection from lower prices.
Order Block (OB) identified near Daily 50 EMA – an ideal POI.
Narrative: Structure is preparing for a potential shift. Look for breaks of internal structure (BOS) to confirm bullish intent.
🔹 1H Timeframe
Candlestick Confirmation: Last 3 consecutive bullish candles forming a classic bullish continuation pattern.
Order Block in alignment with 4H and Daily 50 EMA adds weight to the area.
Bias: Bullish – pending confirmation via BOS and clean pullbacks.
🔹 5-Minute Timeframe
Microstructure:
Refined entry points within OB zone.
Ideal for tight stop entries post BOS and retest of lower-timeframe OB.
Watch For:
Shift from bearish to bullish market structure.
Entry following a break + retest of a demand zone or OB.
✅ Confluences for Longs
Rejection from Weekly 50 EMA.
Price respecting Daily 50 EMA.
4H OB + Bullish candle closure.
1H Bullish formation + OB.
5M potential BOS/CHOIS for refined entry.
⚠️ Cautions / Trade Management
Wait for internal structure shift on lower timeframes before full commitment.
Liquidity sweeps below current price are still possible before upside continuation.
Maintain awareness of macroeconomic catalysts (e.g., U.S. or Japan economic data or central bank commentary).
FRGNT
FX:USDJPY
Usdjpybuy
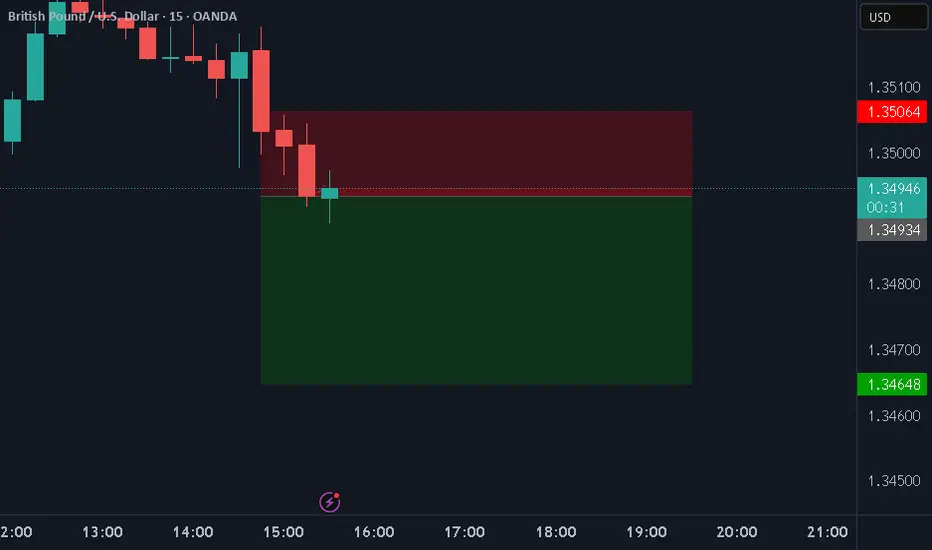
GBPUSD shorts due to better than expect US Eco dataFor the week ending August 23, 2025, U.S. initial jobless claims were 229,000, below the forecast of 231,000 and down from the previous week's revised figure of 234,000. This suggests a slight improvement in new unemployment filings.
Real gross domestic product (GDP) increased at an annual rate of 3.3 percent (0.8 percent at a quarterly rate) in the second quarter of 2025 (April, May, and June), according to the second estimate released by the U.S. Bureau of Economic Analysis.
Due to the above data being better than expected, we can expect the dollar to increase in strength over the short term.
USDJPY – DAILY FORECAST Q3 | W35 | D28 | Y25📊 USDJPY – DAILY FORECAST
Q3 | W35 | D28 | Y25
🔍 Daily Forecast | USDJPY
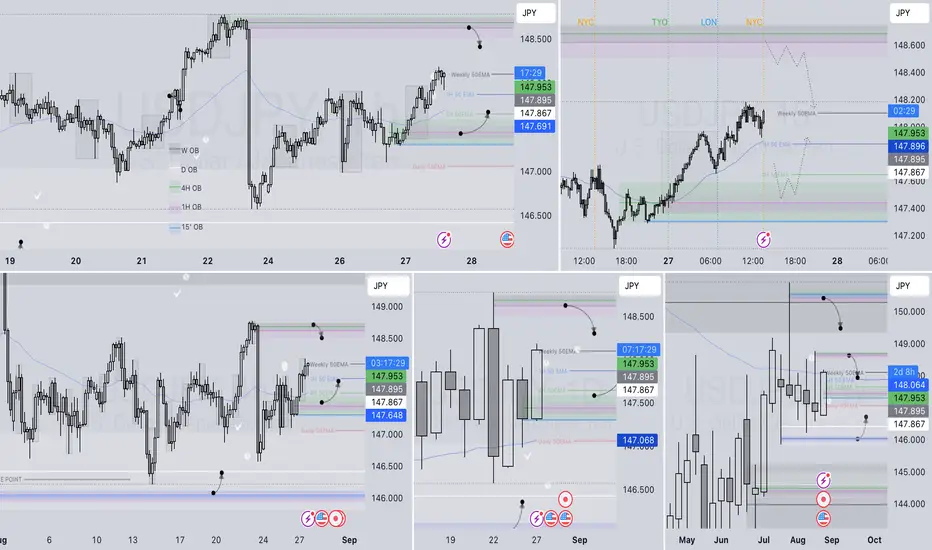
Here’s a concise breakdown of the current chart setup 🧠📈:
📌 Higher time frame order blocks have been identified — these are our patient points of interest 🎯🧭.
We wait for a confirmed break of structure 🧱✅ before executing any position.
This keeps us disciplined, and in sync with what the price action is actually telling us — not what we want it to say.
📈 Risk Management Protocols
🔑 Core Principles:
Max 1% risk per trade
Execute only at pre-identified levels
Use alerts, not emotion
Stick to your RR plan (minimum 1:2)
🧠 You’re not paid for how many trades you take — you're paid for how well you manage risk.
"Trade what the market gives, not what your ego wants."
Stay mechanical. Stay focused. Let the probabilities work for you. 🎯📊
FRGNT
FX:USDJPY
USDJPY — Q3 W35 Mid-Week Forecast Top-Down Analysis | USDJPY — Q3 W35 Mid-Week Forecast - Top-Down Analysis |
mid-week forecast for USDJPY — let’s break it down top to bottom:
🕰️ Weekly Outlook:
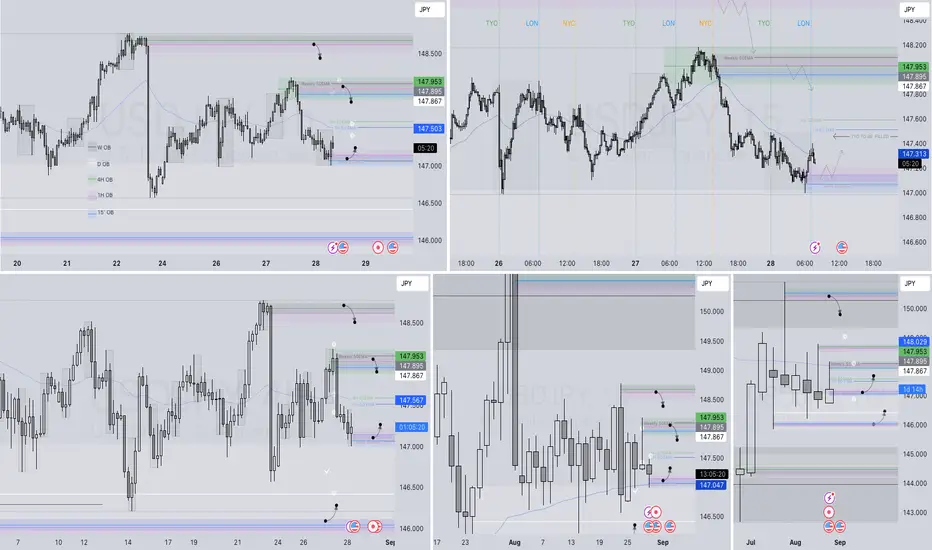
No clear structure or trend bias from the weekly candle 🕯️
However, price closed below the Weekly 50 EMA 📉, leaving a bearish upper wick
This signals a possible continuation to the downside this week
But — as always — wicks tend to get filled first on lower timeframes before short setups play out
📌 Key Reminder:
"Sell from the highs, buy from the lows." 🔁
📆 Daily Structure:
Daily candles have been pushing into lower-timeframe POIs
This aligns with potential sell zones, building confluence
If candles continue to push up, we're watching closely for rejection from the Weekly 50 EMA
⚠️ Don’t be thrown off by a bullish weekly candle midweek — we're anticipating a rejection wick and bearish close.
Let structure confirm.
⏱️ Lower Time Frame Confluence:
🔻 Primary Short Bias (High Confidence Zone):
🔸 4H POI containing:
A clean Order Block (OB)
A void (imbalance)
🔹 Within that, a 1H OB + void adds strong confluence 🔐
Once price enters the zone:
⬇️ Scale to 5-min
Wait for Break of Structure (BoS)
Execute the short ✅
🔺 Optional Long Setup (If Structure Shifts):
While short bias is primary, longs are not off the table
A separate POI based on 4H / 1H / 15' exists for a possible long
If price hits this zone:
Wait for LTF BoS (1' or 5')
Consider long entries, only if confluence stacks
🧠 Key Takeaways:
Weekly close below 50 EMA = bearish tilt, but lower timeframe confirmation needed
Let the wicks fill before forcing shorts
Only take longs with strong confluence
As always — one trade at a time, risk managed, confluence stacked
Trade safe, stay disciplined.
FRGNT
FX:USDJPY
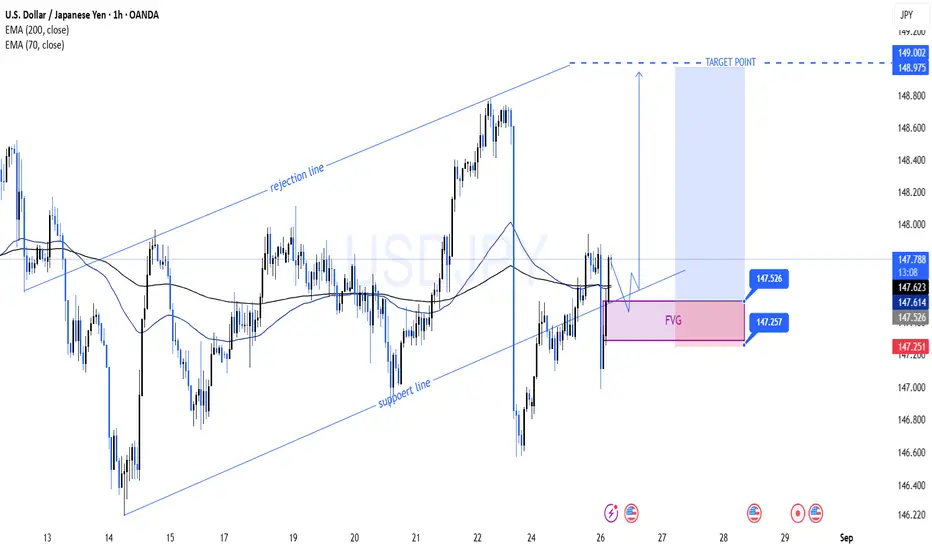
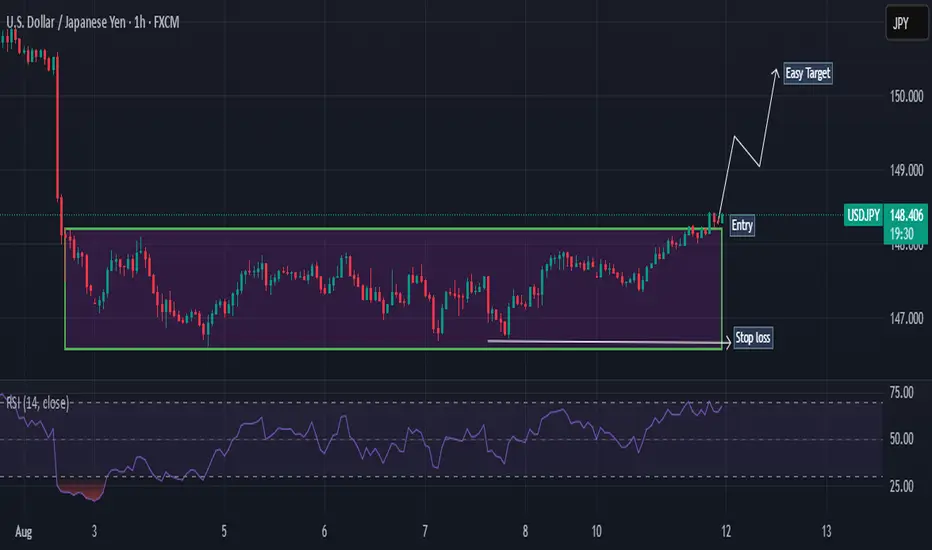
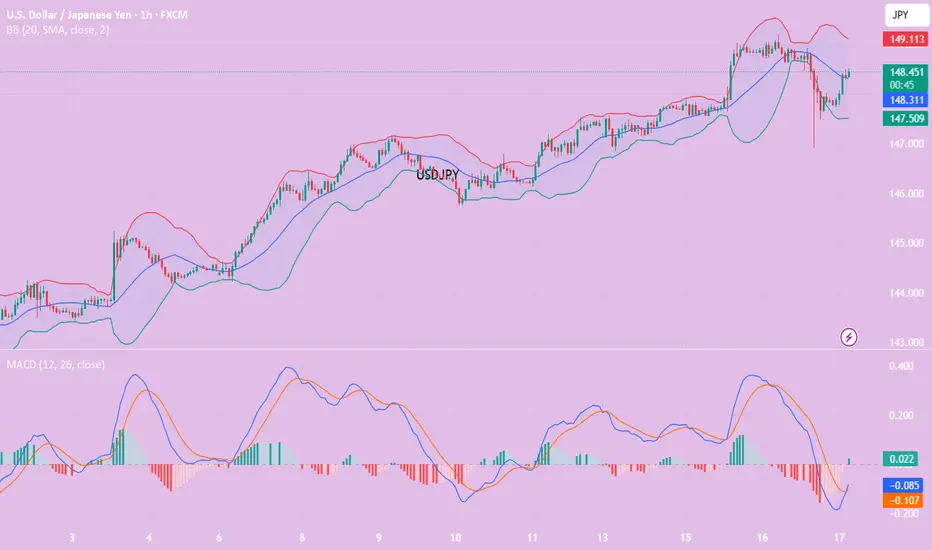
USD/JPY Bullish Continuation Towards 149.00This USD/JPY (1H) chart shows a bullish setup:
Price is respecting the ascending channel (support & rejection lines).
Currently, price is near the FVG (Fair Value Gap) zone between 147.257 – 147.526, suggesting a possible retracement before continuation upward.
Both EMA 70 & EMA 200 are aligned closely, acting as dynamic support.
A long entry is expected from the FVG zone with a target point at 148.975 – 149.002.
Stop-loss lies below the FVG around 147.251.
👉 Overall bias: Bullish continuation towards 149.00 after filling the FVG.
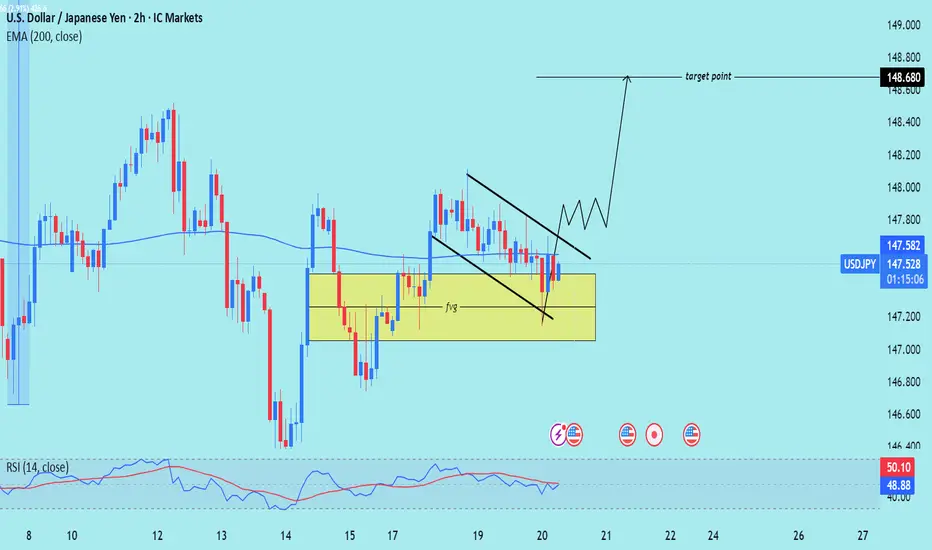
USD/JPY) Bullish Trend Read The captionSMC Trading point update
Technical analysis of USD/JPY (2H) analysis you shared:
---
Technical Breakdown
1. Price Action & Zone
Price retraced into a Fair Value Gap (FVG) / demand zone (yellow box) around 147.00 – 147.40.
Strong buying interest is visible from this zone.
2. Falling Wedge Pattern
A falling wedge has formed, which is typically a bullish reversal pattern.
Price is attempting to break out above wedge resistance, showing potential for upside momentum.
3. EMA (200 Close)
Price is interacting with the 200 EMA (147.58), serving as dynamic resistance.
A sustained breakout above this EMA would confirm bullish continuation.
4. RSI (14)
RSI currently around 46–50, suggesting neutral momentum with room for upside.
---
Trade Idea
Bias: Bullish
Entry Zone: On breakout & retest of wedge / demand zone.
Target: 148.680 (as marked).
Invalidation: Below 146.60 (clear break under demand/FVG zone).
Mr SMC Trading point
---
This setup suggests a bullish reversal from support, with a likely push toward 148.68 after wedge breakout.
please support boost 🚀 this analysis)
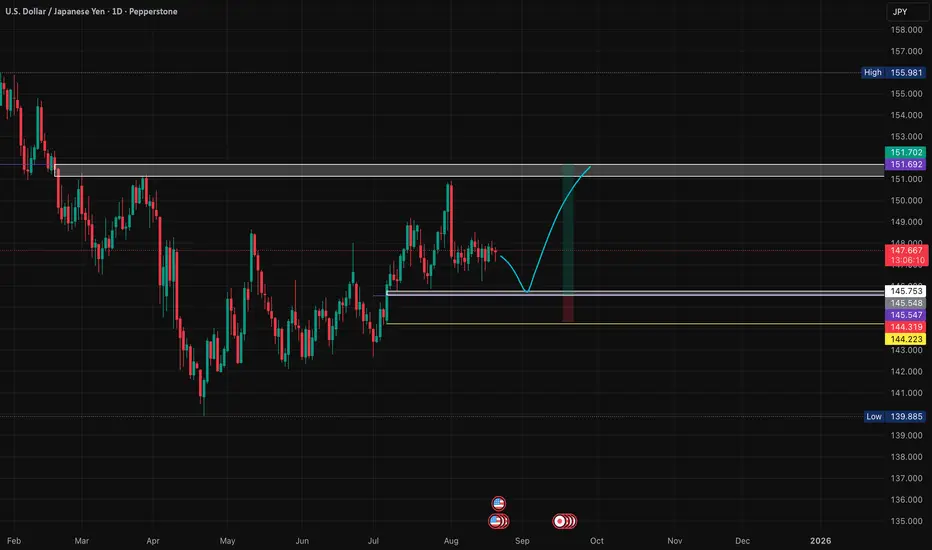
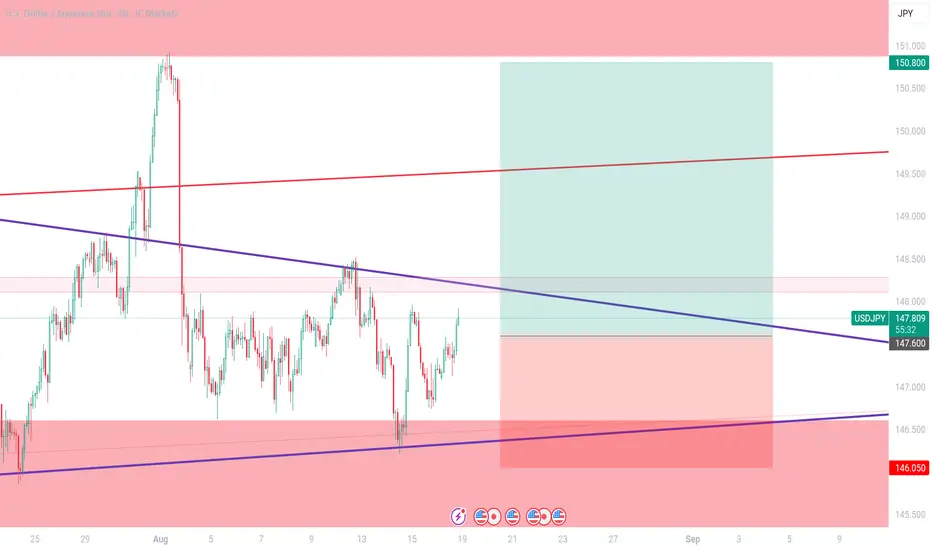
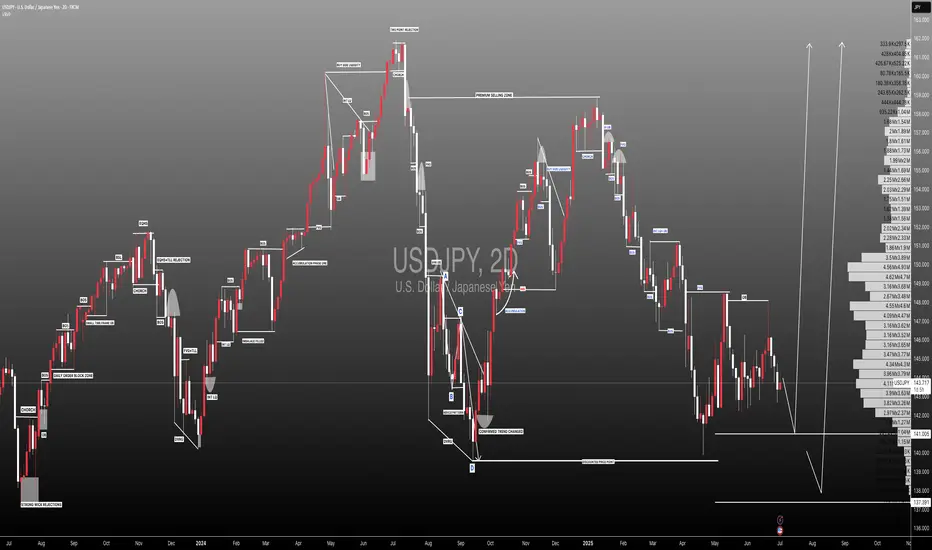
USDJPY: Multi-Timeframe Liquidity Hunt Setup - Monthly OutlookSharing my longer-term perspective on USDJPY with a two-phase liquidity scenario. 📊
**🎯 The Big Picture:**
I'm expecting a classic two-phase move: first a liquidity hunt down to the lower purple line (white-boxed zone), followed by a strong rally up to the upper purple line. This would represent my ideal scenario for the coming months. 📈
**📍 Liquidity Zones Explained:**
The purple lines (highlighted in white boxes) represent key liquidity zones where stops are likely parked. Markets love to sweep these levels before making their real moves - it's textbook institutional behavior. 💰
**⏰ Timing Expectations:**
I expect the downside liquidity hunt to occur within the remaining days of this month or early next month. These moves often happen faster than people anticipate. ⚡
**🛡️ Invalidation Level:**
The yellow line marks the low of a strong weekly bullish candle - a significant structural point. If price breaks below this level, it would invalidate this bullish scenario entirely. 🚨
**🧠 Why This Setup Makes Sense:**
This type of liquidity grab followed by reversal is classic market mechanics. The lower liquidity zone represents trapped shorts and protective stops - perfect fuel for the eventual rally to the upper target. 🔄
**⚠️ Risk Management:**
Clear invalidation point below the yellow line, targeting the upper liquidity zone for a clean setup with defined parameters. 🎯
📈 **This trade setup offers a risk-to-reward ratio of 5:1.** Without including fees, the breakeven win rate for this trade would be approximately 16.67%. Knowing these figures in advance helps me avoid emotional trading. 🧠
💡 **Pro Tip**: If you often find yourself trading based on emotions, I recommend doing this type of pre-planning and quantifying your setups before execution — it can be a simple yet highly effective improvement. ✅
---
**Trading is simple.** You don't need multiple indicators or dozens of lines on your chart. A clean and simple chart often works best — it keeps your decisions consistent and reduces uncertainty. Sure, it might not look flashy, and my analysis may seem a bit "plain" compared to others… but that's how I like it. If you find this analysis useful, feel free to follow me for more updates.
---
*Disclaimer: This post is for general informational and educational purposes only. It does not constitute financial advice, investment recommendation, or a service targeting specific investors, and should not be considered illegal or restricted information in any jurisdiction.*
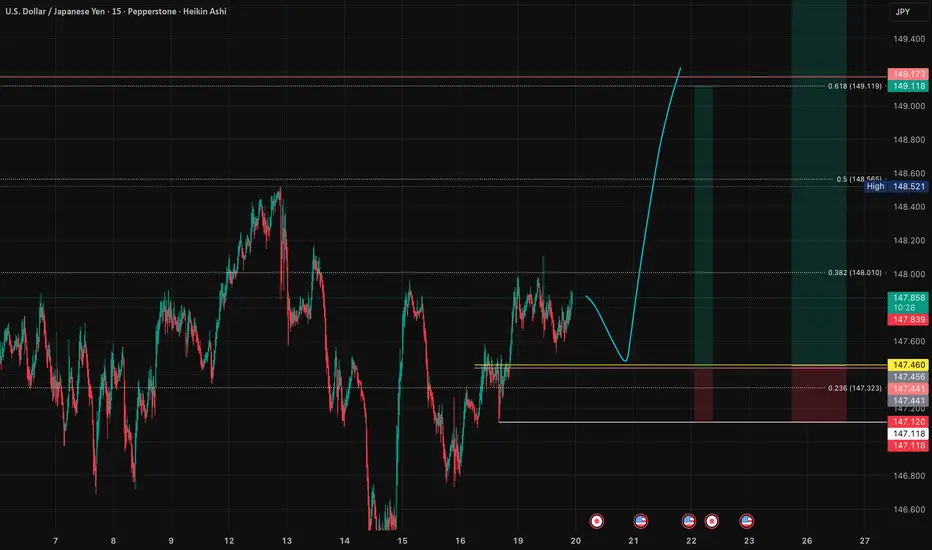
USDJPY: Simple Role Reversal Play - Fibonacci RetracementSharing my straightforward read on USDJPY for the immediate term. 🎯
**📍 The Setup:**
I'm expecting a role reversal move back toward the recent range highs. After that initial bounce, I'm looking for a stronger upward move targeting approximately the 0.618 Fibonacci retracement level of the larger range structure. 📊
**⏰ Timing Expectations:**
If this scenario plays out, it should happen within the next day or two. Currency moves often have tight timing windows, and this setup has that "ready to go" feel to it. ⚡
**🎯 Why This Makes Sense:**
Role reversals at key levels are bread-and-butter setups. Former resistance becomes support, and the market often tests these flipped levels before continuing the broader move. Simple market mechanics. 🔄
**🧠 Keep It Simple:**
Sometimes the best trades are the most obvious ones. No complex analysis needed here - just clean technical levels and patient execution. 📈
📈 **This trade setup offers a risk-to-reward ratio of 5:1.** Without including fees, the breakeven win rate for this trade would be approximately 16.67%. Knowing these figures in advance helps me avoid emotional trading. 🧠
💡 **Pro Tip**: If you often find yourself trading based on emotions, I recommend doing this type of pre-planning and quantifying your setups before execution — it can be a simple yet highly effective improvement. ✅
---
**Trading is simple.** You don't need multiple indicators or dozens of lines on your chart. A clean and simple chart often works best — it keeps your decisions consistent and reduces uncertainty. Sure, it might not look flashy, and my analysis may seem a bit "plain" compared to others… but that's how I like it. If you find this analysis useful, feel free to follow me for more updates.
---
*Disclaimer: This post is for general informational and educational purposes only. It does not constitute financial advice, investment recommendation, or a service targeting specific investors, and should not be considered illegal or restricted information in any jurisdiction.*
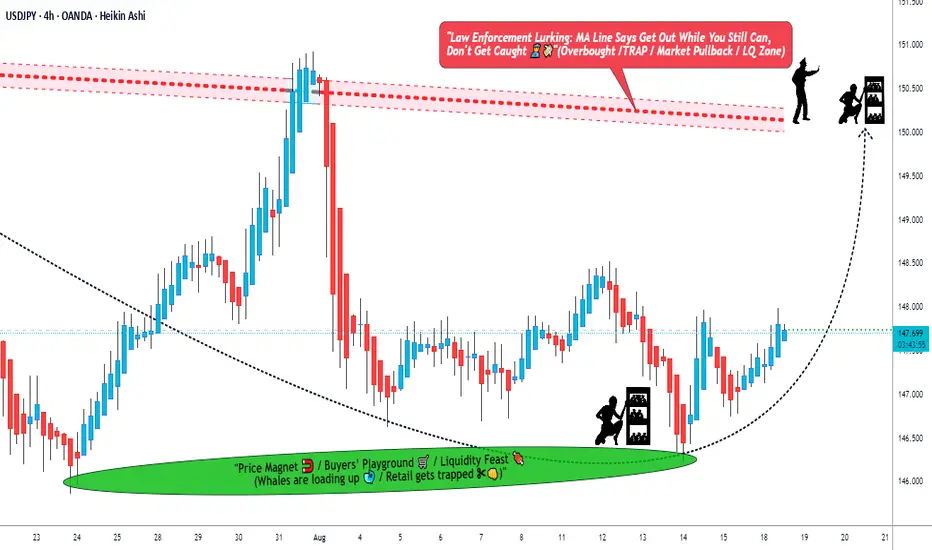
"The USDJPY Ninja Trade – Silent Entry, Big Exit!"🚨💰 USD/JPY “The Ninja” Forex Bank Heist Plan (Swing Trade) 🐱👤💴💵
🎭 Dear Money Makers, Robbers & Thief OG’s,
It’s time to gear up for our biggest Ninja heist on the Forex streets!
We’re breaking into the USD/JPY vault with a Bullish Master Plan – grab your mask, load your limit orders, and let’s rob the market clean! 💰🔫
🗡️ Heist Entry (Layering Style) 📈
Thief doesn’t enter with one bullet – we spray the vault with multiple limit orders! 🎯
First layer: 147.600
Second layer: 147.400
Third layer: 147.200
👉 Add more layers if you want a deeper pullback entry – the more locks you pick, the bigger the loot! 🏦💎
🛑 Thief Stop Loss
This is Thief SL 🔒: 146.500
But remember, dear ladies & gentlemen (Thief OG’s) – adjust your SL based on your own strategy, capital & risk appetite. Stay slick, don’t get caught! 🚔💨
🎯 Target Escape Zone
Police barricade spotted 🚨👮 @ 150.700
Our heist exit point is locked at 150.000 🏃♂️💨
👉 Make sure you grab the loot & escape before the cops arrive. Take profit & celebrate with stolen sushi 🍣 & sake 🍶!
⚠️ Thief Trading Notes
News drops = extra police patrols 🚔 – avoid opening fresh entries during major releases.
Trail your stops to lock in profits – no thief leaves empty-handed!
Stay alert to price traps – don’t get stuck behind enemy lines.
💎 If this heist plan made you some loot, smash that 💖 & BOOST button to power up the Thief Gang 🚀🤝💰
The more boosts, the bigger our robbery squad becomes!
Stay tuned, Ninjas 🐱👤 … the next heist plan is already loading.
💵💎🚀 Thief Trader OUT.
USDJPY : LONG OPPORTUNITY, MOMENTUM BREWING NICELY FOR UPSIDERefer to trendline drawn on chart. USDJPY is heading to retest 151.
Long @ 147.60
TP 150.80
SL 146.05
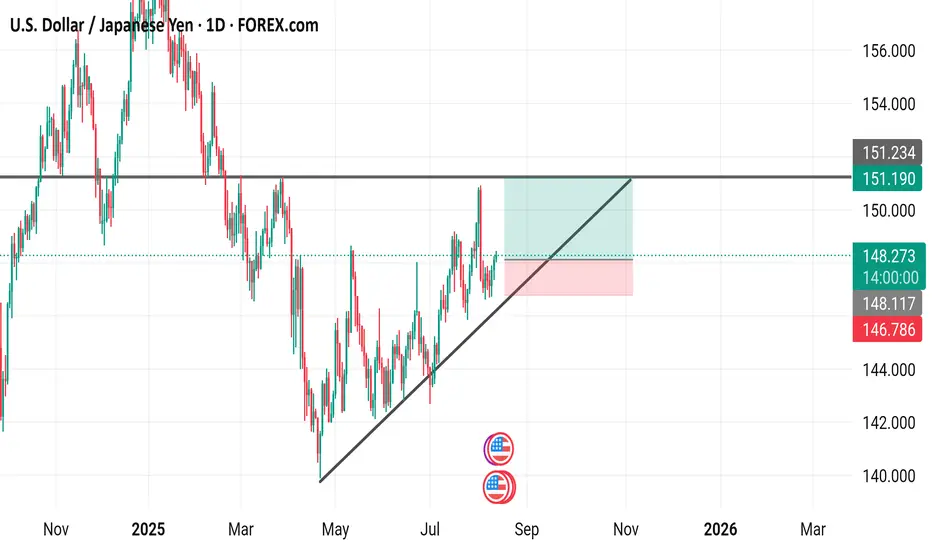
USD/JPY 1D Forex Chart - August 12, 2025daily performance of the U.S. Dollar (USD) against the Japanese Yen (JPY) as of August 12, 2025. The current exchange rate is 148.277, reflecting a 0.09% increase (+0.136). The chart includes a trendline indicating a potential upward movement, with a buy signal at 148.277 and a sell signal at the same level. Key support and resistance levels are marked, with a notable range between 146.786 and 151.234. The chart spans from early 2025 to mid-2026, showing historical price action and future projections.
USDJPY Bullish scenarioUSDJPY shows us clear bullish setup after the breakout of long accumulation box
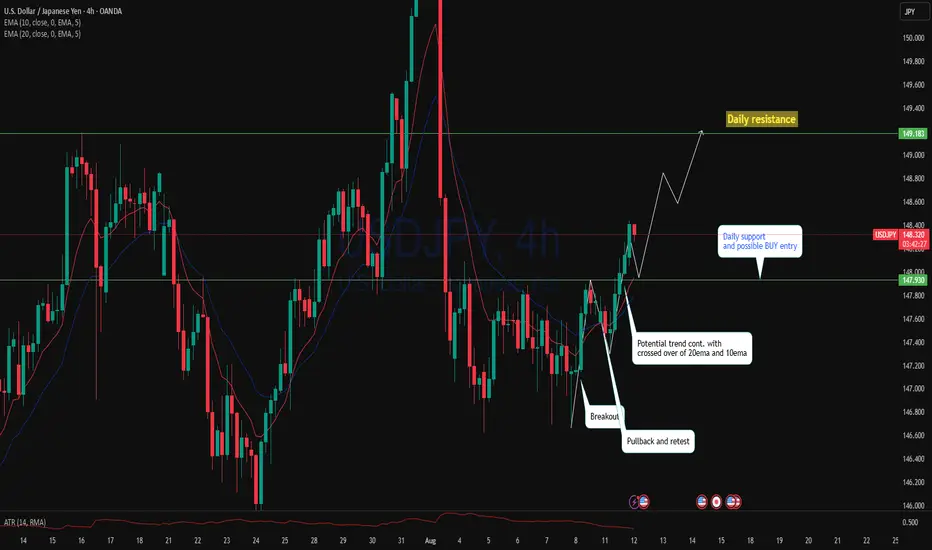
USDJPY potential buy area!USDJPY 4H price has formed 2 important impulse and started to move back to the upside with new series of higher high and higher low showing a potential trend continuation.
Daily price is just crossed above 10ema and may pullback to daily 10ema which is also 4h support an important level where a bullish trade is high probale.
USD/JPY Poised for Breakout as Fundamentals & Technicals AlignUSDJPY is entering a critical juncture where both macroeconomic conditions and price structure are pointing toward a potential bullish continuation. The pair has been consolidating just under a descending trendline after a sharp drop from July’s highs, but strong US fundamentals, a persistently dovish Bank of Japan, and upcoming political catalysts are creating the perfect environment for an upside breakout. If buyers can reclaim momentum above near-term resistance, the path toward retesting multi-month highs appears open, with yen crosses likely to follow the lead.
Technical Analysis (4H Chart)
Price is consolidating around 147.46 after falling from the 150.91 high.
A descending trendline from the late-July peak is being tested. A confirmed breakout would likely accelerate bullish momentum.
Key upside targets:
148.96 – immediate resistance & short-term target (previous swing high).
150.91 – major resistance at July’s high.
Stop-loss at 146.43 safeguards against deeper retracements.
The structure reflects a series of bullish continuation patterns (flags, breakouts, retracements).
Fundamental Analysis
Current Bias: Bullish
USD Strength: Strong US data and anticipation of Trump’s “major” economic announcement are lifting the dollar.
JPY Weakness: Despite better-than-expected Japan Eco Watchers Survey, the BoJ’s ultra-loose stance continues to suppress yen demand.
Rate Differentials: Still heavily in USD’s favor, sustaining upward pressure on USD/JPY.
Risk Sentiment: Even with mild geopolitical tensions, USD’s safe-haven appeal is preventing JPY from benefiting.
Risks:
Disappointing US political announcements.
Hawkish surprises from the BoJ.
Sharp swings in risk sentiment favoring the yen.
Key News/Events Ahead:
Trump’s economic policy reveal.
US CPI & PPI releases.
BoJ policy signals or commentary.
Leader/Lagger Dynamics:
USDJPY is the leader for yen crosses, often setting the tone for GBPJPY, AUDJPY, and CHFJPY.
Summary:
USDJPY’s bullish outlook is reinforced by the combination of favorable fundamentals and a technical setup pointing toward a breakout. A move above 147.80–148.00 could open the door to 148.96 in the short term and 150.91 in the medium term. With yen crosses closely tied to USDJPY’s movements, this pair’s breakout could spark broader JPY weakness across the board, making it a pivotal chart to watch in the days ahead.

USD/JPY) support boost Bullish Trend Read The captionSMC Trading point update
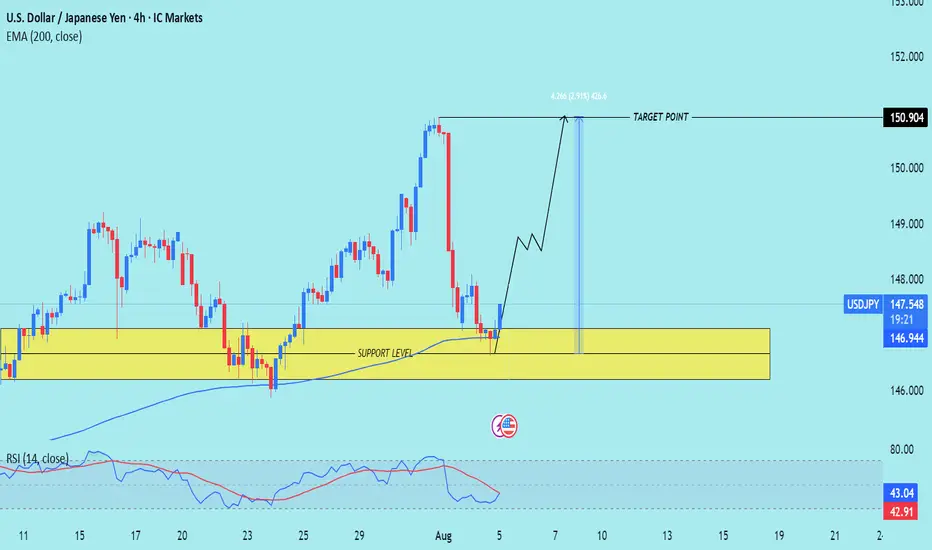
Technical analysis of USD/JPY on the 4-hour timeframe, based on a rejection from a key support zone and signs of trend continuation toward a higher target.
---
Technical Breakdown:
1. Support Level:
Price has bounced from a clearly defined support zone around 146.00 – 146.50, which has held multiple times in the past.
This zone is acting as a strong demand area where buyers are stepping in.
2. Bullish Rejection + Structure:
A bullish candle has formed from the support area, signaling potential reversal.
The drawn projection suggests higher highs and higher lows forming — indicating bullish continuation.
3. EMA (200):
Price has respected the 200 EMA (blue line), bouncing off it — a strong confluence for bullish trend continuation.
EMA is slightly upward sloping, indicating a longer-term bullish bias remains intact.
4. RSI (14):
RSI is rising from oversold territory (42.09), indicating a bullish momentum shift.
A potential bullish divergence might be forming (price made lower low, RSI made higher low).
5. Target Point:
Price is projected to reach 150.904, giving a potential move of ~2.91% (426 pips) from current levels.
---
Trade Idea Summary:
Bias: Bullish
Entry Zone: 146.90 – 147.30 (current levels or slight pullback)
Stop Loss: Below the support zone (~145.90)
Take Profit (TP): 150.900 (key resistance / previous high)
Risk-to-Reward Ratio: Attractive, based on the size of the support zone vs. projected move
Mr SMC Trading point
---
Key Insights:
Strong confluence between price structure, support zone, and 200 EMA bounce.
Favorable risk-reward ratio for swing or intraday traders.
Best confirmation would come from a bullish engulfing candle or break above minor resistance near 147.80.
Please support boost 🚀 this analysis)
USDJPY BUYThe year will be politically marked by Trump’s return to the White House. A Republican government is seen as positive for financial markets, but Trump’s pledge to cut taxes and impose tariffs on foreign goods and services may introduce uncertainty to both the political and economic landscape.
In Japan, political uncertainty looms, as the ruling Liberal Democratic Party (LDP) lacks a parliamentary majority and may call fresh elections. An LDP victory could strengthen the Yen by ensuring stability, while opposition gains might lead to fiscal expansion and weaken the currency. If no elections occur, a modest budget would likely keep the Yen supported.
In terms of monetary policy, the Fed and BoJ are set to diverge in monetary policy. The Fed expects to deliver only two additional rate cuts in 2025, the BoJ is expected to maintain its dovish stance, avoiding rate hikes amid weak inflation and a shrinking economy, leaving the Yen vulnerable to market disappointment over policy inaction
SUPPORT 149.232
SUPPORT 148.598
SUPPORT 147.963
RESISTANCE 147.285
RESISTANCE 146.913

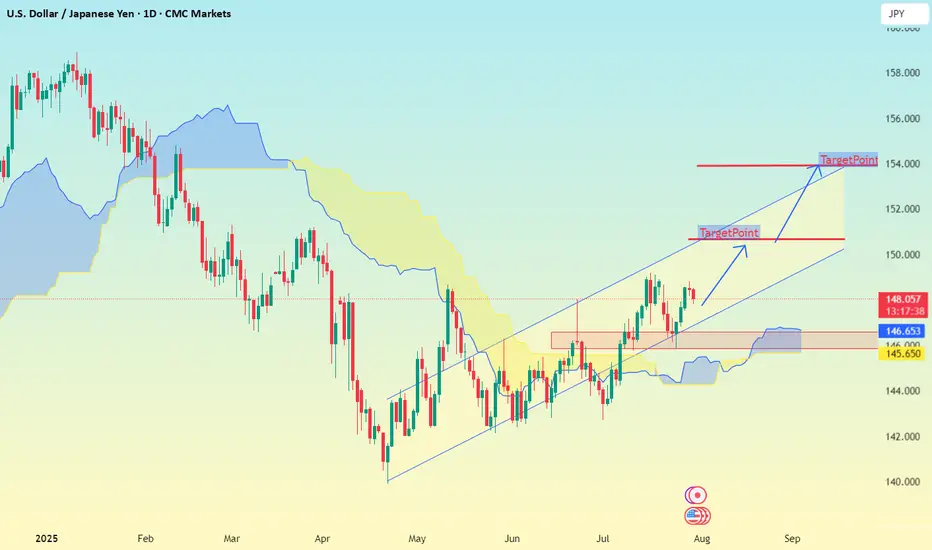
USD/JPY on the 1D timeframeBased on the chart I provided for USD/JPY on the 1D timeframe, here is the target analysis:
📉 Downtrend Analysis:
The chart is showing a descending channel, indicating a bearish trend.
Price has been respecting the upper and lower bounds of the channel.
Two target zones are marked with labels “TakeProfit”, suggesting projected bearish targets.
🎯 Identified Targets:
1. First Target Zone (TakeProfit):
📍 Around 152.00
This is the first expected support area where price may bounce or consolidate.
2. Second Target Zone (TakeProfit):
📍 Around 146.50 – 146.00
This level aligns with historical support and volume profile concentration.
#USDJPY: Swing Buy Almost +2000 Pips! Dear Traders,
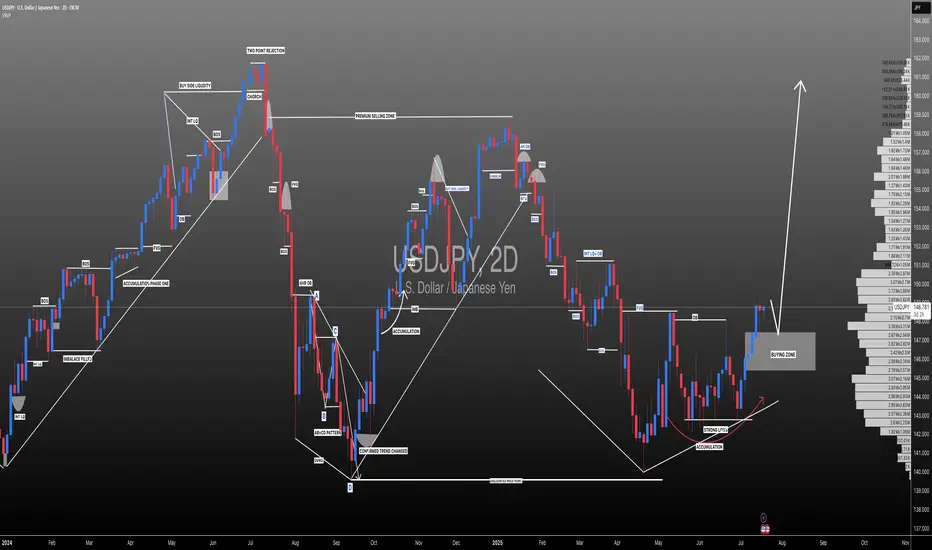
The USDJPY currency pair appears to be in an accumulation phase at the moment, as evidenced by the lack of significant price movement throughout the current week. Several factors contribute to this trend.
Firstly, several significant economic events are scheduled for this week, particularly tomorrow and Friday. These developments will have substantial implications for the future trajectory of the USDJPY pair. Consequently, there’s a possibility that the price may experience a decline before initiating a bullish trend. We’ve recently seen a strong bullish candle, which suggests a strong bullish move in the coming weeks. Additionally, the strong USD could continue rising, while the JPY is dropping.
Secondly, there are two primary areas where the price could reverse its course. The extent to which the USD reacts to the economic data will indicate potential reversal zones.
It’s crucial to conduct your own analysis before making any financial decisions. This chart should be used solely for educational purposes and does not guarantee any specific outcome.
Regarding the stop loss, as this is a swing trade, it’s advisable to employ a larger stop loss if the price reaches entry zones. The take profit level can be determined based on your entry type and analysis.
We wish you the best of luck in your trading endeavours and emphasise the importance of trading safely.
Please share this analysis with others through likes, comments, and social media platforms. If you have any questions or require further assistance, don’t hesitate to comment below. We’re here to provide support.
Team Setupsfx_
❤️🚀
USD/JPY 4-Hour Forex Chart4-hour chart from FOREX.com displays the exchange rate between the U.S. Dollar (USD) and the Japanese Yen (JPY). The current rate is 147.446, with a slight increase of 0.072 (+0.05%). The chart shows recent price movements, including a notable drop within a highlighted support and resistance zone (light green and pink areas). Buy and sell prices are marked at 147.446 and 147.444, respectively, with additional price levels indicated on the right side ranging from 146.943 to 149.000. The chart includes candlestick patterns and is timestamped up to July 22, 2025.

U.S. Dollar / Japanese Yen - 4h Chart (FOREX.com)4-hour chart from FOREX.com shows the exchange rate between the U.S. Dollar (USD) and the Japanese Yen (JPY). The current rate is 148.184, reflecting a decrease of 0.623 (-0.42%) as of 01:29:16. The chart highlights recent price movements over the past few hours, with a shaded area indicating a consolidation phase around the current level.

#USDJPY: Price is currently accumulating ! Wait For DistributionAt present, the USDJPY currency pair appears to be in an accumulation phase, as evidenced by the absence of significant price movement throughout the current week. Several factors contribute to this trend.
Firstly, several significant economic events are scheduled for this week, particularly tomorrow and Friday. These developments hold substantial implications for the future trajectory of the USDJPY pair. Consequently, there exists a possibility that the price may experience a decline prior to initiating a bullish trend.
Secondly, there are two primary areas where the price could reverse its course. The extent to which the USD reacts to the economic data will serve as an indicator of the potential reversal zones.
It is imperative that you conduct your own analysis before making any financial decisions. This chart should be utilised solely for educational purposes and does not guarantee any specific outcome.
Regarding the stop loss, as this is a swing trade, it is advisable to employ a larger stop loss if the price reaches entry zones. The take profit level can be determined based on your entry type and analysis.
We wish you the best of luck in your trading endeavours and emphasise the importance of trading safely.
Kindly share this analysis with others through likes, comments, and social media platforms. If you have any questions or require further assistance, please do not hesitate to comment below. We are here to provide support.
Team Setupsfx_
❤️🚀
USD/JPY(20250717)Today's AnalysisMarket news:
The annual rate of PPI in the United States in June was 2.3%, lower than the expected 2.5%, the lowest since September 2024, and the previous value was revised up from 2.6% to 2.7%. Federal Reserve Beige Book: The economic outlook is neutral to slightly pessimistic. Manufacturing activity declined slightly, and corporate recruitment remained cautious.
Technical analysis:
Today's buying and selling boundaries:
147.97
Support and resistance levels:
150.23
149.38
148.84
147.11
146.56
145.72
Trading strategy:
If it breaks through 147.97, consider buying in, and the first target price is 148.84
If it breaks through 147.11, consider selling in, and the first target price is 146.56
USD/JPY 4-Hour Chart Analysis4-hour chart displays the price movement of the U.S. Dollar against the Japanese Yen (USD/JPY) from June to August 2025. The chart shows a significant upward trend in July, followed by a correction. Key levels are highlighted, including support at 147.031 and resistance at 150.130, with the current price at 148.809. The chart suggests a potential bullish continuation, as indicated by the upward arrow and green box, targeting higher levels above 150.000.
