USDJPY I Technical and Fundamental Analysis Welcome back! Let me know your thoughts in the comments!
** USDJPY Analysis - Listen to video!
We recommend that you keep this on your watchlist and enter when the entry criteria of your strategy is met.
Please support this idea with a LIKE and COMMENT if you find it useful and Click "Follow" on our profile if you'd like these trade ideas delivered straight to your email in the future.
Thanks for your continued support!
Usdjpyforecast

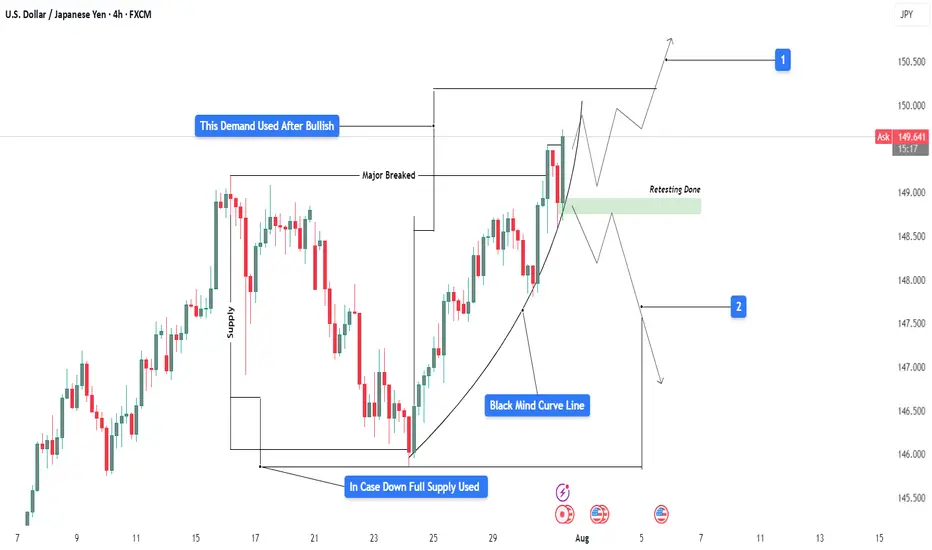
USDJPY 4H Analysis : Curve Breakout & Retest Completed + Bullish"Momentum Building Above Retested Demand – Will Bulls Take Control?"
📊 Market Structure Overview:
USDJPY has shown a clean bullish structure in recent sessions, supported by a strong demand retest and a steady parabolic curve formation (Black Mind Curve Line). The pair has successfully broken above a major resistance, retested it, and is now holding higher ground—suggesting potential for continued upside if current structure holds.
🧱 Detailed Technical Breakdown:
🔹 1. Demand & Retesting Behavior
The chart highlights a key demand zone (green box) that was previously used after a bullish move.
Price recently returned to this zone for a clean retest, validating its role as a strong support.
This type of retesting behavior is critical in smart money analysis, confirming that accumulation has occurred and sellers have been absorbed.
🔹 2. Major Breakout Confirmation
The previous major structure level has been decisively broken to the upside.
This level now acts as support, increasing the probability that the bullish move will sustain.
🔹 3. Black Mind Curve Line (Parabolic Structure)
A parabolic curved trendline supports the current price action, showing how bulls are gradually gaining momentum.
This curve represents buyer interest increasing over time, which often leads to an aggressive breakout when paired with retest confirmation.
📍 Key Price Zones:
Type Price Level (Approx.) Description
🔹 Retesting Zone ~148.800 – 149.100 Support zone after major breakout
🔺 Resistance Target (1) ~150.500 Bullish breakout target (short-term)
🔻 Downside Risk (2) ~147.000 – 146.500 Bearish invalidation zone if demand fails
🔹 Full Supply Area ~145.000 – 145.500 Historical supply zone if price fails completely
🔮 Trade Scenarios:
✅ Scenario 1 – Bullish Continuation (Primary Bias)
Retest is complete, and price is holding above the curve and demand zone.
If bullish momentum continues:
📈 Target 1: 150.50 – Near-term resistance and liquidity area
📈 Target 2: 151.20+ – Extension target if buyers dominate
Bullish Confirmation:
Price must stay above ~149.00 and continue forming higher highs.
Entry ideas: Wait for minor consolidation above current price or bullish breakout from mini range.
⚠️ Scenario 2 – Bearish Rejection
If price rejects from current level and breaks below the curve and demand zone (~148.80):
📉 First downside target: 147.00 (minor support)
📉 Final bearish target: 145.50 (full supply zone)
Bearish Confirmation:
Breakdown of curve support and close below the retesting zone with momentum.
Such a move would suggest buyers failed, and market may rotate lower.
🧠 Market Sentiment & Psychology:
Smart Money Behavior: Demand was filled cleanly and retested, indicating possible institutional interest at that level.
Momentum Curve: As shown by the black curve, momentum is rising gradually—this reflects confidence building among buyers.
However, price is near psychological resistance (150.00–150.50 zone), where heavy sell orders might be placed.
The market is in a decision zone, where confirmation of strength or failure will dictate the next 200–300 pip move.
🎯 Summary:
USDJPY is showing a bullish structure supported by:
A valid retest of demand
A clean breakout of major resistance
An ascending parabolic curve
If bulls defend the current zone, we may see a powerful continuation toward 150.50+. If price fails to hold above the retest zone, downside risks open toward 147.00 and potentially the full supply at 145.00.
📌 Trade Smart: Wait for price confirmation, manage risk with stop placement below the demand zone or structure lows, and avoid chasing the move.
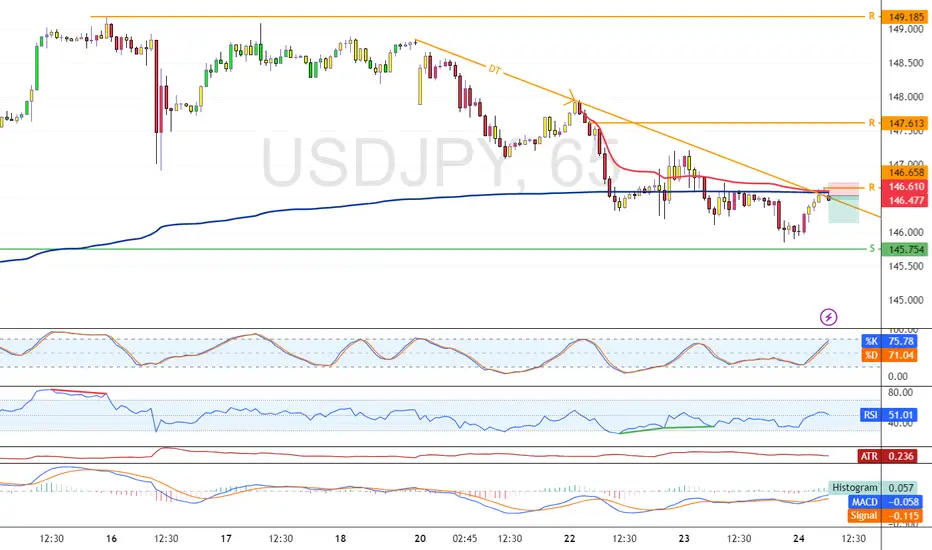
USD/JPY Tests Pivotal Resistance in Bearish ContextFenzoFx—USD/JPY is testing the support at 146.6. This level is backed by anchored VWAP and the descending trendline.
From a technical perspective, the downtrend should resume if this level holds. In this scenario, the next bearish target could be 145.7. Furthermore, if the selling pressure exceeds this level, the price could fall toward the support at 144.1.
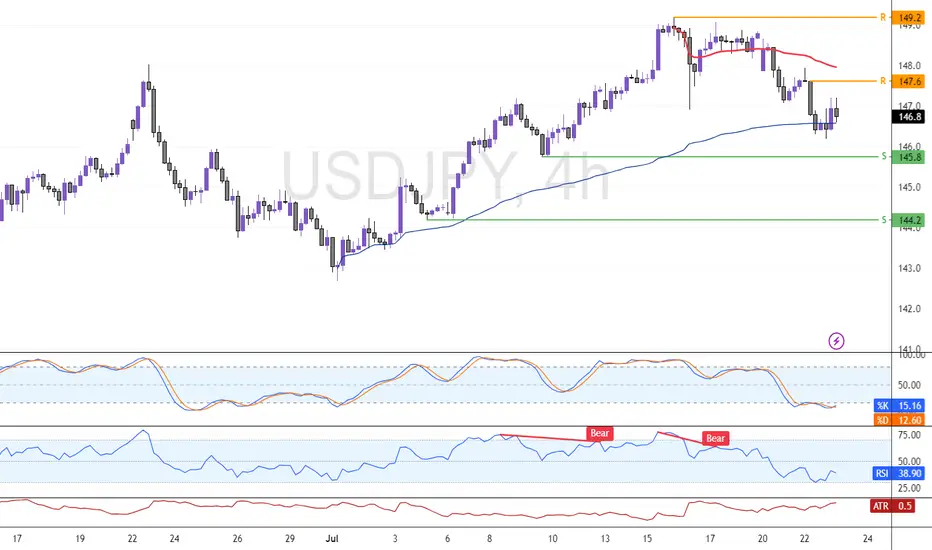
USD/JPY: Bearish Setup Looms Below VWAP ZoneUSD/JPY dipped as expected, currently testing the VWAP as support while Stochastic signals the Yen is overpriced in the short term.
Resistance is at 147.6, backed by the bearish VWAP. It is likely the pair will rise and test this level. Furthermore, a new bearish wave can potentially emerge if 147.6 holds. In this scenario, the next target could be the support at 145.8 followed by 144.2.
USD/JPY Faces Rejection at 148.6, Bearish Setup EmergesFenzoFx—USD/JPY began a bearish wave after the 148.6 resistance rejected the price. As of this writing, the currency pair flipped below the ascending trendline and formed a bearish FVG at 147.9.
A pullback toward the FVG can provide a premium price to go short on USD/JPY, targeting 146.9, followed by 145.7.

Still keeping a close eye on a potential USD pop...Although the EUR/USD and GBP/USD popped higher late last week, I'm still keeping a close eye to stay short on the EUR/USD considering the bearish rising broadening pattern coupled with a yearly pivot point inter-median level and negative divergence on the MACD. This is all based on the daily chart.
Many factors are in play right now with what's going on between Israel and Iran along with FOMC this week and Tariffs still in play.
On a purely technical analysis point of view, I potentially expect a bullish retracement in the USD while remaining long term bearish across the board.
we'll see how this one develops.
Good Luck & Trade Safe.

USDJPY and GBPJPY Analysis todayHello traders, this is a complete multiple timeframe analysis of this pair. We see could find significant trading opportunities as per analysis upon price action confirmation we may take this trade. Smash the like button if you find value in this analysis and drop a comment if you have any questions or let me know which pair to cover in my next analysis.

USDJPY I Trading Plan and Forecast Welcome back! Let me know your thoughts in the comments!
** USDJPY Analysis - Listen to video!
We recommend that you keep this pair on your watchlist and enter when the entry criteria of your strategy is met.
Please support this idea with a LIKE and COMMENT if you find it useful and Click "Follow" on our profile if you'd like these trade ideas delivered straight to your email in the future.
Thanks for your continued support!Welcome back! Let me know your thoughts in the comments!

USDJPY starting bullish move?Hello traders, this is a complete multiple timeframe analysis of this pair. We see could find significant trading opportunities as per analysis upon price action confirmation we may take this trade. Smash the like button if you find value in this analysis and drop a comment if you have any questions or let me know which pair to cover in my next analysis.

USDJPY Analysis todayHello traders, this is a complete multiple timeframe analysis of this pair. We see could find significant trading opportunities as per analysis upon price action confirmation we may take this trade. Smash the like button if you find value in this analysis and drop a comment if you have any questions or let me know which pair to cover in my next analysis.

USDJPY and GBPJPY Analysis todayHello traders, this is a complete multiple timeframe analysis of this pair. We see could find significant trading opportunities as per analysis upon price action confirmation we may take this trade. Smash the like button if you find value in this analysis and drop a comment if you have any questions or let me know which pair to cover in my next analysis.

USDJPY ready for another drop?After daily break of structure USDJPY just has managed to form another head and shoulder with strong liquidity grab has started to move in the major direction of the trend. After yesterdays drop, price today so far has done pullback and formed another possible bearish market structure.
As of upcoming USD and JPY news may push that price back to the support as shown in sketch.
A sell trade is high probability
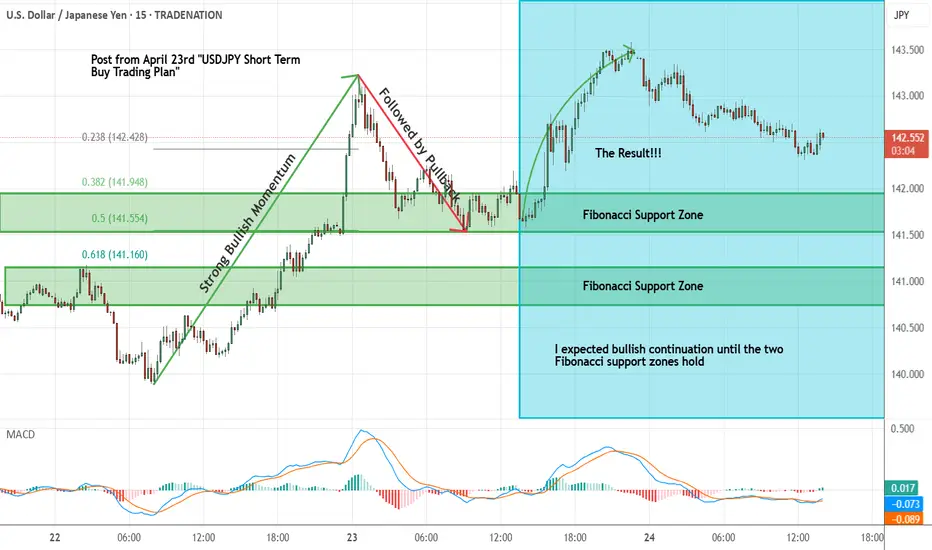
USDJPY Short Term Buy Trading Plan Update!!!Hi Traders, on April 23rd I shared this idea "USDJPY Short Term Buy Trading Plan"
I expected bullish continuation higher from the marked Fibonacci support zones. You can read the full post using the link above.
Price reached the first Fibonacci support zone, respected it and bounced higher as expected!!!
If you enjoy this idea, don’t forget to LIKE 👍, FOLLOW ✅, SHARE 🙌, and COMMENT ✍! Drop your thoughts and charts below to keep the discussion going. Your support helps keep this content free and reach more people! 🚀
-------------------------------------------------------------------------------------------------------------------
Disclosure: I am part of Trade Nation's Influencer program and receive a monthly fee for using their TradingView charts in my analysis.
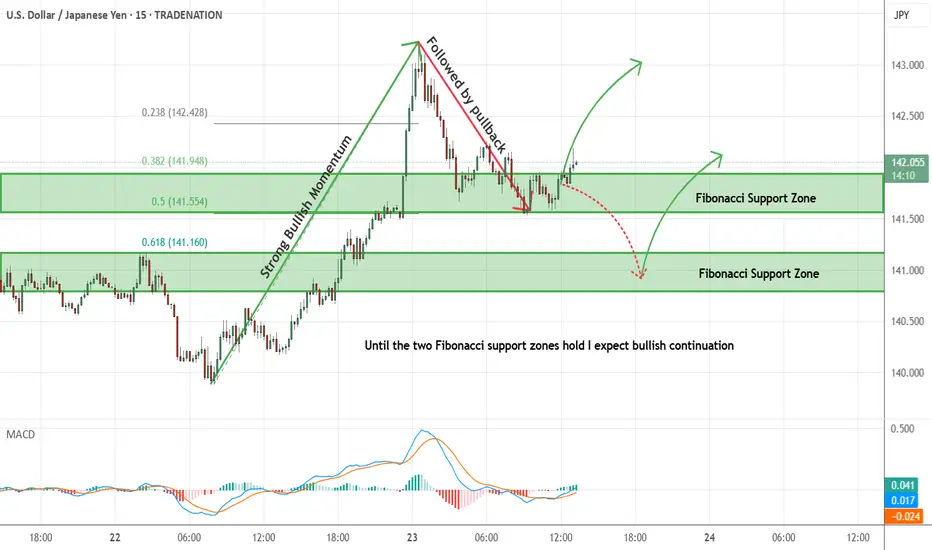
USDJPY Short Term Buy Trading PlanM15 - Strong bullish momentum followed by a pullback
No opposite signs
Expecting bullish continuation until the two Fibonacci support zones hold.
If you enjoy this idea, don’t forget to LIKE 👍, FOLLOW ✅, SHARE 🙌, and COMMENT ✍! Drop your thoughts and charts below to keep the discussion going. Your support helps keep this content free and reach more people! 🚀
--------------------------------------------------------------------------------------------------------------------
Disclosure: I am part of Trade Nation's Influencer program and receive a monthly fee for using their TradingView charts in my analysis.
Market Analysis: USD/JPY Eyes Fresh IncreaseMarket Analysis: USD/JPY Eyes Fresh Increase
USD/JPY is rising and might gain pace above the 142.45 resistance.
Important Takeaways for USD/JPY Analysis Today
- USD/JPY climbed higher above the 141.00 and 141.65 levels.
- There was a break above a connecting bearish trend line with resistance at 141.20 on the hourly chart at FXOpen.
USD/JPY Technical Analysis
On the hourly chart of USD/JPY at FXOpen, the pair started a fresh upward move from the 140.00 zone. The US Dollar gained bullish momentum above 141.65 against the Japanese Yen.
There was a break above a connecting bearish trend line with resistance at 141.20. It even cleared the 50-hour simple moving average and 142.45. The pair climbed above 143.00 and traded as high as 143.21 before there was a downside correction.
The pair dipped below the 23.6% Fib retracement level of the upward move from the 139.88 swing low to the 143.21 high. The current price action above the 141.65 level is positive.
Immediate resistance on the USD/JPY chart is near 142.45. The first major resistance is near 143.20. If there is a close above the 143.20 level and the RSI moves above 75, the pair could rise toward 144.50.
The next major resistance is near 145.00, above which the pair could test 148.00 in the coming days. On the downside, the first major support is 141.65 and the 50% Fib retracement level of the upward move from the 139.88 swing low to the 143.21 high.
The next major support is visible near the 141.00 level. If there is a close below 141.00, the pair could decline steadily. In the stated case, the pair might drop toward the 139.90 support zone. The next stop for the bears may perhaps be near the 137.50 region.
This article represents the opinion of the Companies operating under the FXOpen brand only. It is not to be construed as an offer, solicitation, or recommendation with respect to products and services provided by the Companies operating under the FXOpen brand, nor is it to be considered financial advice.
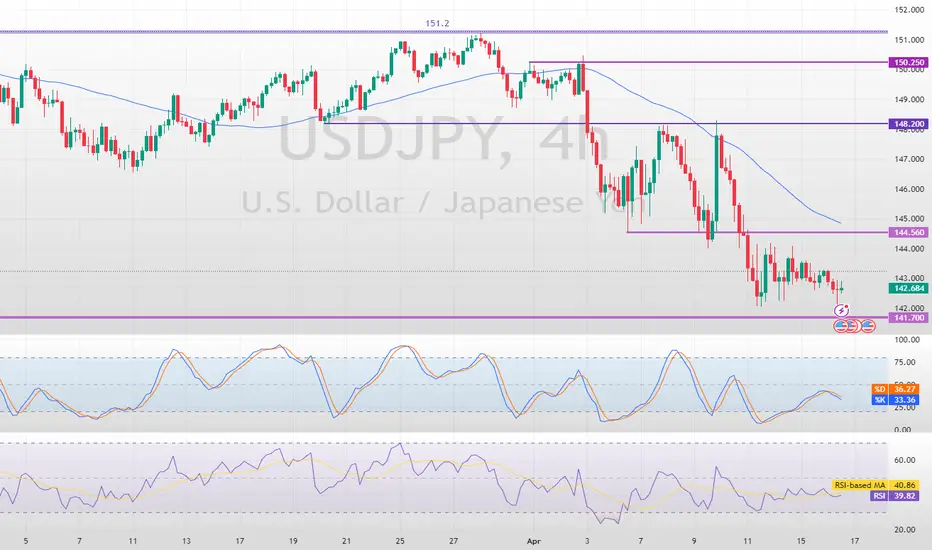
Bearish Momentum Eases at 141.70 Support in USD/JPYFenzoFx—The USD/JPY currency pair resumed its bearish trend after breaking below 144.56 but steadied at the 141.70 support level. Indicators show sideways movement, reflecting a lack of momentum.
With the price below the 50-period moving average, the bearish outlook persists. If the pair stabilizes below 141.70, the downtrend may deepen, while surpassing 144.56 could pave the way for a rise toward 148.20.
>>> No Deposit Bonus
>>> %100 Deposit Bonus
>>> Forex Analysis Contest
All at F enzo F x Decentralized Forex Broker
USDJPY and USDCAD analysis todayHello traders, this is a complete multiple timeframe analysis of this pair. We see could find significant trading opportunities as per analysis upon price action confirmation we may take this trade. Smash the like button if you find value in this analysis and drop a comment if you have any questions or let me know which pair to cover in my next analysis.

USDJPY Analysis todayHello traders, this is a complete multiple timeframe analysis of this pair. We see could find significant trading opportunities as per analysis upon price action confirmation we may take this trade. Smash the like button if you find value in this analysis and drop a comment if you have any questions or let me know which pair to cover in my next analysis.

USDJPY and GBPJPY Analysis todayHello traders, this is a complete multiple timeframe analysis of this pair. We see could find significant trading opportunities as per analysis upon price action confirmation we may take this trade. Smash the like button if you find value in this analysis and drop a comment if you have any questions or let me know which pair to cover in my next analysis.

USDJPY Breakdown?Hello traders, this is a complete multiple timeframe analysis of this pair. We see could find significant trading opportunities as per analysis upon price action confirmation we may take this trade. Smash the like button if you find value in this analysis and drop a comment if you have any questions or let me know which pair to cover in my next analysis.

USD Bear is here: Important Analysis on FX Pairs, Stock MarketIn this video I got over some important outlooks on the EUR/USD, GBP/USD and USD/JPY along with outlook on the stock market.
The U.S. Dollar has been getting absolutely crushed along with the stock market which usually has the opposite effect. Considering we may be into a stagflation scenario, this is not surprising.
Tariffs have spiked volatility and puts the Federal Reserve in a very tight spot of Interest Rate Policy. Interesting times ahead to say the least.
From a pure technical analysis point of view, the USD may be set for much further losses as monthly patterns suggest a big move may be on the horizon. Will be keeping a very close eye on these as we move forward in these stormy waters of the U.S. economy.
As always, Good Luck & Trade Safe.

USDJPY Analysis todayHello traders, this is a complete multiple timeframe analysis of this pair. We see could find significant trading opportunities as per analysis upon price action confirmation we may take this trade. Smash the like button if you find value in this analysis and drop a comment if you have any questions or let me know which pair to cover in my next analysis.

USDJPY Analysis todayHello traders, this is a complete multiple timeframe analysis of this pair. We see could find significant trading opportunities as per analysis upon price action confirmation we may take this trade. Smash the like button if you find value in this analysis and drop a comment if you have any questions or let me know which pair to cover in my next analysis.
