USDJPY I Technical and Fundamental Analysis Welcome back! Let me know your thoughts in the comments!
** USDJPY Analysis - Listen to video!
We recommend that you keep this on your watchlist and enter when the entry criteria of your strategy is met.
Please support this idea with a LIKE and COMMENT if you find it useful and Click "Follow" on our profile if you'd like these trade ideas delivered straight to your email in the future.
Thanks for your continued support!
Usdjpyidea

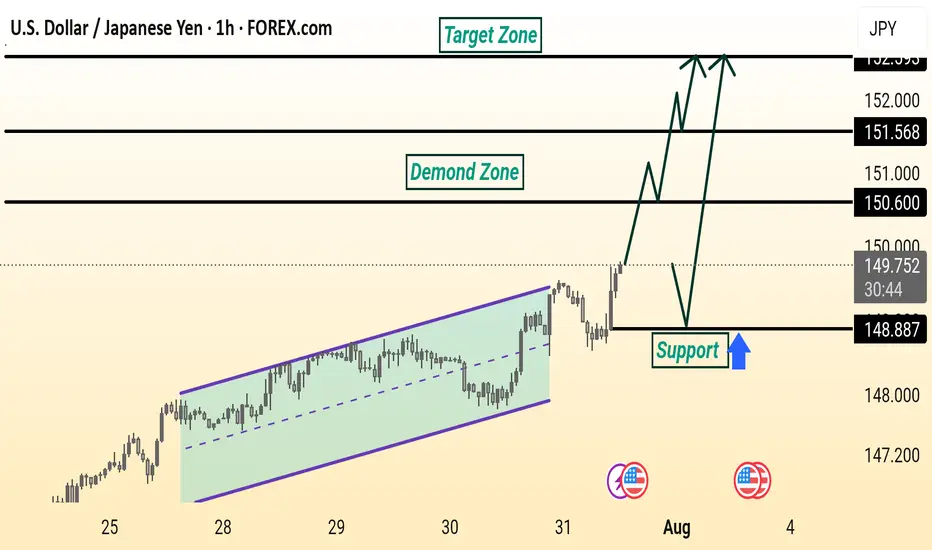
USD/JPY Analysis is Ready USD/JPY is showing a bullish setup. Price broke out of a rising channel and is expected to retest the 148.887 support level before moving higher toward the 150.600 and 151.568 resistance zones, targeting the 152.000 area. The demand zone adds strength to the potential upside.
USD/JPY) Bullish Trend Read The captionSMC Trading point update
Technical analysis of USD/JPY on the 4-hour timeframe, with a focus on a support-resistance structure and trend
---
Technical Breakdown:
1. Market Structure:
Price is moving in a clear uptrend, making higher highs and higher lows.
A recent pullback into a support zone suggests potential for a bullish continuation.
2. Key Zones:
Support Zone: Around 147.00–147.50, highlighted in yellow — the area where price recently bounced.
Resistance Zone: Around 148.800–149.300, which price is expected to break through.
Target Point: Clearly marked at 150.519, aligning with the prior high and a projected bullish extension.
3. EMA (200):
The 200 EMA (blue) is at 146.489, far below current price — signaling strong bullish momentum.
4. RSI (14):
RSI is at 61.14, showing bullish momentum without being overbought — supportive of further upside.
No divergence is noted, which supports trend continuation.
5. Projection (Drawn Path):
The chart suggests price may bounce from support, break through resistance, and rally toward 150.519, possibly after a retest of the resistance-turned-support.
Mr SMC Trading point
---
Trade Idea Summary:
Bias: Bullish
Entry Zone: Near 147.00–147.50 (support)
Confirmation: Bullish candlestick pattern or strong bounce
Target: 150.519
Invalidation: Break and close below 146.489 (200 EMA) or sustained move below support zone
---
Please support boost 🚀 this analysis)

#USDJPY: Swing Buy Almost +2000 Pips! Dear Traders,
The USDJPY currency pair appears to be in an accumulation phase at the moment, as evidenced by the lack of significant price movement throughout the current week. Several factors contribute to this trend.
Firstly, several significant economic events are scheduled for this week, particularly tomorrow and Friday. These developments will have substantial implications for the future trajectory of the USDJPY pair. Consequently, there’s a possibility that the price may experience a decline before initiating a bullish trend. We’ve recently seen a strong bullish candle, which suggests a strong bullish move in the coming weeks. Additionally, the strong USD could continue rising, while the JPY is dropping.
Secondly, there are two primary areas where the price could reverse its course. The extent to which the USD reacts to the economic data will indicate potential reversal zones.
It’s crucial to conduct your own analysis before making any financial decisions. This chart should be used solely for educational purposes and does not guarantee any specific outcome.
Regarding the stop loss, as this is a swing trade, it’s advisable to employ a larger stop loss if the price reaches entry zones. The take profit level can be determined based on your entry type and analysis.
We wish you the best of luck in your trading endeavours and emphasise the importance of trading safely.
Please share this analysis with others through likes, comments, and social media platforms. If you have any questions or require further assistance, don’t hesitate to comment below. We’re here to provide support.
Team Setupsfx_
❤️🚀
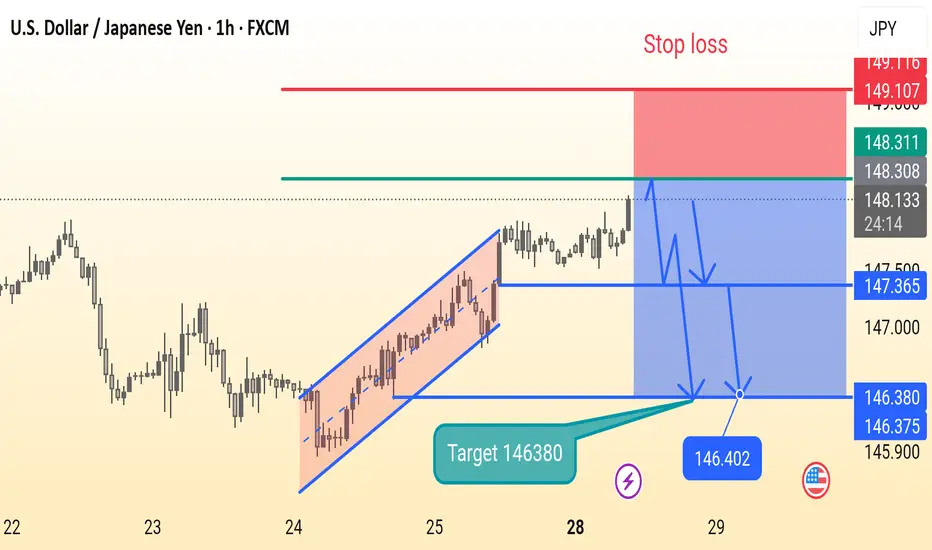
Usdjpy setupThis is a 1-hour USD/JPY chart showing a potential short (sell) trade setup. After a rising channel breakout, the price is consolidating. The chart suggests a bearish move with a target at 146.380 and a stop loss at 149.107. Key support levels are marked at 147.365 and 146.380.
USD/JPY) Bullish Analysis Read The captionSMC Trading point update
Technical analysis of USD/JPY on the 4-hour timeframe, signaling a potential rally toward the 149.191–149.202 resistance zone. Here's the full breakdown
---
Technical Analysis – USD/JPY (4H)
1. Fair Value Gap (FVG) Support
Price recently filled a Fair Value Gap (FVG) level (yellow box) and is now pulling back toward it.
The FVG zone is expected to act as a support and potential entry point for buyers (marked by the green upward arrow).
2. Uptrend Structure
Price is moving within an ascending trendline, suggesting bullish market structure.
The current retracement is seen as a higher low setup, aligning with bullish continuation logic.
3. 200 EMA as Support
The 200 EMA at 146.198 is providing dynamic support.
Confluence between the EMA, FVG, and ascending trendline strengthens the bullish bias.
4. Resistance Target Zone
The projected target zone is between 149.191–149.202, which aligns with a previous high and key resistance level.
This zone is highlighted as the final take-profit area.
5. RSI Momentum
RSI is at 57.11, showing positive momentum but not yet overbought — which supports further upside.
RSI remains above 50, maintaining bullish momentum.
Mr SMC Trading point
---
Summary
Bias: Bullish
Current Price: 147.653
Support Zone (FVG): 146.20–146.92 (approx)
Trendline Support: Uptrend line intact
200 EMA: Acting as dynamic support (146.198)
Resistance Target: 149.191–149.202
RSI: 57.11 – healthy bullish momentum
plesse support boost 🚀 this analysis)

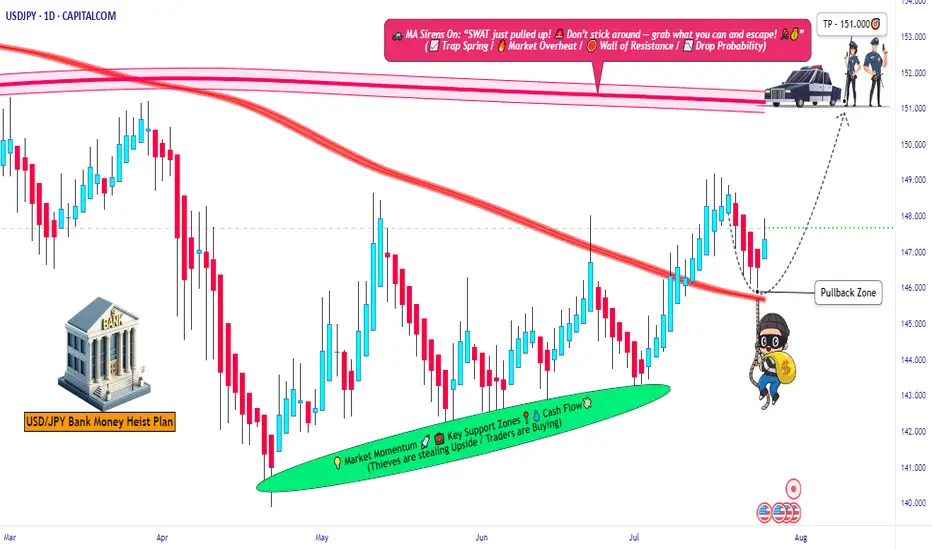
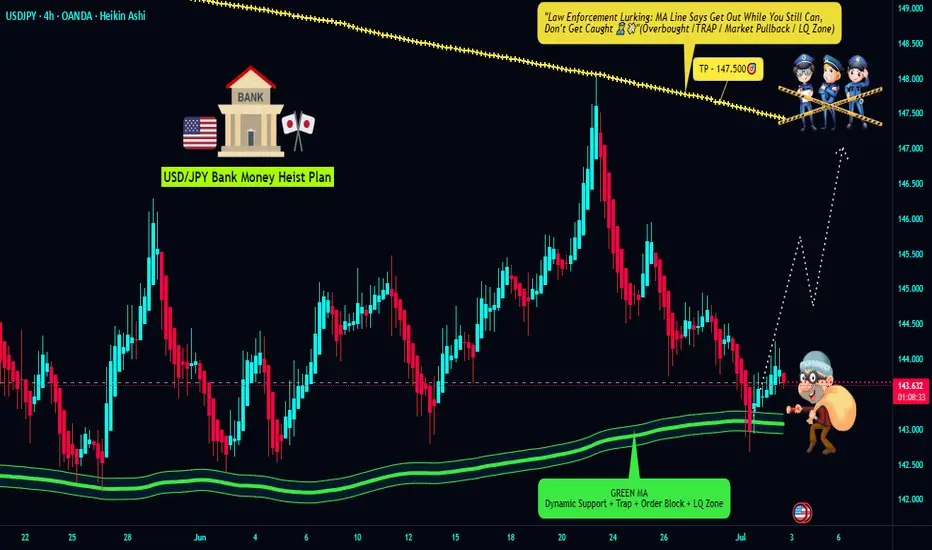
USD/JPY Robbery Route | Enter at Dip, Exit Before Police💥USD/JPY Forex Money Heist Plan 🎯 — Ninja Robbery at 146.000💥
🌟 Hi! Hola! Ola! Bonjour! Hallo! Marhaba! 🌟
Dear Market Bandits, Money Makers & Risky Robbers 🤑💰💸✈️
Welcome to another Thief Trader-style operation. We've cracked open the USD/JPY vault (aka "The Gopher" 💹), and here's the blueprint to pull off this forex heist like true professionals. 💼🎭💵
🚨 Strategy Overview
This isn't just a trade – it’s a well-researched, precision-timed robbery mission based on technicals, macro analysis, sentiment, and the bigger global picture.
Expect action near critical zones – especially the moving average barricade, where police (aka risk) is waiting. Stay sharp.
🔓 Entry Point – Unlock the Vault
📈 Watch for bullish pullbacks near 146.000.
Whether it's a dip, zone test, or wick bounce — you’re looking to layer buy limit orders like a seasoned thief using DCA tactics.
Enter on swings or any bullish confirmation.
Heist Window is Open.
🛑 Stop Loss – Escape Route
📍 SL near 143.000 (1D swing low) — adjust based on your capital and position size.
💡 Don’t go blind — SL is your backup plan, not an optional accessory.
Custom-fit it based on how many entries you’re stacking.
🎯 Target – Vault Exit Point
🏁 151.000 or exit before resistance heat catches on.
No greedy thieves here — precision exit is key.
Lock profits, vanish in style. 🕶️💼💸
🧲 Scalpers Take Note
Only long side raids are valid. Scalping against the trend? That's walking into a trap.
Use trailing SLs and protect your loot.
Small bag or big vault — play your game smart. 🎯💰
📢 Fundamental Boosters
USD/JPY’s bullish run isn’t random — it’s backed by:
📊 Macro shifts,
📈 COT reports,
🧠 Sentiment drivers,
📉 Intermarket trends,
And a whole mix of thief-level intel 🔍
🧭 Dive deeper before acting. The map’s been provided. 🔗🌍
🗞 News Traps Ahead – Move Cautiously
🚫 Avoid new trades during major releases
🔁 Use trailing SLs on open positions
💡 Position management is a thief’s best defense. Risk management keeps you in the game. 🎯🧠
🔥💖 Support the Heist Crew
Smash that ❤️🔥 Boost Button to keep our robbery engine running.
Each boost = strength for our crew.
💬 Share the love, spread the intel, and trade like a rogue with brains. 🤝💵
👀 Stay tuned for more high-profile FX heists from Thief Trader.
Until next time — loot wisely, vanish clean. 🐱👤💨
USD/JPY) bearish Trend Read The captionSMC Trading point update
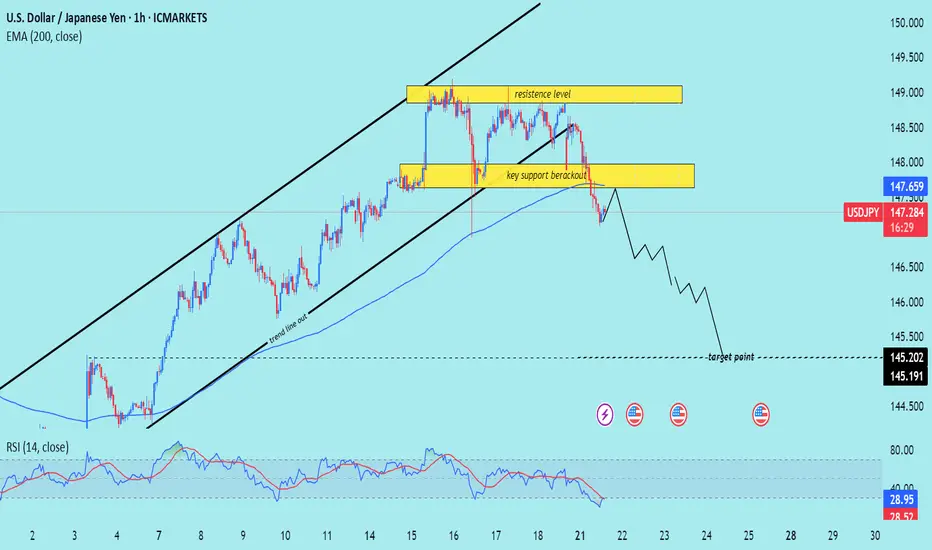
Technical analysis of USD/JPY on the 1-hour timeframe, signaling a potential drop toward the 145.200 – 145.191 target zone. Here's the detailed breakdown:
---
Technical Analysis – USD/JPY (1H)
1. Rising Channel Breakdown
Price has broken below an ascending channel, confirming a trend line breakout and signaling a trend shift from bullish to bearish.
The trend line cut and rejection from the upper resistance zone support the bearish reversal.
2. Key Support Breakout
A crucial horizontal support zone around 147.80–148.00 was broken.
The break-and-retest of this area (yellow box) acts as a confirmation of bearish momentum continuation.
3. Bearish Momentum Below EMA
Price is trading below the 200 EMA (147.659) — a strong signal of downward bias on this timeframe.
The EMA has flipped from dynamic support to resistance.
4. RSI Oversold but Bearish
RSI is at 29.41, in oversold territory, which may hint at a short-term bounce.
However, the broader structure suggests more downside potential before a deeper retracement.
5. Target Projection
Projected target zone is between 145.200–145.191, aligning with previous structure lows and likely liquidity zone.
Mr SMC Trading point
Summary
Bias: Bearish
Current Price: 147.307
Key Resistance: 147.80–148.60 zone
Structure: Rising channel break + key support breakout
200 EMA: Above price (bearish signal)
RSI: 29.41 – oversold but momentum remains bearish
Target: 145.200–145.191
Please support boost 🚀 this analysis)
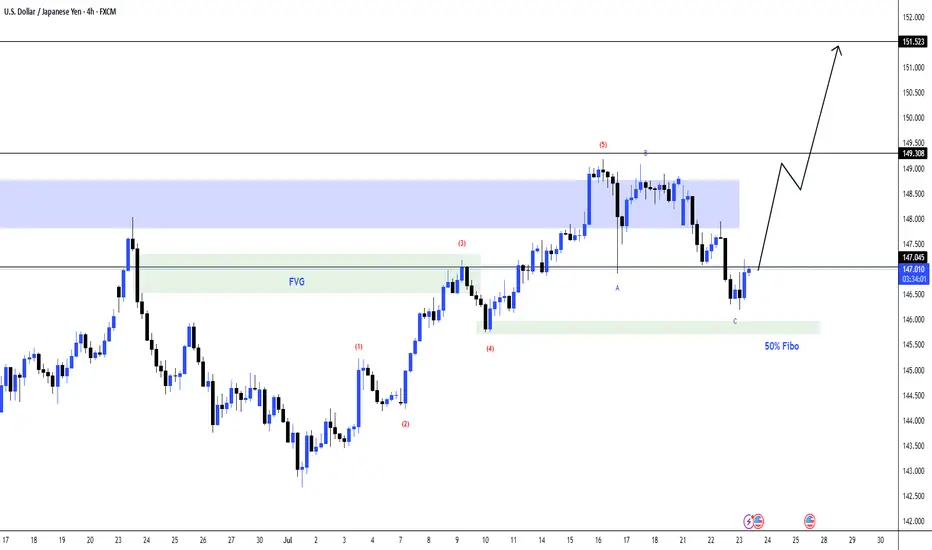
USDJPY 4H Chart Analysis – Bullish Setup in PlayThe USDJPY pair is currently showing signs of a bullish continuation after completing a corrective wave pattern (ABC) down into a strong confluence zone.
📌 Key Technical Insights:
✅ Wave Structure:
The market appears to have completed a 5-wave impulse up, followed by an ABC corrective pattern.
The final leg C has touched the 50% Fibonacci retracement level, aligning with a bullish reaction zone.
✅ Support & Confluence Zone:
Price retraced into the green demand zone marked around the 146.5 level.
This area also aligns with the Fair Value Gap (FVG) and the midpoint of the impulse leg, indicating strong demand interest.
✅ Fair Value Gap (FVG):
Price respected the FVG region twice – first as a breakout, now as a retest.
FVG acts as a dynamic support zone around 146.8–147.2.
✅ Key Resistance & Target Zones:
Immediate resistance lies at 149.30 (previous high and supply zone).
A breakout above this level can trigger a rally toward the 151.50 target, aligning with higher-timeframe resistance.
📈 Potential Bullish Pathway:
As shown on the projection path, price is expected to:
Hold above the 146.5–147.0 demand zone.
Retest 149.30 as resistance.
Continue to push higher toward 151.50, completing a larger bullish leg.
💬 Let me know your thoughts in the comments! Will USDJPY break 151 next?
#USDJPY #ForexAnalysis #ElliottWave #SmartMoney #PriceAction #FVG #TradingView #FX
USDJPY Bearish Breakout!
HI,Traders !
#USD-JPY was trading along
The rising support line but
Now we are seeing a bearish
Breakout so we are bearish
Biased and we will be expecting
A further bearish move down !
Comment and subscribe to help us grow !

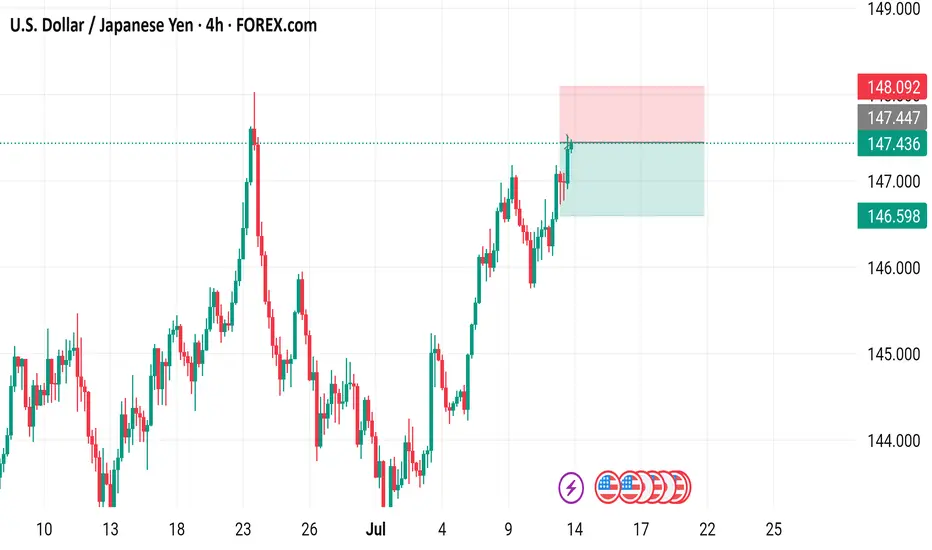
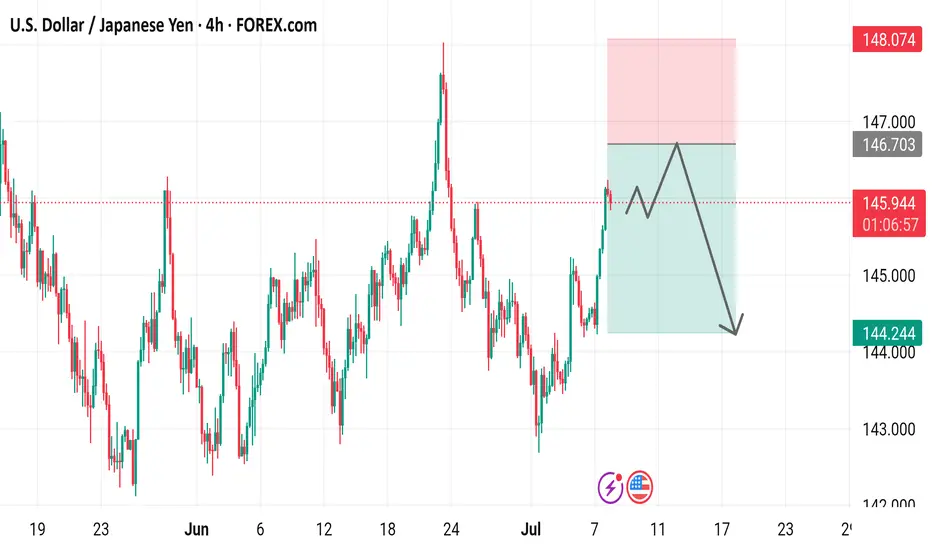
USD/JPY 4-Hour Forex Chart4-hour chart from FOREX.com displays the exchange rate between the U.S. Dollar (USD) and the Japanese Yen (JPY). The current rate is 147.446, with a slight increase of 0.072 (+0.05%). The chart shows recent price movements, including a notable drop within a highlighted support and resistance zone (light green and pink areas). Buy and sell prices are marked at 147.446 and 147.444, respectively, with additional price levels indicated on the right side ranging from 146.943 to 149.000. The chart includes candlestick patterns and is timestamped up to July 22, 2025.

U.S. Dollar / Japanese Yen - 4h Chart (FOREX.com)4-hour chart from FOREX.com shows the exchange rate between the U.S. Dollar (USD) and the Japanese Yen (JPY). The current rate is 148.184, reflecting a decrease of 0.623 (-0.42%) as of 01:29:16. The chart highlights recent price movements over the past few hours, with a shaded area indicating a consolidation phase around the current level.

#USDJPY: Price is currently accumulating ! Wait For DistributionAt present, the USDJPY currency pair appears to be in an accumulation phase, as evidenced by the absence of significant price movement throughout the current week. Several factors contribute to this trend.
Firstly, several significant economic events are scheduled for this week, particularly tomorrow and Friday. These developments hold substantial implications for the future trajectory of the USDJPY pair. Consequently, there exists a possibility that the price may experience a decline prior to initiating a bullish trend.
Secondly, there are two primary areas where the price could reverse its course. The extent to which the USD reacts to the economic data will serve as an indicator of the potential reversal zones.
It is imperative that you conduct your own analysis before making any financial decisions. This chart should be utilised solely for educational purposes and does not guarantee any specific outcome.
Regarding the stop loss, as this is a swing trade, it is advisable to employ a larger stop loss if the price reaches entry zones. The take profit level can be determined based on your entry type and analysis.
We wish you the best of luck in your trading endeavours and emphasise the importance of trading safely.
Kindly share this analysis with others through likes, comments, and social media platforms. If you have any questions or require further assistance, please do not hesitate to comment below. We are here to provide support.
Team Setupsfx_
❤️🚀
Market Analysis: USD/JPY RisesMarket Analysis: USD/JPY Rises
USD/JPY is rising and might gain pace above the 149.20 resistance.
Important Takeaways for USD/JPY Analysis Today
- USD/JPY climbed higher above the 147.50 and 148.40 levels.
- There is a key bullish trend line forming with support at 148.40 on the hourly chart at FXOpen.
USD/JPY Technical Analysis
On the hourly chart of USD/JPY at FXOpen, the pair started a fresh upward move from the 145.75 zone. The US Dollar gained bullish momentum above 146.55 against the Japanese Yen.
It even cleared the 50-hour simple moving average and 148.00. The pair climbed above 149.00 and traded as high as 149.18. The pair is now consolidating gains above the 23.6% Fib retracement level of the upward move from the 145.74 swing low to the 149.18 high.
The current price action above the 148.50 level is positive. There is also a key bullish trend line forming with support at 148.40. Immediate resistance on the USD/JPY chart is near 149.20.
The first major resistance is near 149.50. If there is a close above the 149.50 level and the RSI moves above 70, the pair could rise toward 150.50. The next major resistance is near 152.00, above which the pair could test 155.00 in the coming days.
On the downside, the first major support is 148.40 and the trend line. The next major support is visible near the 147.90 level. If there is a close below 147.90, the pair could decline steadily.
In the stated case, the pair might drop toward the 147.50 support zone and the 50% Fib retracement level of the upward move from the 145.74 swing low to the 149.18 high. The next stop for the bears may perhaps be near the 146.55 region.
This article represents the opinion of the Companies operating under the FXOpen brand only. It is not to be construed as an offer, solicitation, or recommendation with respect to products and services provided by the Companies operating under the FXOpen brand, nor is it to be considered financial advice.

USD/JPY 4-Hour Chart Analysis4-hour chart displays the price movement of the U.S. Dollar against the Japanese Yen (USD/JPY) from June to August 2025. The chart shows a significant upward trend in July, followed by a correction. Key levels are highlighted, including support at 147.031 and resistance at 150.130, with the current price at 148.809. The chart suggests a potential bullish continuation, as indicated by the upward arrow and green box, targeting higher levels above 150.000.

USD/JPY 4-Hour Forex Chart4-hour performance of the U.S. Dollar (USD) against the Japanese Yen (JPY) from late June to mid-July 2025, sourced from FOREX.com. The current exchange rate is 147.436, with a 1.178 (+0.81%) increase. Key levels include a sell price of 147.393 and a buy price of 147.479. The chart shows a recent upward trend with a resistance zone highlighted between 147.436 and 148.092, and support around 146.598. Candlestick patterns indicate volatility, with notable price movements around early July.
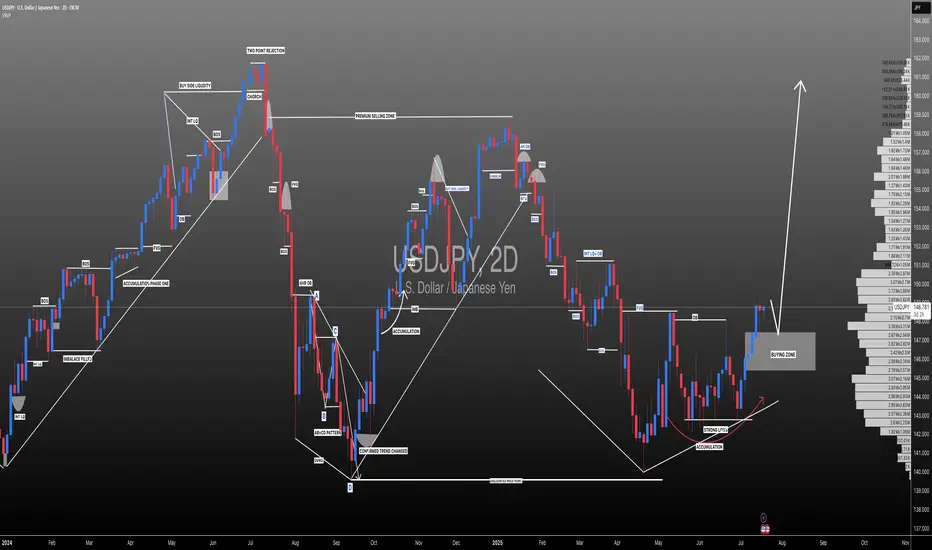
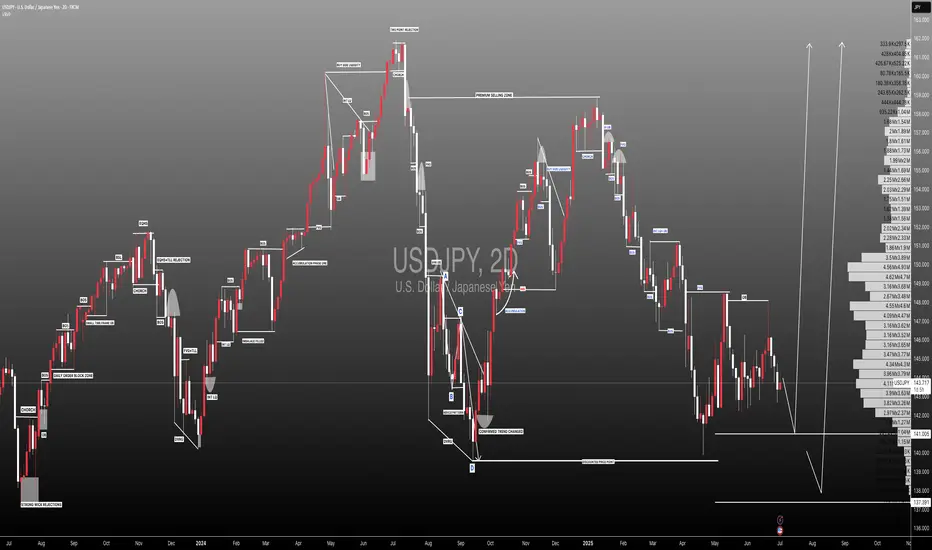
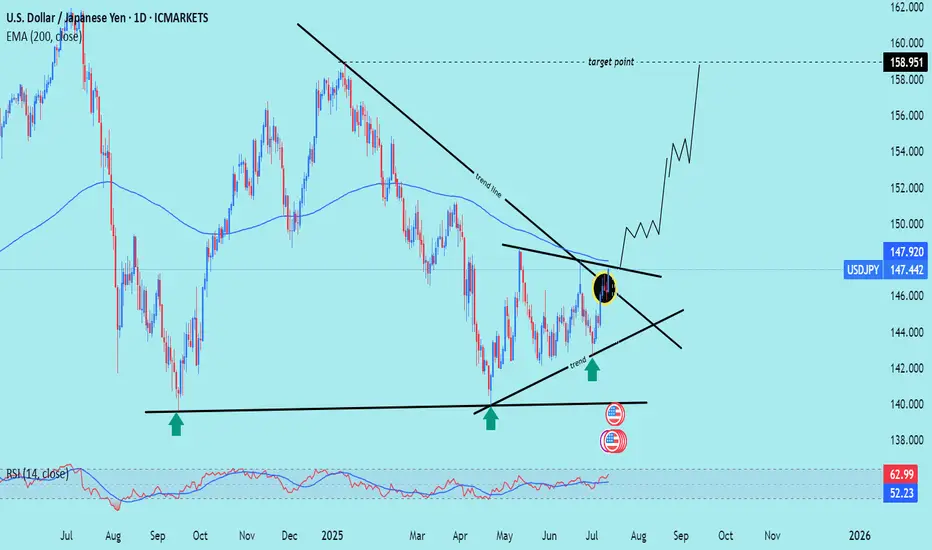
USD/JPY) LOGN TIME Analysis Read The captionSMC trading point update
Technical analysis of USD/JPY on the daily timeframe, highlighting a long-term downtrend reversal with potential for significant upside.
---
Analysis Summary
Pair: USD/JPY
Timeframe: Daily
Current Price: 147.442
Bias: Bullish breakout from a descending wedge structure.
---
Key Technical Insights
1. Descending Trendline Break:
Price has broken above the long-term downtrend line, signaling a reversal.
Breakout area is circled in yellow, confirming bullish intent.
2. Trendline & Structure Support:
Multiple rejections from the ascending support trendline (marked by green arrows) confirm accumulation and higher lows.
3. 200 EMA as Dynamic Resistance/Support:
Price is now above the 200 EMA (147.920) — a bullish signal, turning resistance into support.
4. RSI (14):
RSI at 62.99, approaching overbought territory, but still has room to push further.
---
Target Point
Target: 158.951
Based on measured move from wedge breakout and historical resistance level.
---
Trade Setup Idea
Direction Entry Stop-Loss Target
Buy 147.40–147.60 Below 145.80 158.95
Mr SMC Trading point
---
Summary
This chart signals a major bullish breakout on USD/JPY, with the break of a year-long downtrend structure, reclaiming the 200 EMA. If this breakout sustains, price could aim for 158.95 in the coming weeks.
Please support boost 🚀 this analysis)
USD/JPY "The Ninja Heist" – Bullish Loot Grab!🌟 Hey, Thieves & Market Bandits! 🌟
💰 Ready to raid the USD/JPY "The Gopher" vault? 💰
Based on 🔥Thief Trading Style🔥 (technical + fundamental heist analysis), here’s the master plan to swipe bullish profits before the market turns against us! Escape near the high-risk Yellow MA Zone—overbought, consolidation, and bear traps ahead! 💸 "Take the money and run—you’ve earned it!" 🏆🚀
🕵️♂️ Heist Strategy:
📈 Entry (Bullish Raid):
The vault’s unlocked! Buy any price—this heist is LIVE!
Pullback lovers: Set buy limits at recent/swing lows for extra loot.
🛑 Stop Loss (Escape Route):
Thief SL at recent/swing low (4H/Day trade basis).
Adjust based on your risk, lot size, and multiple orders.
🎯 Target (Profit Escape):
147.500 (or flee earlier if bears ambush!)
⚔️ Scalpers’ Quick Strike:
LONG ONLY! If rich, attack now. If not, join swing traders & rob slowly.
Trailing SL = Your bodyguard! 💰🔒
💥 Why This Heist?
USD/JPY "The Ninja" is bullish due to key factors—check:
📌 Fundamental + Macro + COT Report
📌 Quantitative + Sentiment + Intermarket Analysis
📌 Future Targets & Overall Score (Linkks In the profile!) 🔗🌍
🚨 Trading Alert (News = Danger!):
Avoid new trades during news—volatility kills!
Trailing SL saves profits on running positions.
💖 Support the Heist Team!
💥 Smash the Boost Button! 💥
Help us steal more money daily with Thief Trading Style! 🏆🚀
Stay tuned—another heist is coming soon! 🤑🎯
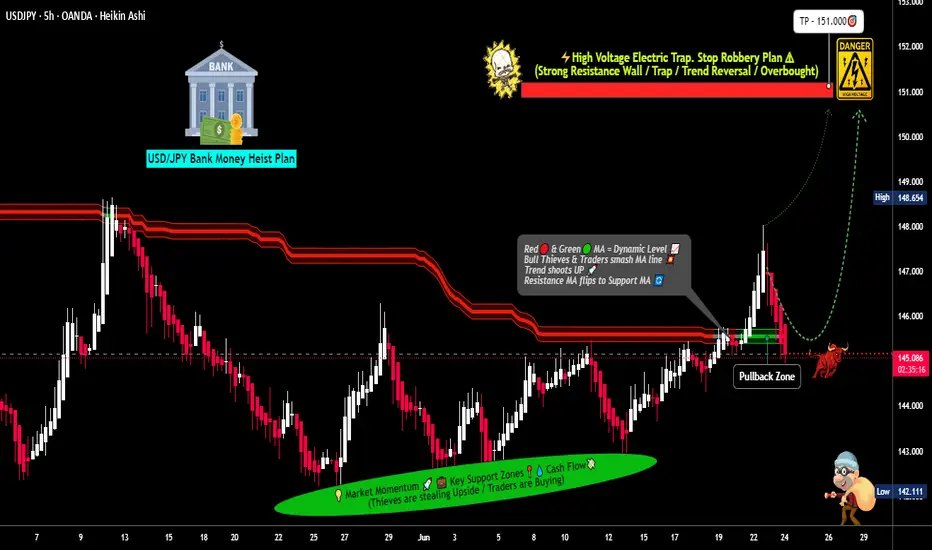
USD/JPY Profit Heist – Are You In or Missing Out?"🔥💰 "USD/JPY NINJA HEIST: Bullish Loot Before the Trap! (Thief Trading Style)" 💰🔥
🌟 Attention Market Robbers & Profit Takers! 🌟
🚨 Thief Trading Alert: USD/JPY "The Ninja" is primed for a BULLISH HEIST!
Based on our stealthy technical & fundamental analysis, we’re locking in a long entry strategy. The plan? Loot profits before the RED ZONE danger hits! Overbought? Maybe. Risky? Sure. But the real robbery happens before the bears wake up! 🏴☠️💸
🎯 ENTRY: The Vault is OPEN!
Buy Limit Orders: Swipe the dip on pullbacks or jump in at key swing lows.
Aggressive? Enter now & ride the wave!
🛑 STOP LOSS (Thief-Style Escape Plan):
Swing Low (5H TF): 143.600 (Adjust based on your risk & lot size!)
Multiple orders? Scale SL wisely—don’t get caught!
🎯 TARGETS:
Main Take-Profit: 151.000 (Or escape earlier if the trap triggers!)
Scalpers: Only play LONG—trail your SL & lock in quick loot!
📢 SCALPERS & SWING TRADERS:
Got deep pockets? Ride the wave now!
Small account? Join the swing heist & rob the trend slowly!
📈 WHY USD/JPY?
Bullish momentum + Macro/Fundamental tailwinds!
COT Report, Sentiment, & Intermarket Analysis all hint at more upside! go ahead to check 👉🔗🌏
⚠️ WARNING: NEWS = VOLATILITY!
Avoid new trades during high-impact news!
Trailing SL = Your best friend! Protect profits & avoid jail (stop-out)!
💥 BOOST THIS IDEA TO SUPPORT THE HEIST!
More boosts = More robberies = More profits for YOU!
Stay tuned—next heist coming soon! 🚀💰
🔥 Like, Share, & Follow for Daily Steals! 🔥
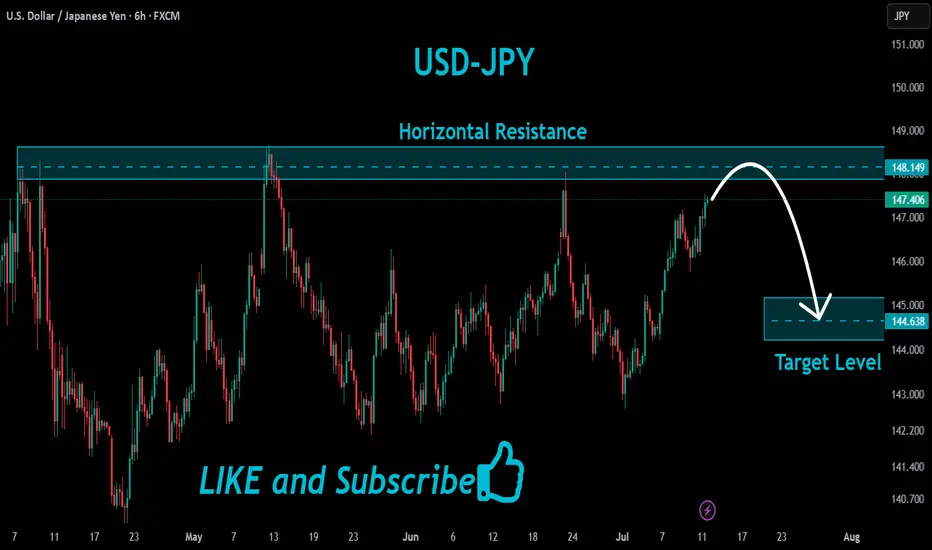
USDJPY Short From Resistance!
HI,Traders !
#USDJPY keeps growing
And the pair is overbought
So after it hits the horizontal
Resistance of 148.149 from
Where we will be expecting
A local bearish correction !
Comment and subscribe to help us grow !
USD/JPY 4-Hour Chart Analysis4-hour chart for the U.S. Dollar/Japanese Yen (USD/JPY) currency pair, sourced from The chart displays the exchange rate's fluctuations over time, with key indicators and annotations
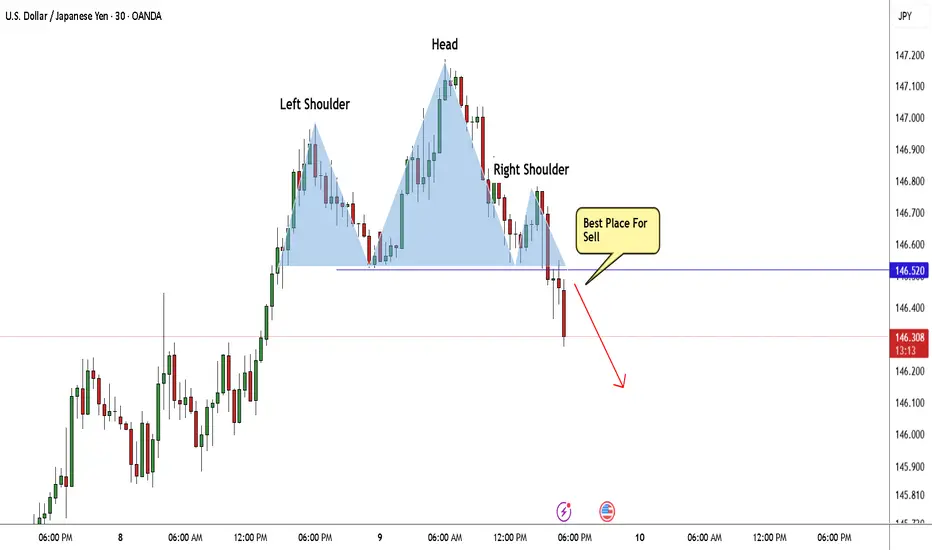
USD/JPY Made H&S Reversal Pattern , Short Setup Valid !Here is my 15 Mins Chart on USD/JPY , We have a very clear reversal pattern , head & shoulders pattern and we have a confirmation by closure below our neckline so we can enter direct now or waiting the price to go back and retest the neckline and this is my fav scenario .
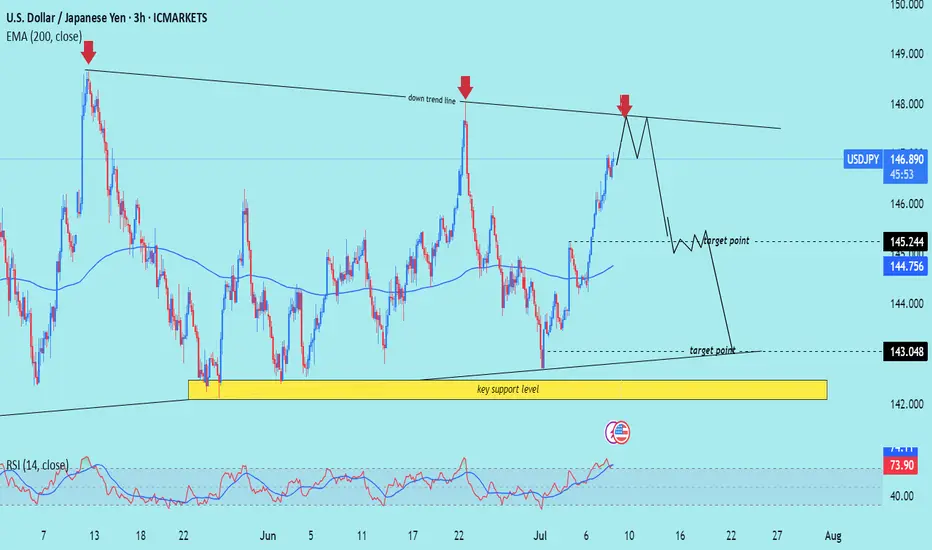
USD/JPY) back down Trend Read The captionSMC trading point update
Technical analysis of USD/JPY (U.S. Dollar / Japanese Yen) on the 3-hour timeframe, anticipating a rejection from a descending trendline resistance and a move down toward key support levels.
---
Analysis Overview:
Trend Bias: Bearish correction expected
Structure: Price is reacting at a descending trendline, which has held as resistance on multiple occasions.
Indicators:
EMA 200 (144.756): Price is currently above, but projected to break below it.
RSI (14): Overbought at ~74, signaling potential for a reversal.
---
Key Technical Components:
1. Descending Trendline Resistance:
Price is approaching/has touched a well-respected downtrend line, marked by three strong rejections (red arrows).
This trendline has consistently capped bullish moves, indicating strong seller interest.
2. Bearish Reversal Expectation:
The projected path suggests a potential fake breakout or double-top, followed by a steep decline.
A two-stage drop is anticipated, with price first targeting the EMA 200 zone, then extending lower.
3. Target Points:
First target: Around 145.244, near EMA 200.
Final target: 143.048, aligning with the key support zone (highlighted in yellow), where price previously bounced.
4. RSI (14):
Currently overbought (73.29), signaling a likely retracement.
Prior peaks at this level led to notable corrections.
---
Trade Setup Idea:
Parameter Level
Entry Near current price (~146.85) if bearish pattern confirms
Stop-Loss Above trendline (~147.30–147.50)
Target 1 145.24 (EMA 200 zone)
Target 2 143.05 (Support zone)
This setup offers a high-probability short opportunity if resistance holds.
---
Risk Factors:
Upcoming economic events could trigger volatility (news icon marked).
A clean breakout and close above the trendline (~147.50+) would invalidate this bearish thesis.
Mr SMC Trading point
---
Summary:
The analysis suggests a potential USD/JPY reversal from a descending trendline, supported by overbought RSI and prior rejections. The bearish projection targets a move toward 143.048, following a dip below the EMA 200 level at 145.244.
Please support boost 🚀 this analysis)