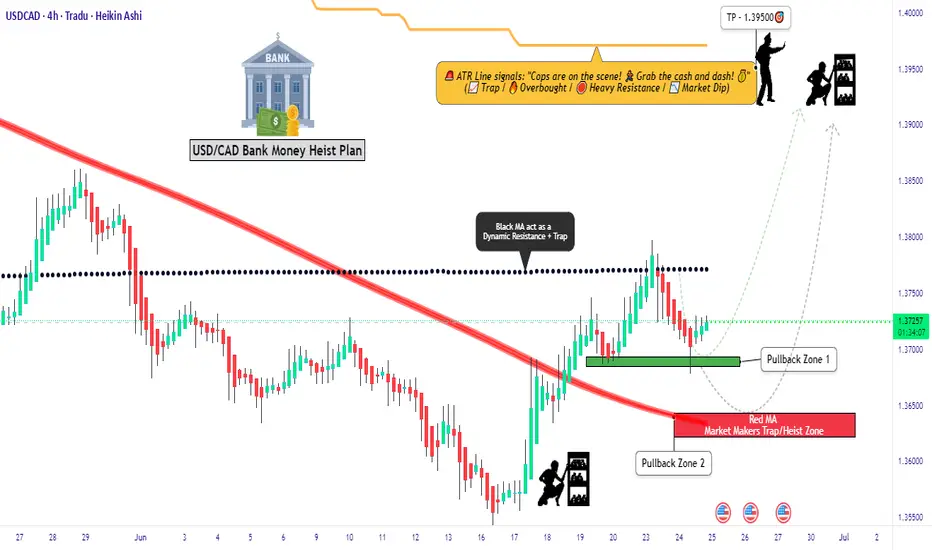
Unlocking the Bull Vault: USD/CAD Heist Setup🕵️♂️💼 The Loonie Vault Raid: USD/CAD Buy Blueprint 💰🔐
🌟Hi! Hola! Ola! Bonjour! Hallo! Marhaba!🌟
To All Currency Conquerors, Market Raiders & Profit Seekers 💸🚁🕶️
Welcome to another Thief Trading Style playbook, crafted for bold traders ready to infiltrate the Forex vaults with precision.
📜 Mission Brief – The Loonie USD/CAD Buy Op:
Using a blend of 🔥strategic market intel🔥 (technical + fundamental), we’re gearing up for a targeted buy operation. The goal? Extract max profits and vanish before the guards show up. 🏃♂️💨
🎯 ENTRY POINT – Authorized Access Only!
🎯 Buy Zone #1: Around 1.37000+
🎯 Buy Zone #2: Around 1.36400 (Caution: This is Market Maker Trap turf – approach wisely)
⏳ Wait for pullback signs & reversal confirmation before execution – The real pros enter when the crowd hesitates.
🛑 STOP LOSS – Backup Plan if Things Go South
🧠 Wise raiders always have an exit route!
🔹 SL Strategy 1: Nearest Swing Low on 2H timeframe (e.g., 1.36000)
🔹 SL Strategy 2: Institutional Buy Zone SL (1.34000 or deeper)
💡 Position sizing and risk tolerance are your call, but don’t skip this shield.
🏴☠️ TARGET – Where the Loot Lies
🎯 Aim for 1.39500 or exit early if the heat rises (volatility spike/consolidation stalls)
💼 Remember, the best thieves know when to grab the bag and bounce.
💹 Scalpers Advisory – Shortcuts to Riches
👀 Only ride the bullish tide.
💰 If you’ve got capital muscle, dive in. If not, roll with the swing crew.
📌 Trail that SL like a pro – don’t get caught slippin’.
📊 Why We Strike Now – The Big Picture
USD/CAD is showing bullish signs backed by:
✔️ Macro shifts
✔️ COT reports
✔️ Sentiment shift
✔️ Intermarket synergy
✔️ Smart money positioning
🔗 Full intel available – KlicK & explore!
⚠️ High Alert: News & Chaos Protocol
🚨 News drops = alarm bells.
To survive:
📌 Avoid fresh trades during major releases
📌 Use trailing SL to protect your gains
📌 Don’t overexpose – one vault at a time
💖 Support the Crew – Hit BOOST
Your boost helps fund the next mission. Show love, share strength, and become part of the Forex Heist Syndicate 🕵️♂️💵💼
One chart at a time, we rewrite the game.
🎯 Stay locked in – next mission drops soon... 🤑💻🚀
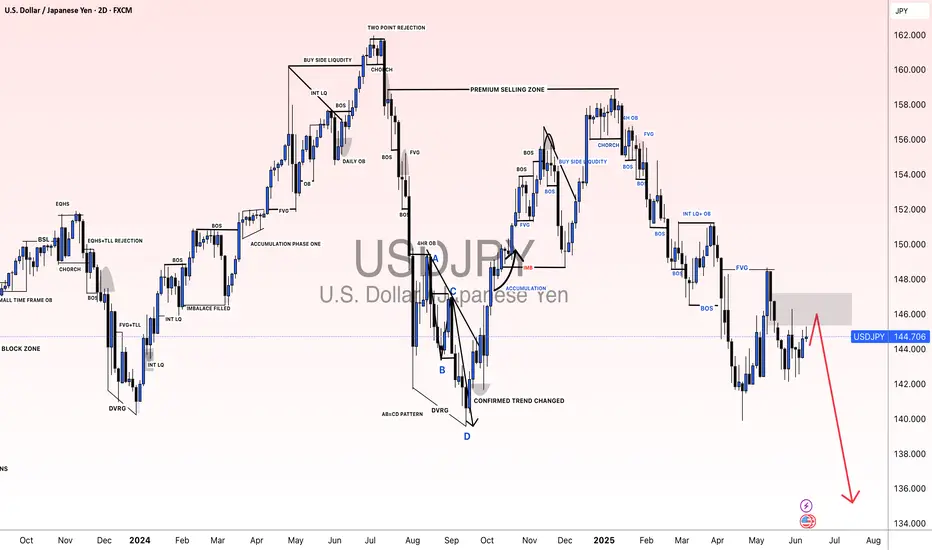
Usdjpyidea
USDJPY SELLBy utilizing levels, historical patterns, , we can formulate a hypothesis that the market might follow a similar trajectory if bearish sentiment prevails.
USD/JPY) Back support level Read The captionSMC trading point update
Technical analysis of USD/JPY pair using a combination of price action, resistance/support levels, and indicators. Here's a breakdown of the idea behind the analysis:
---
Chart Breakdown (2H - USD/JPY)
1. Key Zones:
Resistance Level (Yellow Box at Top):
Price has previously been rejected from this zone multiple times.
Recent bearish wicks and aggressive sell-offs are marked by red arrows—showing strong seller interest.
Support Level / Target Point (Bottom Yellow Box):
Price has found strong buying interest around 142.142.
This zone is the anticipated downside target if the bearish scenario plays out.
2. Bearish Bias Justification:
Liquidity Grab / Fakeout (labeled “fug”):
The price briefly broke above the smaller resistance block but quickly reversed.
This "fake breakout" often traps buyers, strengthening the bearish case.
EMA 200 (Blue Line):
Price is currently near or slightly under the 200 EMA (144.553), suggesting a potential rejection area aligning with resistance.
RSI Indicator:
RSI shows divergence and has not confirmed a bullish breakout.
The values (56.77 and 42.82) indicate loss of bullish momentum.
3. Projection (Black Lines):
The black zig-zag lines represent a forecasted drop to the support level.
Suggests a short setup near 144.50–145.00 with targets near 142.14.
Mr SMC Trading point
---
Summary:
Bias: Bearish
Entry Zone: Near resistance area (144.50–145.00)
Target: 142.142 (support zone)
Invalidation: Strong break above 145.00 and hold
Confirmation: Rejection from resistance with bearish candle pattern
---
Please support boost 🚀 this analysis)
USD/JPY) bearish Trand analysis Read The captionSMC trading point update
Technical analysis of USD/JPY (U.S. Dollar vs Japanese Yen) on the 1-hour timeframe. Here's a clear breakdown of the idea presented:
---
Overview of the Setup
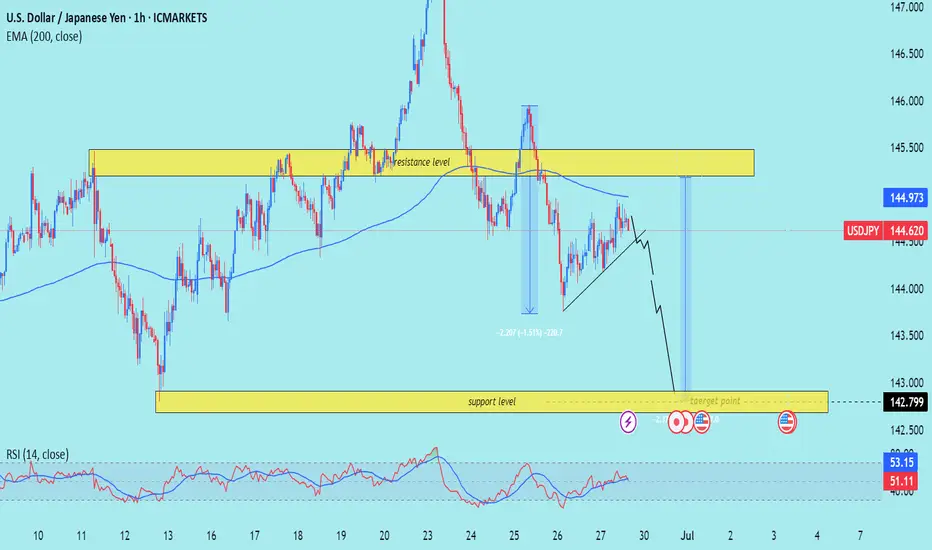
Current Price: 144.620
EMA 200 (Blue Line): 144.973 – price is trading below the EMA, indicating bearish momentum.
Resistance Zone: Around 145.000 – 145.500
Support/Target Zone: Around 142.799
RSI Indicator: ~51.11 – neutral zone (not overbought or oversold)
---
Interpretation of Chart Structure
1. Resistance Level:
Price tested the resistance zone and sharply rejected it.
This zone has held multiple times historically, making it strong.
2. EMA 200 as Resistance:
Price rejected just under the EMA, further confirming downside pressure.
3. Bearish Flag / Rising Wedge Breakdown:
There is a visible bearish continuation pattern (likely a rising wedge or bear flag).
Price is projected to break down from this pattern, continuing the downtrend.
4. Measured Move Projection:
Previous drop of ~230 pips (-1.5%) is mirrored for the next expected move.
The same size move projects the price to reach the target zone around 142.799.
5. Support/Target Zone:
Marked as the final take-profit zone.
Corresponds with historical demand and likely buyer interest.
---
Trade Idea Summary
Bias: Bearish
Entry Idea: After breakdown confirmation below wedge structure or rejection from resistance zone.
Target: 142.799
Stop-Loss Consideration: Above the resistance zone (~145.500) or just above the recent swing high.
Confirmation: Breakdown of rising wedge + below EMA + repeated resistance rejections.
Mr SMC Trading point
---
Key Considerations
Upcoming News Events (Three Icons):
These symbols signal potential USD or JPY volatility, so watch out for data releases that could disrupt the pattern.
RSI Neutral:
RSI is not yet oversold, allowing room for more downside before hitting exhaustion levels.
False Breakouts Possible:
Price may fake a break upward before continuing lower – wait for strong candle confirmation if entering a trade.
plesse support boost 🚀 this analysis)
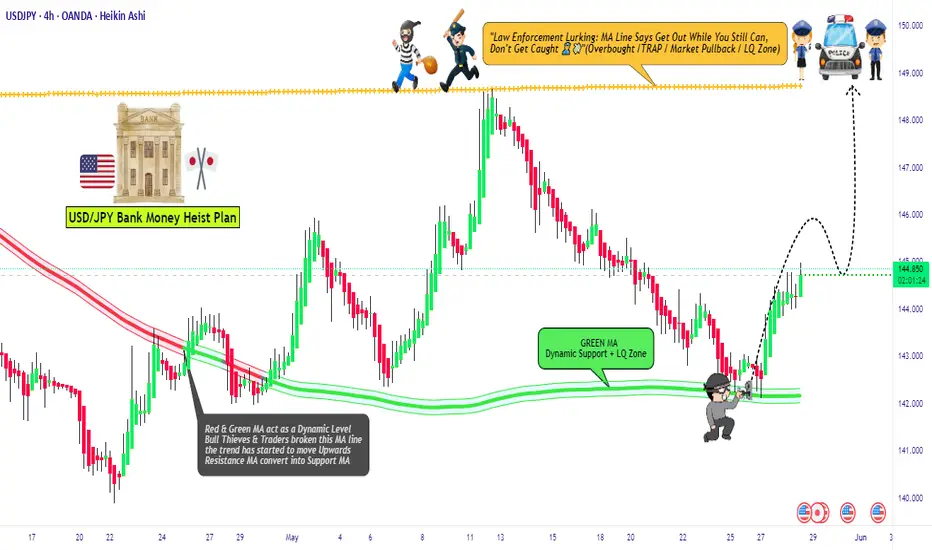
USD/JPY "The Ninja Heist" – Bullish Loot Grab!🌟 Hey, Thieves & Market Bandits! 🌟
💰 Ready to raid the USD/JPY "The Gopher" vault? 💰
Based on 🔥Thief Trading Style🔥 (technical + fundamental heist analysis), here’s the master plan to swipe bullish profits before the market turns against us! Escape near the high-risk Yellow MA Zone—overbought, consolidation, and bear traps ahead! 💸 "Take the money and run—you’ve earned it!" 🏆🚀
🕵️♂️ Heist Strategy:
📈 Entry (Bullish Raid):
The vault’s unlocked! Buy any price—this heist is LIVE!
Pullback lovers: Set buy limits at recent/swing lows for extra loot.
🛑 Stop Loss (Escape Route):
Thief SL at recent/swing low (4H/Day trade basis).
Adjust based on your risk, lot size, and multiple orders.
🎯 Target (Profit Escape):
148.700 (or flee earlier if bears ambush!)
⚔️ Scalpers’ Quick Strike:
LONG ONLY! If rich, attack now. If not, join swing traders & rob slowly.
Trailing SL = Your bodyguard! 💰🔒
💥 Why This Heist?
USD/JPY "The Ninja" is bullish due to key factors—check:
📌 Fundamental + Macro + COT Report
📌 Quantitative + Sentiment + Intermarket Analysis
📌 Future Targets & Overall Score (Linkks In the profile!) 🔗🌍
🚨 Trading Alert (News = Danger!):
Avoid new trades during news—volatility kills!
Trailing SL saves profits on running positions.
💖 Support the Heist Team!
💥 Smash the Boost Button! 💥
Help us steal more money daily with Thief Trading Style! 🏆🚀
Stay tuned—another heist is coming soon! 🤑🎯
USDJPY and USDCAD Analysis todayHello traders, this is a complete multiple timeframe analysis of this pair. We see could find significant trading opportunities as per analysis upon price action confirmation we may take this trade. Smash the like button if you find value in this analysis and drop a comment if you have any questions or let me know which pair to cover in my next analysis.

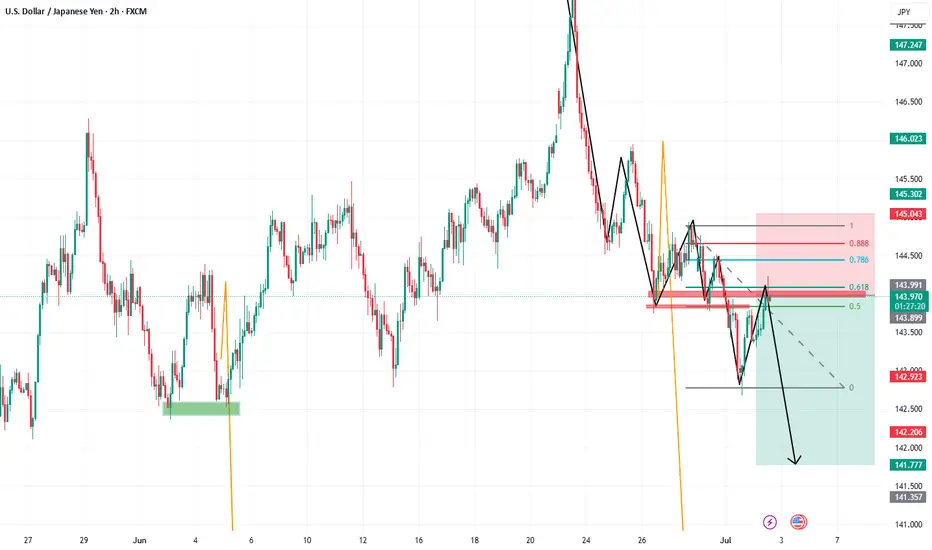
USD/JPY 4-Hour Forex Chart4-hour performance of the U.S. Dollar (USD) against the Japanese Yen (JPY) from FOREX.com, showing a current exchange rate of 144.351 with a slight decrease of 0.063 (-0.04%). The chart highlights a recent sharp upward movement followed by a decline, with key support and resistance levels marked around 144.419 and 145.028, respectively. The time frame spans from late June to early July 2025.

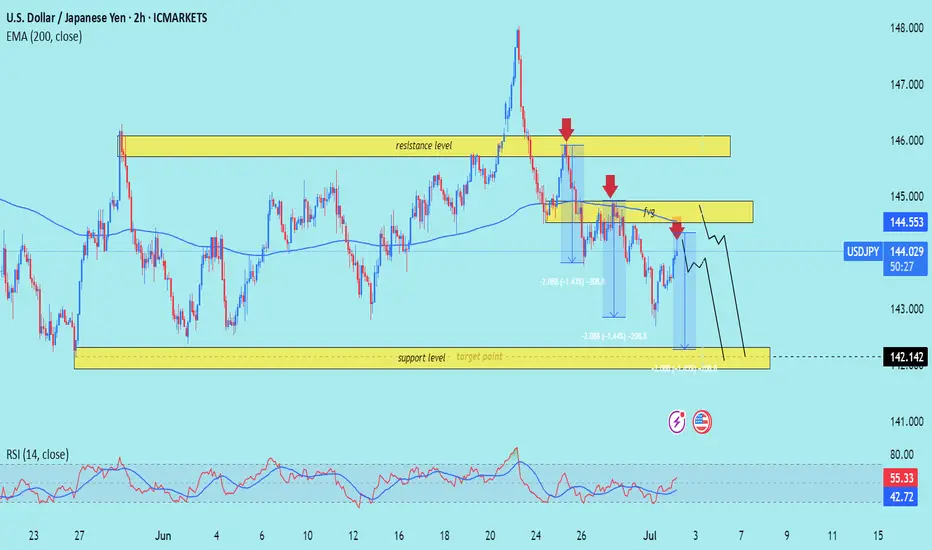
USD/JPY) bearish Trand analysis Read The captionSMC trading point update
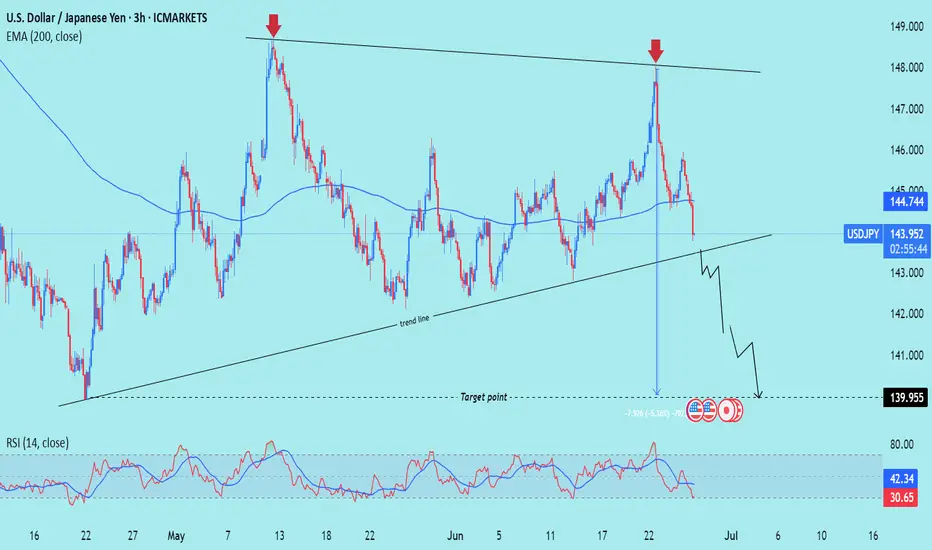
Technical analysis of USD/JPY on the 3-hour timeframe, highlighting a breakdown from trendline resistance and projecting a move toward a significant downside target.
---
Technical Breakdown
1. Trendline Rejection
Price sharply rejected from the descending resistance trendline near 148.00 (red arrow), forming a potential lower high.
This suggests continuation of the broader downtrend structure.
2. Break Below EMA 200
Price has broken below the 200 EMA (144.752), signaling a shift in momentum from bullish to bearish.
EMA is likely to act as dynamic resistance if price attempts a pullback.
3. Bearish Projection
The chart outlines a measured move downward toward the target point at 139.955, implying a drop of over 5.36% (approximately 770 pips).
The projected path shows lower highs and lower lows, confirming bearish structure.
4. RSI Confirmation
RSI (14) is currently at 29.98, indicating oversold conditions, but this often supports strong momentum in trending markets—suggesting a possible continuation lower after minor retracements.
Mr SMC Trading point
---
Conclusion / Idea Summary
Bias: Bearish
Entry: After trendline rejection and EMA 200 break (~144.75)
Target: 139.955
Invalidation: Break above 148.00 resistance trendline
---
Please support boost 🚀 this analysis)
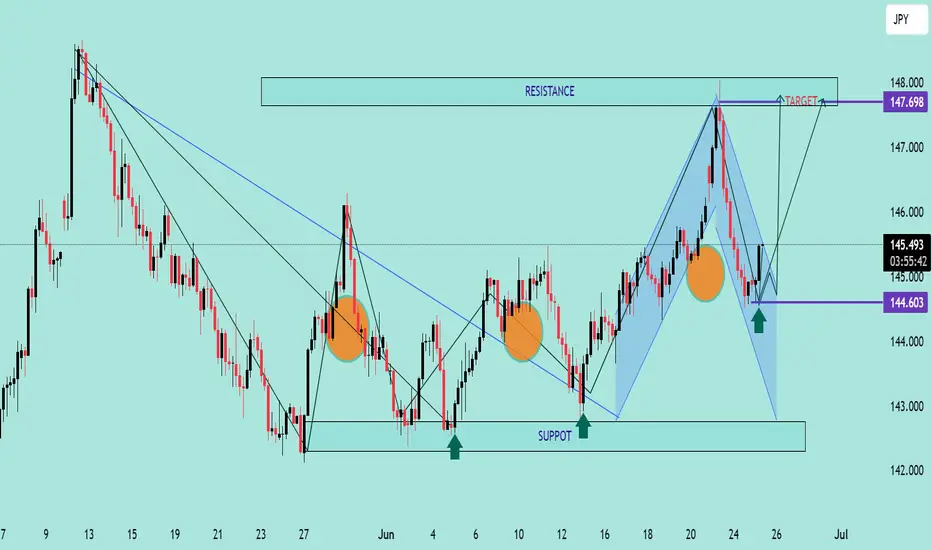
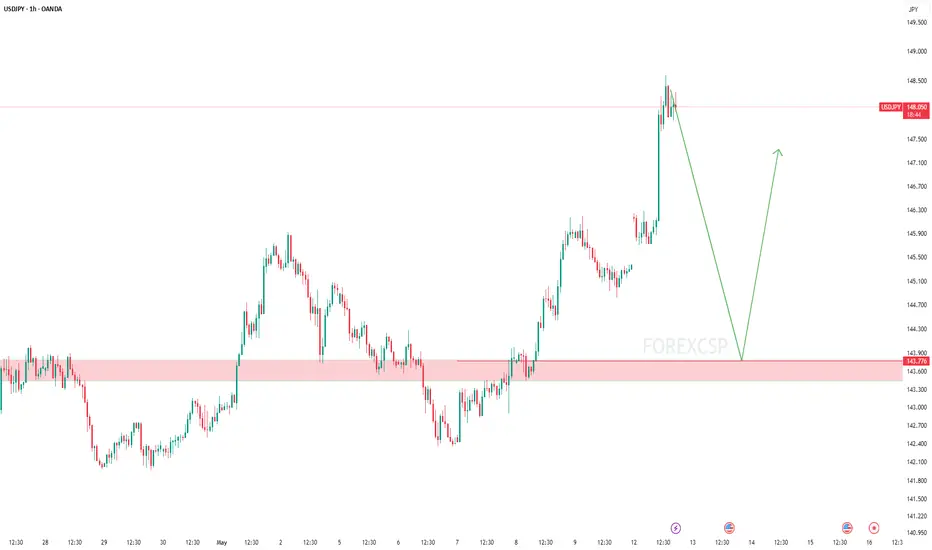
USD/JPY Bullish Reversal AnalysisUSD/JPY Bullish Reversal Analysis 📈💹
🔍 Technical Overview:
The chart illustrates a strong bullish reversal pattern forming on USD/JPY after price reacted from a key support zone at 144.600. This level has held firm multiple times, marked by green arrows, signaling strong buying interest.
📐 Chart Patterns & Structure:
✅ A bullish harmonic pattern (possibly a bullish Bat or Gartley) is completing near the 144.600 zone.
🔄 Multiple rejection wicks and bullish engulfing patterns indicate a potential upside reversal.
🔵 Descending trendlines have been broken, confirming momentum shift.
🔁 Previous resistance turned support (near 145.000) is acting as a possible launchpad for the next move.
🎯 Upside Target:
The projected move targets the resistance zone at 147.698, aligning with previous highs and a significant supply area.
If price breaks above 145.900 convincingly, continuation toward this resistance is expected.
🔻 Downside Risk:
A break below 144.600 would invalidate the bullish setup and expose price to the lower support range near 142.000–143.000.
📊 Conclusion:
USD/JPY is showing signs of bullish reversal from a strong demand zone. If price sustains above 145.000 and breaks the minor consolidation, the pair could rally toward 147.698 🎯.
Bias: Bullish ✅
Support: 144.600
Resistance: 147.698
USDJPY Analysis🚀 We entered the buy trade from the bottom level (check the pinned idea)
Thanks to our trailing stop strategy, we locked in full profits ✅
For those who missed it — a new buy zone is now marked on the chart!
Be patient and don’t trade emotionally ✋
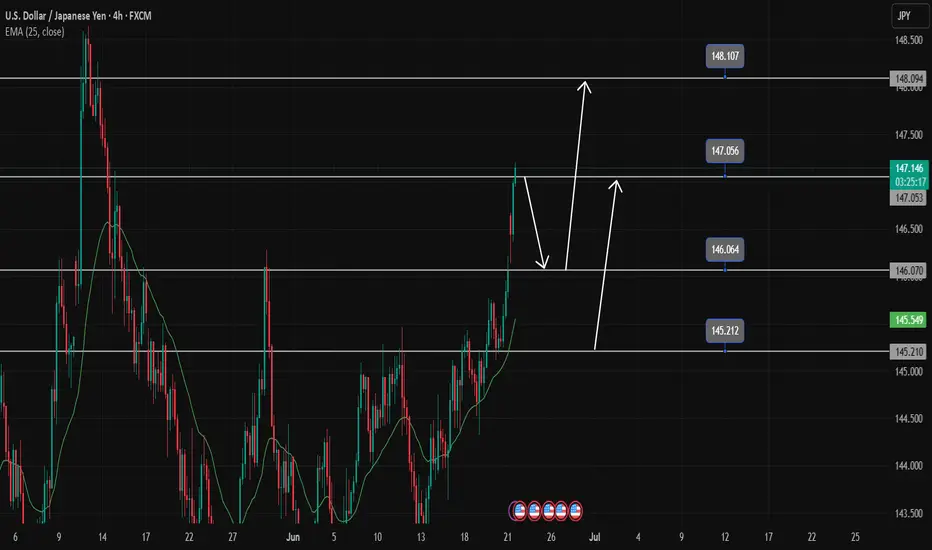
USDJPY Trading StrategyUSDJPY is looking to break the resistance zone of 147,000. The current bullish force of USDJPY is too strong, so jumping in to catch the top at the present time will be quite risky. If you want a SELL signal, you must wait for the confirmation of the sellers jumping into the market by the confirmation of the red closing m30 candle.
There will be a beautiful SELL signal if the h4 candle shrinks its wick below 147,000. If it closes above the SELL point, you must wait for 148,100, or if you want to BUY, wait for the retest and create a beautiful bullish wave in the small time frame.
On the other hand, if the currency pair declines back to the support zone of 146,000 and 145,200, it will give us a long-term BUY signal.
Support 146,000-145,200
Resistance 117,100-148,100
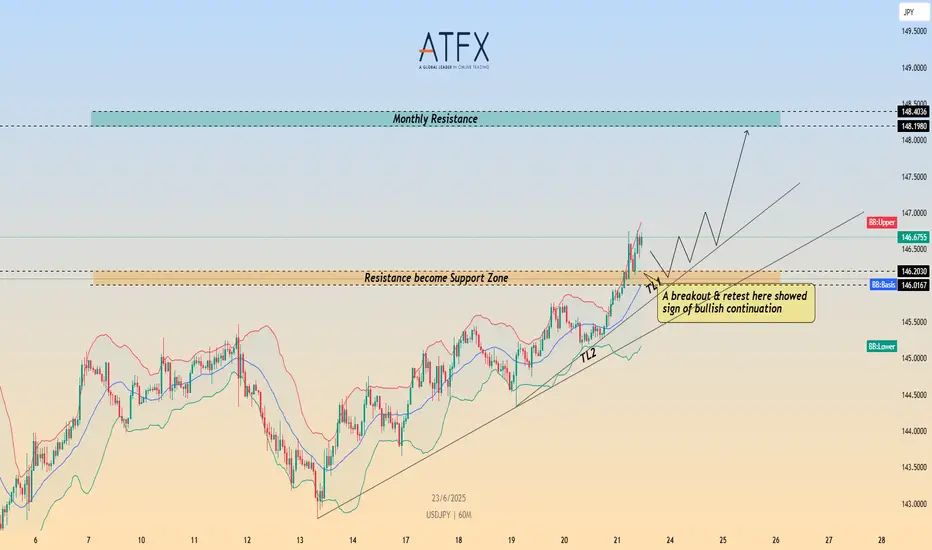
USD/JPY Breaks Higher – Bullish Momentum Targets 148.40FX:USDJPY CMCMARKETS:USDJPY USD/JPY continues to climb, extending gains above the key 146.00 breakout level, supported by Fed–BoJ policy divergence and rising geopolitical tensions. Despite Japan’s strong CPI and PMI prints, the BoJ maintains a dovish tone, while tariff concerns continue to cap yen sentiment. The Middle East conflict further fuels demand for the USD as a safe haven.
Technically, the pair confirmed a bullish breakout, with price hugging the upper Bollinger Band – a sign of sustained upside pressure. As long as 146.00 holds, bulls may aim for the 148.40 monthly resistance.
Key Levels :
Resistance : 146.75 / 148.40
Support : 146.00 / 145.25
⚠️ Momentum favours the upside while above 146.00. Break below may trigger short-term pullback toward 145.25.
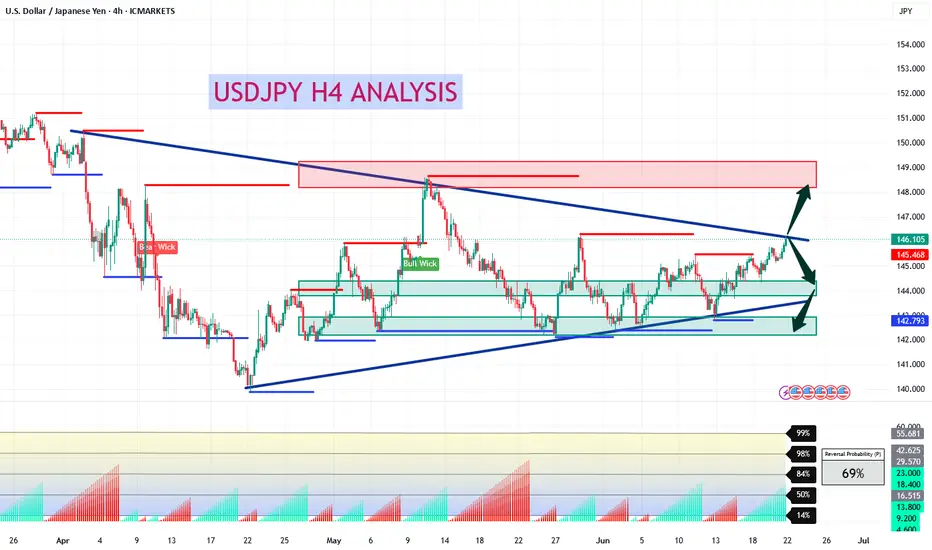
USDJPY H4 AnalysisUSDJPY Showing a Bearish Flag. If it breaks this zone above, Most probably can fly up to 148.668 and higher to 150.538. If no, Can rally between 143.981 or even lower to 142.410. Trading Analysis from 23-06-25 to 27-06-25. Take your risk under control and wait for market to break support or resistance on smaller time frame. Best of luck everyone and happy trading.🤗
USD/JPY 4-Hour Forex Chart (June 20, 2025)4-hour candlestick chart from FOREX.com displays the USD/JPY currency pair's performance, showing a current value of 145.328 with a slight decrease of 0.112 (-0.08%). The chart highlights a recent downward trend following a peak near 145.950, with a shaded area indicating a potential resistance zone around 145.500-145.950. The time frame spans from early June to the present date, with key levels marked at 145.000, 144.478, and higher resistance points.
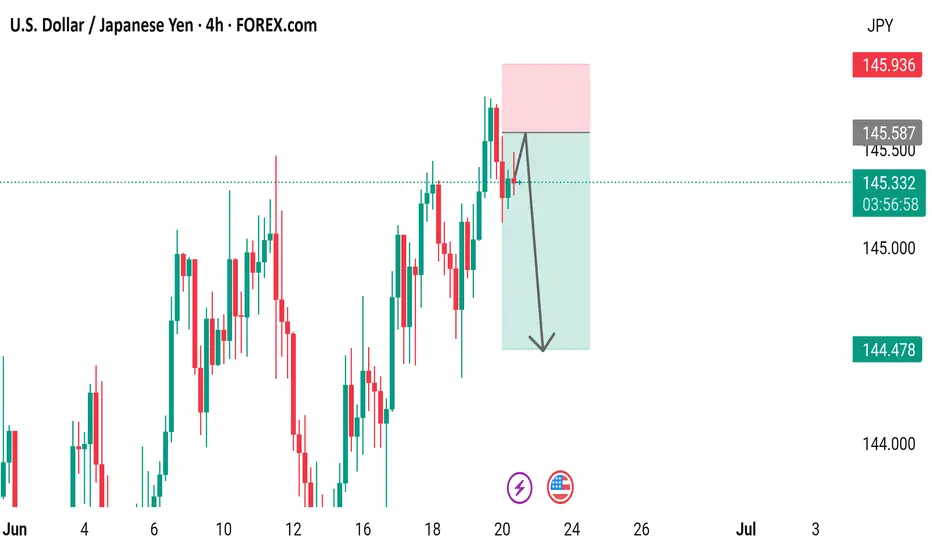
USD/JPY(20250620)Today's AnalysisMarket news:
The Bank of England kept interest rates unchanged at 4.25%, and the voting ratio showed that internal differences were increasing. Traders expect the bank to cut interest rates by another 50 basis points this year.
Technical analysis:
Today's buying and selling boundaries:
145.32
Support and resistance levels:
146.35
145.96
145.72
144.93
144.68
144.30
Trading strategy:
If the price breaks through 145.72, consider buying, and the first target price is 145.96
If the price breaks through 145.32, consider selling, and the first target price is 144.93
USD/JPY) Bearish reversal analysis Read The captionSMC trading point update
Technical analysis of USD/JPY 3-hour chart suggests a bearish reversal setup, based on smart money concepts (SMC), resistance rejection, and price action structure. Here's a full breakdown:
Technical Breakdown – USD/JPY
Big Resistance Zone (~145.800–146.300):
Price has tapped into a major resistance zone (yellow box) twice (highlighted with red arrows).
Both rejections indicate strong seller interest.
The latest candle structure shows clear rejection wick, signaling weakness at resistance.
---
Bearish Bias Confirmation:
Bearish structure forming after the second rejection.
Break of the rising trendline could accelerate selling pressure.
A measured move projection (-2.58%) aligns the downside target with the support level at ~142.144.
---
Support Zone (~141.800–142.400):
Marked as the likely target zone.
Historically acted as a strong bounce area (visible from late May to early June).
Completion of ABC bearish structure aligns here.
---
Indicators & Tools:
200 EMA (144.419): Price currently slightly above it — watching for a close below to strengthen bearish view.
RSI (14): Shows signs of bearish divergence and cooling off from overbought (was above 70 previously).
Volume spike during the rejection suggests institutional selling.
Mr SMC Trading point
---
Forecast Summary:
Bias: Bearish toward 142.144
Entry Idea: Look for confirmation of breakdown below trendline (~145.00)
Invalidation: Strong bullish close above 146.300 would break this idea.
---
Please support boost 🚀 this analysis)

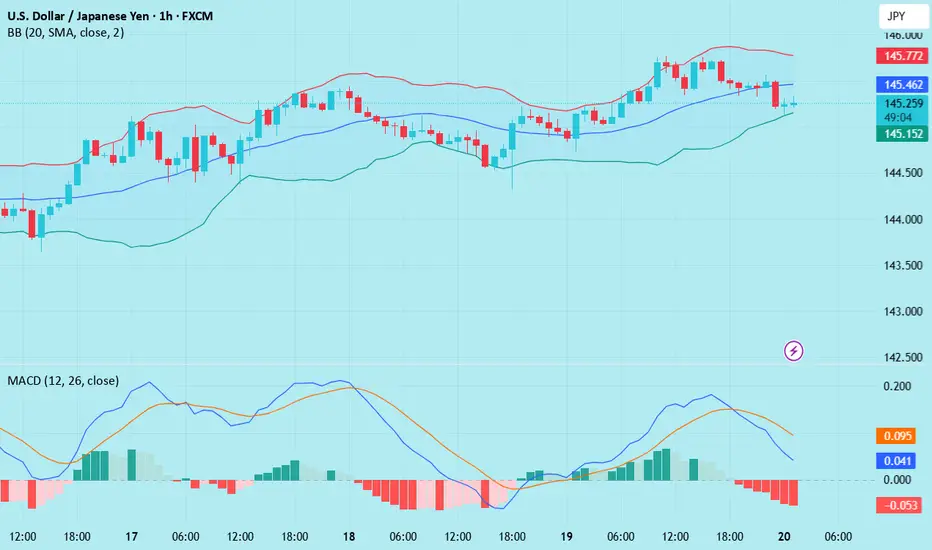
Market Analysis: USD/JPY Recovers Above 145.00Market Analysis: USD/JPY Recovers Above 145.00
USD/JPY is rising and might gain pace above the 145.50 resistance.
Important Takeaways for USD/JPY Analysis Today
- USD/JPY climbed higher above the 144.00 and 145.00 levels.
- There is a key bullish trend line forming with support at 144.80 on the hourly chart at FXOpen.
USD/JPY Technical Analysis
On the hourly chart of USD/JPY at FXOpen, the pair started a fresh upward move from the 142.80 zone. The US Dollar gained bullish momentum above 143.40 against the Japanese Yen.
It even cleared the 50-hour simple moving average and 144.00. The pair climbed above 145.00 and traded as high as 145.43 before there was a downside correction. It is now moving lower toward the 23.6% Fib retracement level of the upward move from the 142.79 swing low to the 145.40 high.
The current price action above the 144.50 level is positive. There is also a key bullish trend line forming with support at 144.80. Immediate resistance on the USD/JPY chart is near 145.40.
The first major resistance is near 146.20. If there is a close above the 146.20 level and the RSI moves above 60, the pair could rise toward 147.50. The next major resistance is near 148.00, above which the pair could test 148.80 in the coming days.
On the downside, the first major support is 144.80 and the trend line. The next major support is visible near the 144.40 level. If there is a close below 144.40, the pair could decline steadily.
In the stated case, the pair might drop toward the 143.40 support zone and the 76.4% Fib retracement level of the upward move from the 142.79 swing low to the 145.40 high. The next stop for the bears may perhaps be near the 142.80 region.
This article represents the opinion of the Companies operating under the FXOpen brand only. It is not to be construed as an offer, solicitation, or recommendation with respect to products and services provided by the Companies operating under the FXOpen brand, nor is it to be considered financial advice.

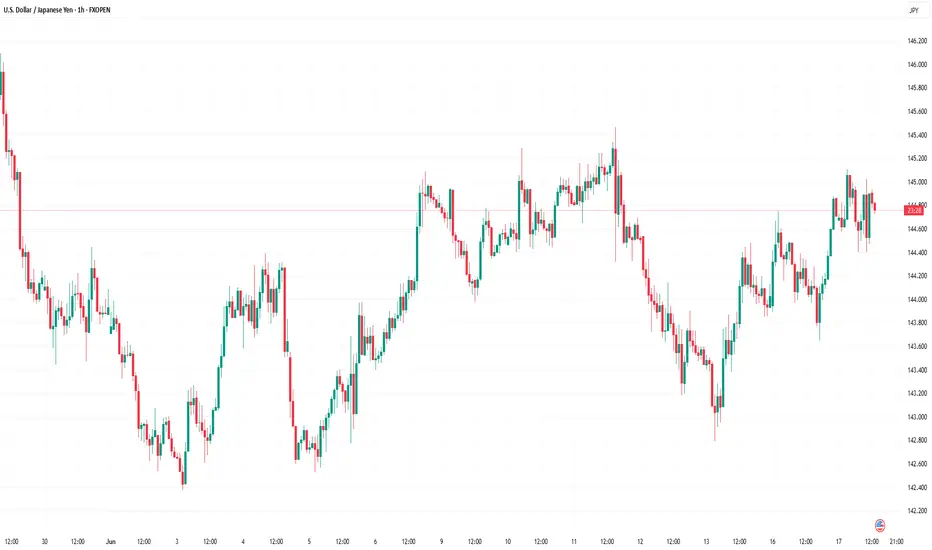
Bank of Japan Leaves Interest Rate UnchangedBank of Japan Leaves Interest Rate Unchanged
This morning, the Bank of Japan (BOJ) released its interest rate decision, keeping the rate unchanged as widely expected. According to Forex Factory, the BOJ Policy Rate remains at 0.5%.
BOJ Governor Kazuo Ueda noted the following:
→ Japan’s economy is recovering moderately.
→ The Bank will continue raising rates if economic and inflationary conditions improve.
→ The situation surrounding trade tariffs remains highly uncertain.
The fact that the decision was anticipated by markets is reflected in price action on the charts.
Technical Analysis of the USD/JPY Chart
A brief spike in volatility occurred on the USD/JPY chart this morning, but it did not significantly alter the broader structure of price movements, which in June have formed a contracting triangle pattern.
In recent days, the pair has been climbing from the lower boundary of the triangle toward the upper edge, forming a short-term ascending channel (highlighted in blue). However, in the near term, this bullish momentum may weaken as the USD/JPY rate approaches the upper boundary of the triangle, which coincides with the psychologically significant level of 145 yen to the dollar (indicated by arrows).
From a medium-term perspective, traders should watch for a potential breakout from the triangle pattern, which could trigger a meaningful trend. One possible catalyst could be news of a trade agreement between the United States and Japan.
This article represents the opinion of the Companies operating under the FXOpen brand only. It is not to be construed as an offer, solicitation, or recommendation with respect to products and services provided by the Companies operating under the FXOpen brand, nor is it to be considered financial advice.
USDJPY Trading RangeUSDJPY saw some corrections late on Friday. Overall, the pair remains sideways in a wide range of 143,000-145,100 and has yet to establish a clear continuation trend.
The wider band in the sideways trend is extended at 146,000 and 142,000.
The trading strategy will be based on the band that is touched.
Pay attention to the breakout as it may continue the strong trend and avoid trading against the trend when breaking.
Support: 143,000, 142,000
Resistance: 145,000, 146,000

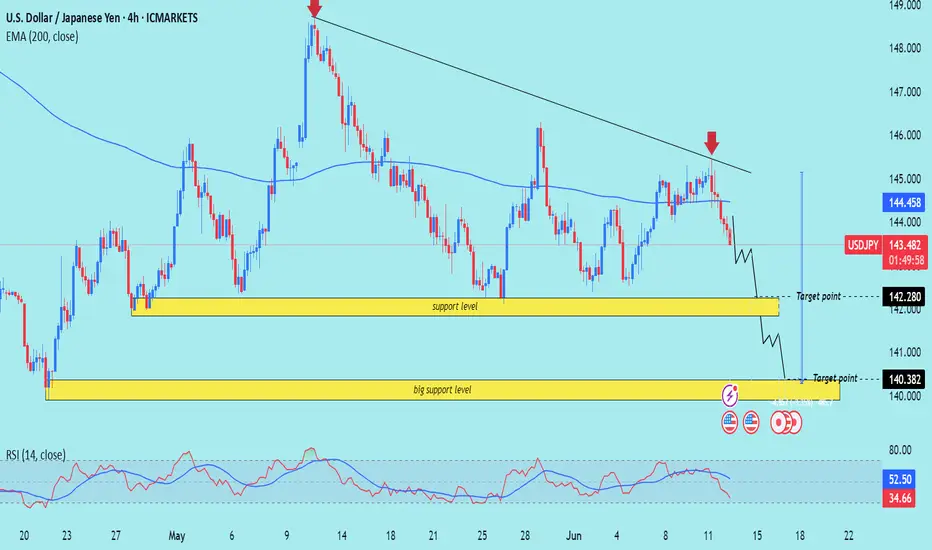
USD/JPY) bearish Technical Analysis Read The captionSMC trading point update
Technical analysis of USD/JPY (U.S. Dollar vs. Japanese Yen) on the 4-hour timeframe. Here's a breakdown of the analysis:
---
Trend & Price Action
The chart shows a descending trendline connecting recent lower highs, indicating a downtrend.
Current price: 143.548
Price has recently rejected off the trendline and started to fall, suggesting continued bearish momentum.
A red arrow marks the rejection point, emphasizing a key resistance area.
---
Technical Indicators
EMA 200 (Exponential Moving Average): At 144.459 — the price is currently below the EMA, reinforcing the bearish outlook.
RSI (Relative Strength Index):
RSI (14) values: around 35.45, which is near the oversold threshold (30) but not quite there yet.
Indicates increasing bearish momentum but no reversal signal yet.
---
Support Levels Identified
1. Support Level (Target 1): ~142.280
First target point for bears. Likely to see some reaction or consolidation here.
2. Big Support Level (Target 2): ~140.382
A stronger, more significant support zone and a deeper bearish target if the first support breaks.
---
Bearish Target Scenario
The projected path (in black lines) suggests:
A further drop into the 142.280 zone.
If that breaks, a continuation toward the 140.382 level.
This suggests a swing trade setup favoring short positions if the price respects the current rejection zone.
Mr SMC Trading point
---
Conclusion
Bias: Bearish
Resistance Confirmed: Rejection from descending trendline and below EMA200.
Bearish Targets:
Short-term: 142.280
Medium-term: 140.382
Risk Management: Watch RSI for potential bullish divergence near the second support zone, which could indicate reversal or consolidation.
---
Please support boost 🚀 this analysis)
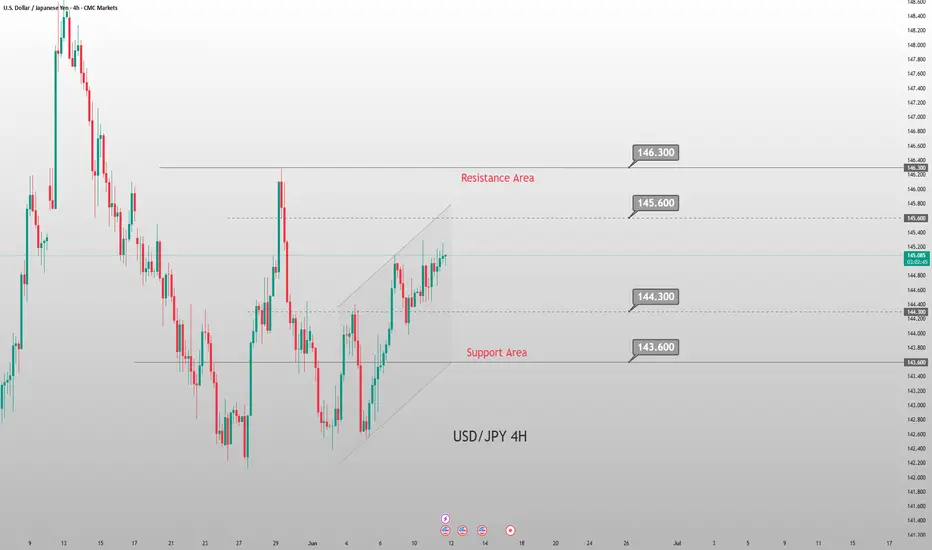
USD/JPY Gearing Up for Breakout ? Watch 145.20...USD/JPY Technical Setup – Bullish Continuation in Play?
USD/JPY is currently respecting a short-term ascending trendline, indicating sustained buying interest. The price consolidates just below a key resistance zone around 145.20, suggesting a potential breakout setup.
🔍 Key Technical Highlights:
* 📈 Trendline Support: Price has consistently respected this ascending trendline, forming higher lows—a strong bullish signal.
* 🔲 Resistance Zone: The 145.15–145.20 level has acted as a rejection zone previously. A breakout above this could invite momentum buying.
* 🕐 Consolidation Range: The market is coiling tightly just below resistance—watch for a volatility expansion.
* 🔮 Projection : If the price holds above the trendline and breaks 145.20 convincingly, we could see a bullish move towards 145.60+.
⚠️ Invalidation: A clean break below the trendline and 144.80 could shift the short-term bias back to neutral or bearish.

Current USD/JPY Trend Analysis and Trading RecommendationsOn Wednesday, the USD/JPY attracted buyers for the second consecutive day, trading near 145.20 in the early European session, close to a two-week high. Japan's May CGPI rose 3.2% YoY, the slowest pace since September last year, potentially easing BOJ rate hike pressure and weakening the JPY. Additionally, optimism over a framework agreement in U.S.-China trade talks dented the JPY's safe-haven appeal. Technically, the price holds above the 200-period SMA on the 4-hour chart and breaches the 145.00 psychological level, with oscillators tilting bullish. A valid break above 145.30 (Tuesday's high) would confirm the bullish setup, targeting the 146.00 integer mark and 146.25-146.30 resistance zone.
USDJPY
buy@145.000-145.200
tp:145.600-146.000
#USDJPY: +2000 PIPS Big Swing Move! Do not miss outThe cryptocurrency’s price is currently experiencing bearish pressure, and the current trading price is pivotal for determining its future trajectory. A smooth downtrend is anticipated, potentially propelling the price to 124 in the long term. The US dollar is likely to remain bearish, potentially reaching 95 in the US currency index. Three potential target sets are envisaged, and further updates will be provided based on price developments.
Best of luck and ensure safe trading practices.
Team Setupsfx_