USDJPY:800+ PIPS Dropping Well Since Our First Idea!Dear Traders,
Since we posted our idea when price was trading at 158 we told you that this will be a massive dropped and since then price has proven us right, now we think there is another big drop is on the way. Please use proper risk management while trading.
Usdjpyidea

USDJPY Analysis todayHello traders, this is a complete multiple timeframe analysis of this pair. We see could find significant trading opportunities as per analysis upon price action confirmation we may take this trade. Smash the like button if you find value in this analysis and drop a comment if you have any questions or let me know which pair to cover in my next analysis.

USD/JPY Analysis: Bears Put Pressure on Key SupportUSD/JPY Analysis: Bears Put Pressure on Key Support
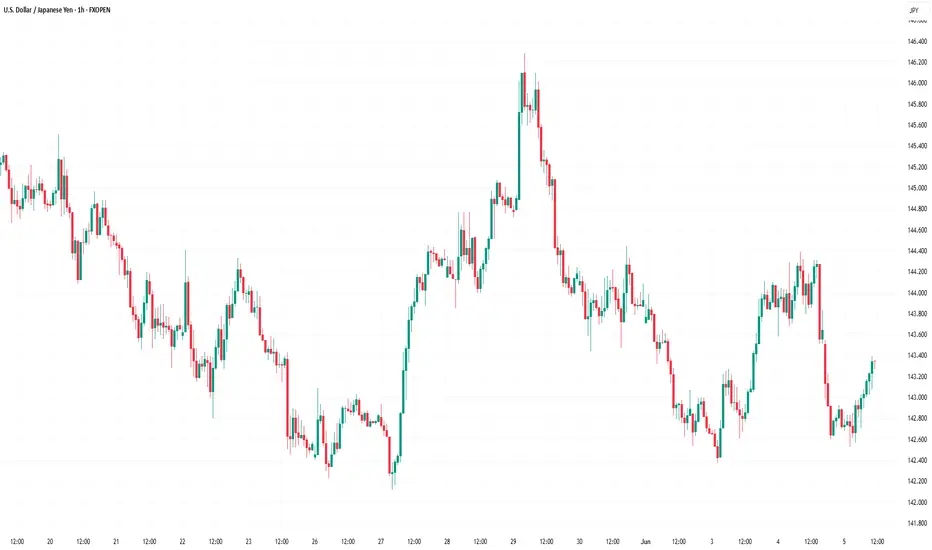
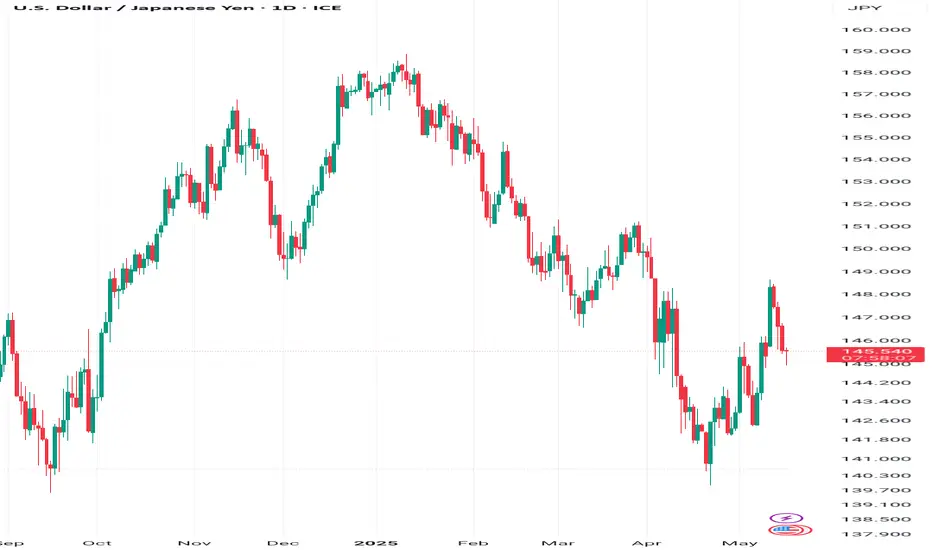
As shown on the USD/JPY chart, the pair is hovering near key support at ¥142.50 per US dollar.
While demand was strong enough at the end of May to lift the exchange rate from this level to a peak around ¥146.00, USD/JPY has once again retreated to the ¥142.50 area.
Why has USD/JPY declined?
On one hand, the US dollar has weakened following disappointing economic data released yesterday. The figures revealed a sharp slowdown in private sector hiring and an unexpected contraction in the US services sector, fuelling concerns over a possible recession.
On the other hand, yen strength is being driven by the Bank of Japan's apparent willingness to raise interest rates — reaffirmed on Tuesday by Governor Kazuo Ueda — which has reinforced expectations of a tightening cycle.
USD/JPY Technical Analysis
In early June, the ¥142.50 level had already shown its role as support (as indicated by the arrow), but it is once again under pressure — a sign of bearish dominance.
Yesterday, sellers broke through local support at ¥143.57, which may now act as resistance.
More US economic data is due on Friday, with key labour market figures set to be released at 15:30 GMT+3. These could potentially trigger a bearish attempt to break below the ¥142.50 level on the USD/JPY chart.
This article represents the opinion of the Companies operating under the FXOpen brand only. It is not to be construed as an offer, solicitation, or recommendation with respect to products and services provided by the Companies operating under the FXOpen brand, nor is it to be considered financial advice.
USD/JPY) breakout bearish trand analysis Read The captionSMC trading point update
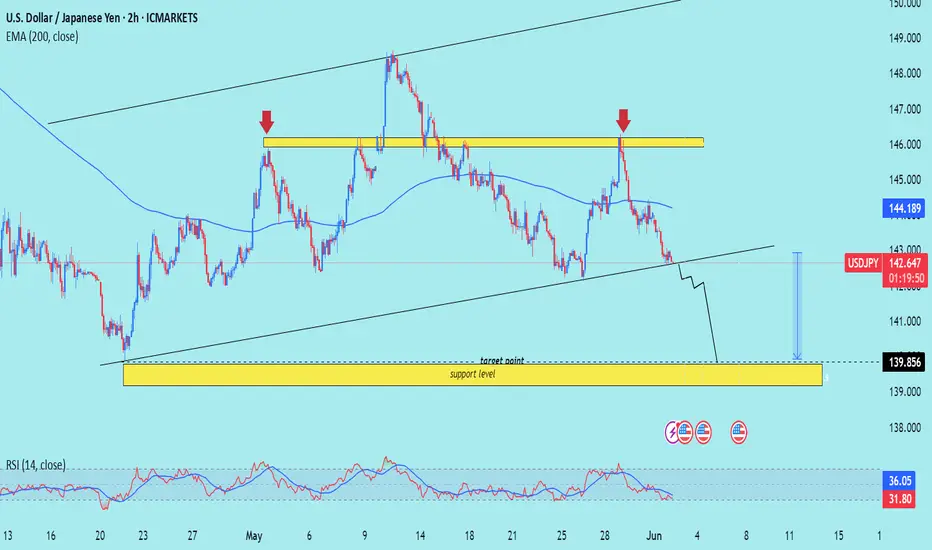
Technical analysis of the USD/JPY (US Dollar / Japanese Yen) pair on a 2-hour timeframe. Here's the idea behind the analysis:
---
Overall Idea: Bearish Move Toward Support
---
Key Levels
Resistance Zone (Yellow Box, Top): Marked with two red arrows — shows strong price rejection around 146.00–147.00 area.
Support Zone (Yellow Box, Bottom): Around 139.85, marked as a target point and support level.
These two zones form the range in which price has been reacting.
---
Current Price Action
Price is currently trading at 142.649, well below the 200 EMA (at 144.190), which is a bearish signal.
It has broken below the mid-range and seems to be heading toward the lower support zone (139.85).
---
Trend & Structure
The price is following a downward trend after rejecting from the resistance zone.
The channel suggests a further leg down is likely to complete a measured move.
A temporary retest of the broken trendline might occur before continuation down.
---
RSI (Relative Strength Index)
Currently around 31.83, nearing oversold territory, indicating the potential for:
A short-term bounce before further downside, or
A reversal near the key support zone.
---
Projection
The projection arrow (blue) suggests a bullish rebound from the 139.85 support zone.
This aligns with a potential buy opportunity once support is confirmed.
Mr SMC Trading point
---
Conclusion (Trade Idea Summary)
Short-Term Bias: Bearish
Medium-Term Setup: Look for a buy opportunity around 139.85, if price reacts well.
Key Steps:
1. Watch for price to reach 139.85.
2. Look for bullish reversal patterns or confirmations at that level (e.g., bullish engulfing, RSI divergence).
3. If confirmed, a potential long trade could target back toward the 144–145 zone.
Please Support boost this analysis )
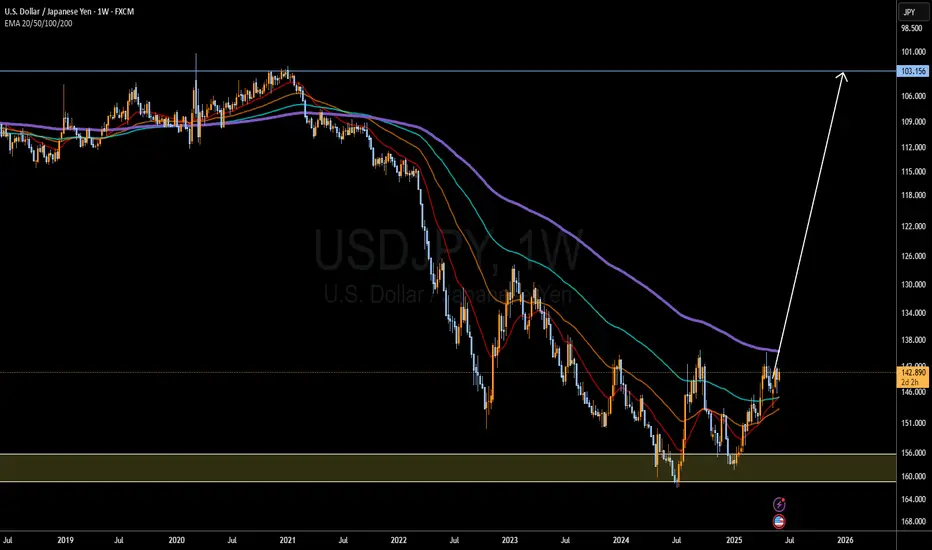
Japanese Yen to Da Moon!I compared the yen to every single currency pair and USDJPY is the most volatile. BOJ will raise interest rates to 0.75%-1% by late 2025/early 2026. And IF the FED chooses to lower rates that will further exacerbate Yen strength.
103.156 TP, but TBH I see price breaking well past that point and yen will make new all time highs. The dollar will get desecrated across all currencies, the yen will destroy it the hardest. Most likely BTC will also peak around this same time period and youll see and end to the bull cycle and we will enter BTC bear cycle but that is beside the point.
Potential Black Swan Event: the US enters into a recessionary environment, while I dont think this is likely bc everyone is saying that, it will be possible if we see a further escalation in the Ukraine conflict or if the US chooses to enter war with Iran. War is the only situation I see potential US recession.
I predicted then yen would get dusted during COVID, now I predict yen will make never seen before gains for the next 5 years minimum. Let's see how this plays out.
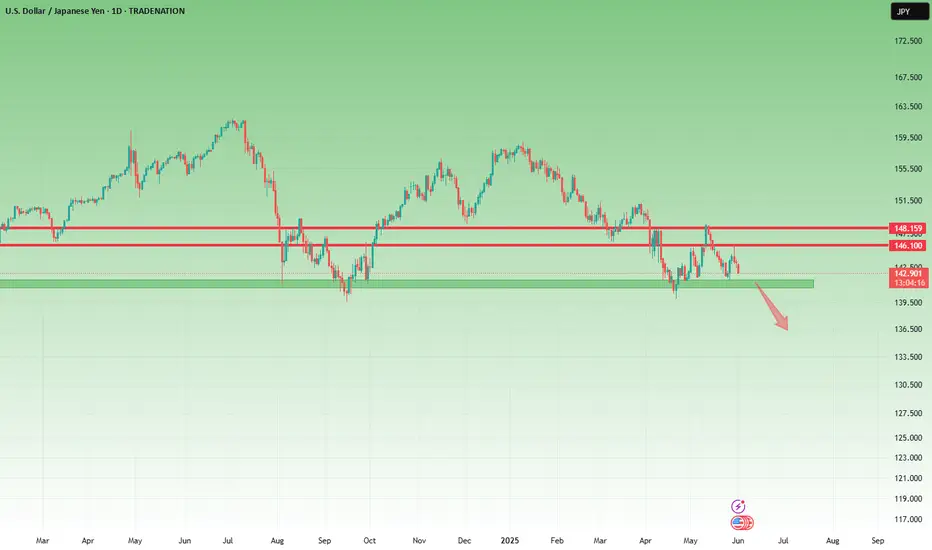
UsdJpy could break 142 and fall 500 pipsSince early May, I’ve been highlighting the 142 support zone on USDJPY as a potential reversal area — with a suggested upside target at 146.
The market respected this level twice, reversing from 142 and rallying past 146 both times.
However, last week’s move into 146 was sharply rejected, forming a strong daily Pin Bar exactly at resistance — a classic sign of exhaustion.
Now, price is rolling back toward support, and after multiple tests of the 142 zone, we may be very close to a downside break.
🧩 Add to this the fact that DXY also looks ready to break lower, and the probability of a USDJPY fall increases even more.
📉 Trading Plan:
Sell rallies, with invalidation above 146, and a target at 137, aiming for a 1:2 risk-reward setup.
Disclosure: I am part of TradeNation's Influencer program and receive a monthly fee for using their TradingView charts in my analyses and educational articles.
USDJPY Analysis todayHello traders, this is a complete multiple timeframe analysis of this pair. We see could find significant trading opportunities as per analysis upon price action confirmation we may take this trade. Smash the like button if you find value in this analysis and drop a comment if you have any questions or let me know which pair to cover in my next analysis.

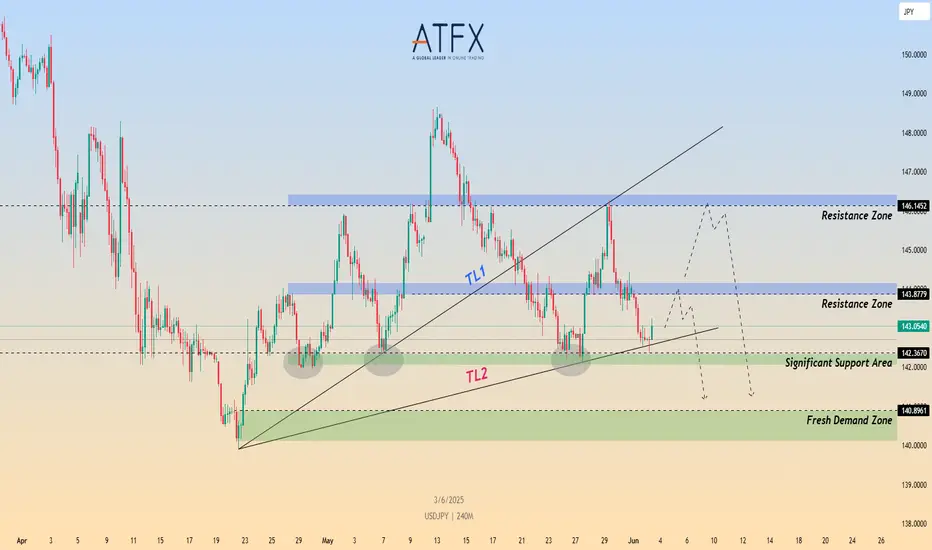
Risk, Rates, and Reversals: What’s Next for USD/JPY?CMCMARKETS:USDJPY FX:USDJPY USD/JPY rebounded slightly to 143.10 but remains under pressure after slipping from the 144.50 on BoJ-Fed divergence and rising geopolitical tensions. While the BoJ appears cautious about accelerating its balance sheet tapering beyond FY2026, it still signals further rate hikes amid persistent domestic inflation, offering the yen structural support.
Technically, price is reacting off the lower trendline TL2, aligned with the 142.30–142.40 significant support zone. This area has held multiple times in the past and may offer a bullish pullback toward the 143.80 or even 146.15 resistance zones. However, failure to break above these levels could expose USD/JPY to renewed downside toward the 140.89 demand base.
Short-term recovery depends on Friday’s NFP and risk sentiment around trade tensions. A break below 142.30 would invalidate the bullish rebound and open downside to support near 140.89.
Resistance : 143.87 , 146.14
Support : 142.36 , 140.89
USDJPY starting bullish move?Hello traders, this is a complete multiple timeframe analysis of this pair. We see could find significant trading opportunities as per analysis upon price action confirmation we may take this trade. Smash the like button if you find value in this analysis and drop a comment if you have any questions or let me know which pair to cover in my next analysis.

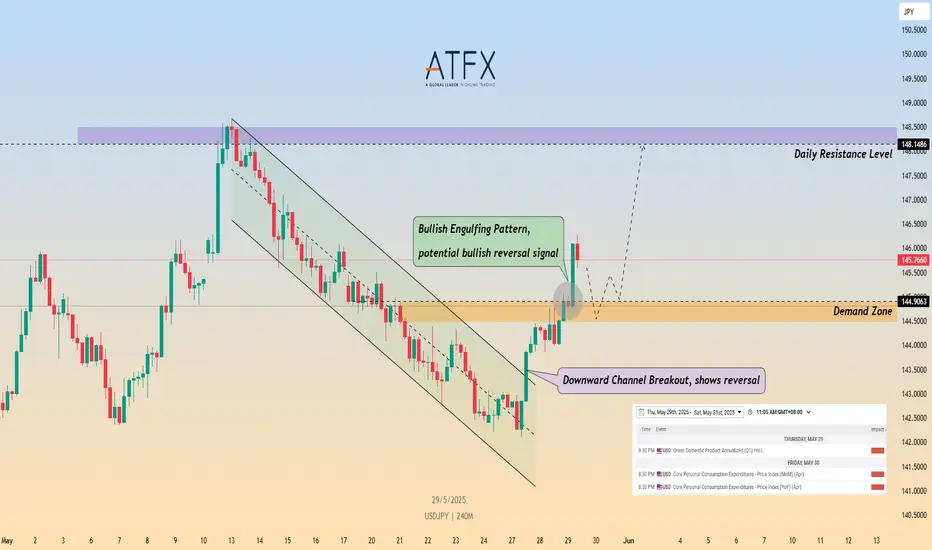
Bullish Reversal on Risk-On Shift and Channel BreakoutCMCMARKETS:USDJPY USD/JPY surged as risk appetite returned after a U.S. federal court blocked President Trump's "Liberation Day" tariffs, undermining demand for safe-haven assets like the yen. Meanwhile, weak demand in Japan’s 40-year bond auction raised concerns over fiscal stability, adding further downside pressure to JPY. Technically, the pair broke above a downward channel and formed a bullish engulfing pattern near the 144.90 demand zone. If price consolidates above 145.00, a test of the 148.15 resistance zone is possible. Traders now eye upcoming U.S. GDP and PCE inflation data for direction on Fed policy.
Resistance : 148.14 , 148.67
Support : 144.90 , 144.42
USDJPY: Neutral View! One of The Hardest Forex Pair To TradeUSDJPY has not yet shown a clear move, ranging between 141 and 144. We are currently neutral as the price could go in either direction. Trade cautiously and manage risk according to your trade plan.
Thanks for your support! 😊
If you’d like to help us out, here are a few things you can do:
- Like our ideas
- Comment on our ideas
- Share our ideas
Team Setupsfx_
❤️

USDJPY: 300+ Pips From Previous Idea, What Hold Next? Hey Everyone
USDJPY is on a roll! It’s rebounded a whopping 300+ pips and is now on the positive side. We reckon it’s going to keep climbing in the coming days as DXY is starting to regain its strength.
And here’s the cherry on top: there’s some exciting news coming up, including the NFP tomorrow. This could really boost the USDJPY to a new record high.
But remember, when trading, it’s crucial to manage your risk carefully.
Now, let’s talk about the potential for a significant market movement. We’ve spotted a chance for a substantial bullish swing that could reach around 2050 pips. We’ve also identified three potential targets, so you can choose the one that best fits your analysis.
The main driver behind this move is the reversal of the Japanese Yen (JPY) from a bullish trend to a bearish one. So, let’s be cautious and use precise risk management techniques during this period.
Good luck and happy trading! 😊
Oh, and if you’d like to help us out, here are a few things you can do:
- Like our ideas
- Comment on our ideas
- Share our ideas
Thanks a bunch for your support! 😊
Cheers,
The Setupsfx_ Team
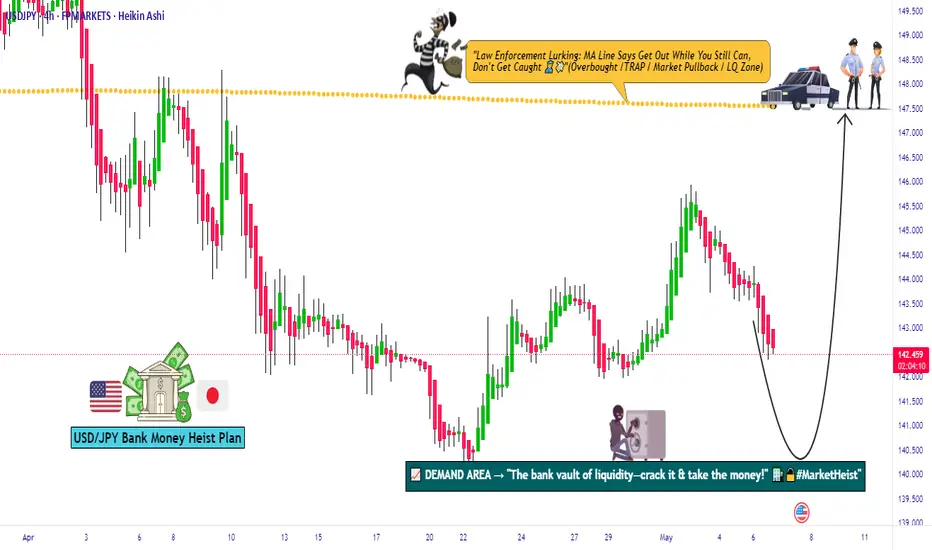
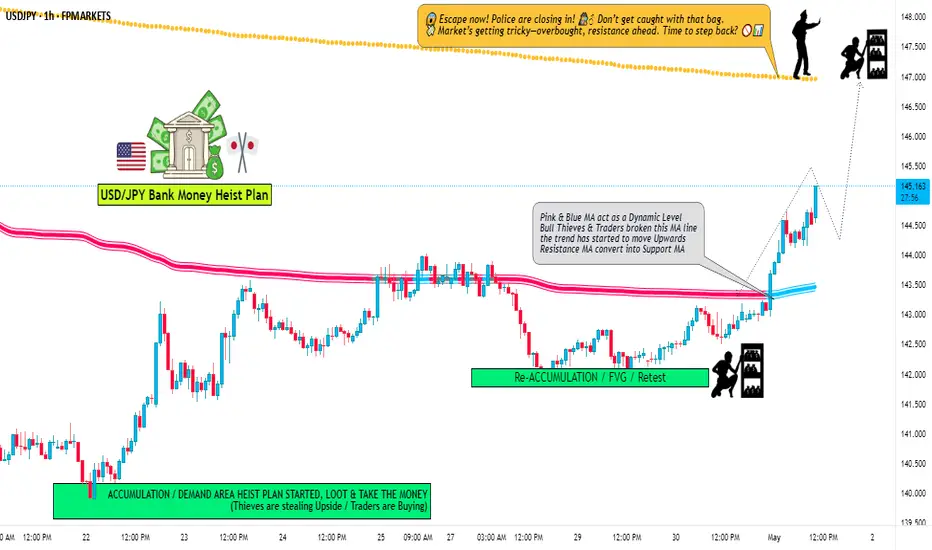
USD/JPY "The Gopher" Forex Bank Bullish Heist Plan (Swing Trade)🌟Hi! Hola! Ola! Bonjour! Hallo! Marhaba!🌟
Dear Money Makers & Robbers, 🤑 💰💸✈️
Based on 🔥Thief Trading style technical and fundamental analysis🔥, here is our master plan to heist the USD/JPY "The Gopher" Forex Market. Please adhere to the strategy I've outlined in the chart, which emphasizes long entry. Our aim is to escape near the high-risk Yellow MA Zone. Risky level, overbought market, consolidation, trend reversal, trap at the level where traders and bearish robbers are stronger. 🏆💸"Take profit and treat yourself, traders. You deserve it!💪🏆🎉
Entry 📈 : The vault is wide open! Swipe the Bullish loot at any price - the heist is on!
Place buy limit orders most recent or swing, low level for Pullback entries.
Stop Loss 🛑:
📍 Thief SL placed at the recent/swing low level Using the 4H timeframe (138.500) Day/Swing trade basis.
📍 SL is based on your risk of the trade, lot size and how many multiple orders you have to take.
🏴☠️Target 🎯: 147.500 (or) Escape Before the Target
🧲Scalpers, take note 👀 : only scalp on the Long side. If you have a lot of money, you can go straight away; if not, you can join swing traders and carry out the robbery plan. Use trailing SL to safeguard your money 💰.
💰💵💸USD/JPY "The Ninja" Forex Money Heist Plan is currently experiencing a bullishness,., driven by several key factors. .☝☝☝
📰🗞️Get & Read the Fundamental, Macro, COT Report, Quantitative Analysis, Sentimental Outlook, Intermarket Analysis, Future trend targets & Overall Score... go ahead to check 👉👉👉🔗🔗🌎🌏🗺
⚠️Trading Alert : News Releases and Position Management 📰 🗞️ 🚫🚏
As a reminder, news releases can have a significant impact on market prices and volatility. To minimize potential losses and protect your running positions,
we recommend the following:
Avoid taking new trades during news releases
Use trailing stop-loss orders to protect your running positions and lock in profits
💖Supporting our robbery plan 💥Hit the Boost Button💥 will enable us to effortlessly make and steal money 💰💵. Boost the strength of our robbery team. Every day in this market make money with ease by using the Thief Trading Style.🏆💪🤝❤️🎉🚀
I'll see you soon with another heist plan, so stay tuned 🤑🐱👤🤗🤩
USD/JPY "The Ninja" Forex Bank Money Heist (Bullish)🌟Hi! Hola! Ola! Bonjour! Hallo! Marhaba!🌟
Dear Money Makers & Robbers, 🤑 💰💸✈️
Based on 🔥Thief Trading style technical and fundamental analysis🔥, here is our master plan to heist the USD/JPY "The Ninja" Forex Market Heist. Please adhere to the strategy I've outlined in the chart, which emphasizes long entry. Our aim is to escape near the high-risk YELLOW MA Zone. It's a Risky level, overbought market, consolidation, trend reversal, trap at the level where traders and bearish robbers are stronger. 🏆💸"Take profit and treat yourself, traders. You deserve it!💪🏆🎉
Entry 📈 : "The vault is wide open! Swipe the Bullish loot at any price - the heist is on!
however I advise to Place buy limit orders within a 15 or 30 minute timeframe most recent or swing, low or high level. I Highly recommended you to put alert in your chart.
Stop Loss 🛑:
Thief SL placed at the Nearest / Swing low level Using the 1H timeframe (143.000) Day trade basis.
SL is based on your risk of the trade, lot size and how many multiple orders you have to take.
🏴☠️Target 🎯: 147.000
💰💵💸USD/JPY "The Ninja" Forex Money Heist Plan is currently experiencing a bullishness,., driven by several key factors. .☝☝☝
📰🗞️Get & Read the Fundamental, Macro, COT Report, Quantitative Analysis, Sentimental Outlook, Intermarket Analysis, Future trend targets.... go ahead to check 👉👉👉🔗🔗🌎🌏🗺
⚠️Trading Alert : News Releases and Position Management 📰🗞️🚫🚏
As a reminder, news releases can have a significant impact on market prices and volatility. To minimize potential losses and protect your running positions,
we recommend the following:
Avoid taking new trades during news releases
Use trailing stop-loss orders to protect your running positions and lock in profits
💖Supporting our robbery plan 💥Hit the Boost Button💥 will enable us to effortlessly make and steal money 💰💵. Boost the strength of our robbery team. Every day in this market make money with ease by using the Thief Trading Style.🏆💪🤝❤️🎉🚀
I'll see you soon with another heist plan, so stay tuned 🤑🐱👤🤗🤩
USDJPY Analysis todayHello traders, this is a complete multiple timeframe analysis of this pair. We see could find significant trading opportunities as per analysis upon price action confirmation we may take this trade. Smash the like button if you find value in this analysis and drop a comment if you have any questions or let me know which pair to cover in my next analysis.

USD/JPY Analysis: Bearish Bias with Multi-Market Confluence!📉 USDJPY Technical Breakdown – Yen Strength in Focus 📉
In this video, we take a close look at the USD/JPY, which is currently under pressure and trending to the downside 🔽. The bearish momentum is clear, but there are several key factors to consider before positioning ourselves for a potential short 📊.
🔍 First, it’s important to monitor the equity markets. If we start to see a pullback or sell-off in the stock indices 🏦📉, that could translate into further yen strength, adding weight to a USD/JPY short bias 💴💪.
Another key piece of confluence is comparing the DXY (Dollar Index) 📈 with the JXY (Japanese Yen Index) 📉. This gives us deeper insight into the relative strength of each currency and helps confirm our directional bias before entering a trade ⚖️.
🔁 Coming back to the USD/JPY chart, we’re watching for a retracement into a Fibonacci point of interest, which could provide a high-probability area to enter a sell setup. If price reacts from that level and confirms with structure, we could have a clean opportunity for continuation 🔂🎯.
⚠️ This is not financial advice — always conduct your own analysis and manage risk accordingly.

USD/JPY Dips FurtherUSD/JPY Dips Further
USD/JPY declined below 144.50 and is currently consolidating losses.
Important Takeaways for USD/JPY Analysis Today
- USD/JPY is trading in a bearish zone below the 146.10 and 144.90 levels.
- There is a short-term bearish trend line forming with resistance at 144.25 on the hourly chart at FXOpen.
USD/JPY Technical Analysis
On the hourly chart of USD/JPY at FXOpen, the pair started a steady decline from well above the 146.00 zone. The US Dollar gained bearish momentum below the 145.00 support against the Japanese Yen.
The pair even settled below the 144.50 level and the 50-hour simple moving average. There was a spike below 144.00 and the pair traded as low as 143.72. It is now consolidating losses with a bearish angle. Immediate resistance on the USD/JPY chart is near the 23.6% Fib retracement level of the recent decline from the 146.10 swing high to the 143.42 low at 144.25.
There is also a short-term bearish trend line forming with resistance at 144.25. The first major resistance is near the 144.90 zone and the 50% Fib retracement level of the recent decline from the 146.10 swing high to the 143.42 low.
If there is a close above the 144.90 level and the hourly RSI moves above 50, the pair could rise toward 145.50. The next major resistance is near 146.10, above which the pair could test 147.50 in the coming days.
On the downside, the first major support is near 143.70. The next major support is near the 143.20 level. If there is a close below 143.20, the pair could decline steadily. In the stated case, the pair might drop toward the 142.00 support.
This article represents the opinion of the Companies operating under the FXOpen brand only. It is not to be construed as an offer, solicitation, or recommendation with respect to products and services provided by the Companies operating under the FXOpen brand, nor is it to be considered financial advice.
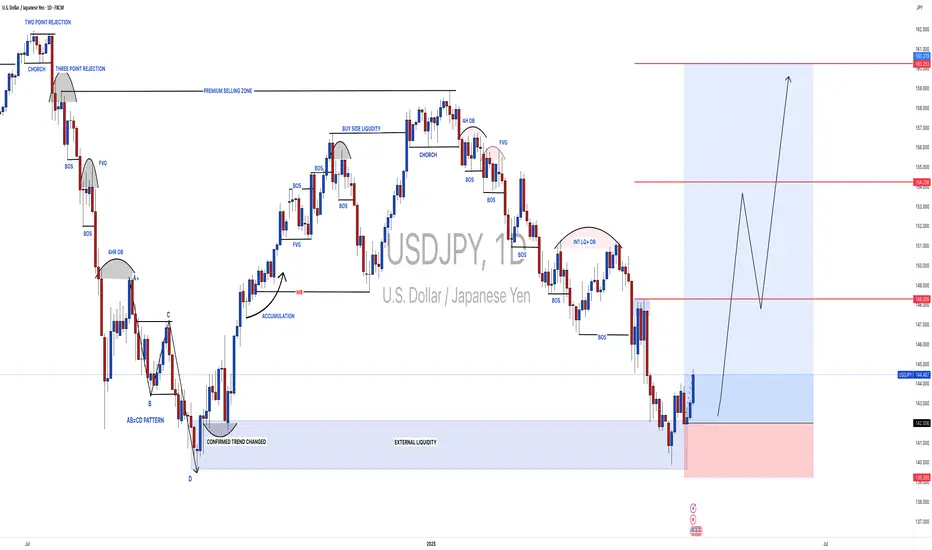
USDJPY:Is it a beginning of major bullish trend? Read CaptionThe price of USDJPY has shown a mixed volume, making it difficult to determine the trend. However, if we analyse the data, we can see that USD is gaining strength in the coming time. This could be due to the strong news coming in this week, which may divert the USDJPY towards the 150 price region. There are four potential targets that price could hit and surpass. Please use this analysis solely for educational purposes, as it does not provide any guarantees.
Good luck and trade safely.
Thanks for your support! 😊
If you’d like to help us out, here are a few things you can do:
- Like our ideas
- Comment on our ideas
- Share our ideas
Team Setupsfx_
❤️
USD/JPY Breakdown: Sell the Rallies, Ride the TrendUSD/JPY has decisively shifted bearish across all key timeframes. On the daily chart, the pair broke below the 50-, 100-, and 200-day EMAs with consistent lower highs and lows. The hourly chart confirms this trend, with bearish EMA stacking and failed attempts to reclaim the 200-hour EMA. RSI remains under 50 across timeframes, signaling persistent bearish momentum without exhaustion.
The 15-minute chart highlights ideal short-entry setups on pullbacks to the 20- or 50-EMA, especially when RSI fails to breach 50. The 200-EMA on this timeframe acts as dynamic resistance near 145.30. Short entries are favorable on rallies to the 145.10–145.35 zone, with downside targets at 144.80, 144.50, and potentially 144.20.
For the week ahead, the strategy is clear: fade rallies into EMA resistance and use RSI confirmation for timing. Avoid chasing lows—wait for price to come to you. Tight stops just above the EMAs minimize risk, and partial profit-taking at swing lows allows for trend-riding flexibility.
As long as USD/JPY remains below the 200-hour EMA, bearish momentum dominates. Trade with the trend, manage risk with precision, and stay alert for breakdowns below key support levels.
USD/JPY Poised for Breakout: Watch the 145.60 TriggerUSD/JPY remains in a broader uptrend, with buyers defending the 141.00–144.50 support zone on the daily chart. While price has recently pulled back from the 148.50 high, the overall structure remains bullish. On the hourly timeframe, the pair has been moving within a descending channel since May 13. However, a double bottom near 141.80 and a push back toward 145.50 suggest buyers are regaining control. A breakout above the channel resistance at 145.60 could signal the end of the correction and a new leg higher toward 147.00–148.00.
The 15-minute chart supports this setup, showing a bull-flag consolidation above 145.20 and rising trendline support near 145.10. Volume has thinned during the flag formation, indicating a potential surge on breakout. Traders should look to buy above 145.60, targeting 146.20 and 146.80, with stops just below 145.00. A break under 145.00 flips the short-term bias bearish, with downside targets at 144.60 and 144.20.
Overall, the technicals favor a bullish breakout scenario into the week, provided 145.00 holds. Intraday traders should closely monitor the 145.00–145.60 zone for momentum confirmation.
USDJPY and GBPJPY Analysis todayHello traders, this is a complete multiple timeframe analysis of this pair. We see could find significant trading opportunities as per analysis upon price action confirmation we may take this trade. Smash the like button if you find value in this analysis and drop a comment if you have any questions or let me know which pair to cover in my next analysis.

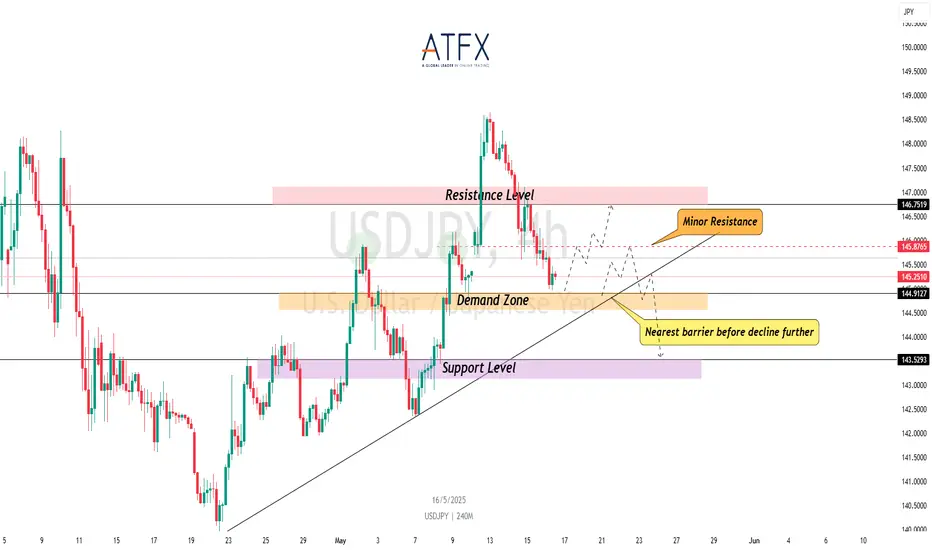
Bearish USD/JPY — Yen Strength FavoredCMCMARKETS:USDJPY Bearish Factors (USD Negative / JPY Positive):
Hawkish BoJ Expectations:
Despite Japan’s weaker Q1 GDP, BoJ officials—particularly Deputy Governor Uchida—have signalled openness to resuming rate hikes in 2025. A Reuters survey suggests a potential 25bps hike before year-end. This divergence from the Fed’s stance supports JPY strength.
Dovish Fed Outlook Intensifies:
Weak U.S. April PPI and retail sales figures reinforce expectations for multiple rate cuts this year. Falling Treasury yields and soft inflation readings weigh heavily on the dollar.
Resistance : 146.75 , 145.87
Support : 144.91 , 143.52
USDJPY and GBPJPY Further drop?Hello traders, this is a complete multiple timeframe analysis of this pair. We see could find significant trading opportunities as per analysis upon price action confirmation we may take this trade. Smash the like button if you find value in this analysis and drop a comment if you have any questions or let me know which pair to cover in my next analysis.
