USDJPY BREAKOUT BULLISH PATTERN Technical Pattern Analysis
Current Trend:
USD/JPY has shown a strong bullish structure, characterized by higher highs and higher lows. This indicates increasing buying pressure and positive momentum.
Possible Bullish Patterns Observed:
Ascending Triangle: This is a bullish continuation pattern often indicating that buyers are gaining strength before a breakout.
Bullish Flag: A short-term consolidation that generally resolves in the direction of the previous trend (upward).
Breakout Above Resistance: Recent candles show breakout attempts above key resistance zones, validating bullish sentiment.
Key Support and Resistance Levels
Immediate Support: 144.50–145.00
1st Resistance / Target Zone: 146.400
2nd Resistance / Target Zone: 147.900
Final Resistance / Target Zone: 150.200
Usdjpylong
USDJPY .. LONGOANDA:USDJPY
Price is nearing a critical level around .
No setup, no trade. For me, a solid plan always comes before any prediction.
****If the zone is broken and confirmed with a retest, I’ll adjust my plan accordingly for a possible reverse trade.

USDJPY and GBPJPY Analysis todayHello traders, this is a complete multiple timeframe analysis of this pair. We see could find significant trading opportunities as per analysis upon price action confirmation we may take this trade. Smash the like button if you find value in this analysis and drop a comment if you have any questions or let me know which pair to cover in my next analysis.

USD/JPY) Bullish trand analysis Read The ChaptianSMC Trading point update
Technical analysis of USD/JPY on the 2-hour timeframe, and it presents a bullish continuation setup. Here's a breakdown of the key elements and the idea behind the analysis:
---
1. Ascending Channel Formation
The price is trading within an ascending channel, suggesting a controlled uptrend.
Higher highs and higher lows confirm the trend structure.
2. Key Support and Fair Value Gap (FVG)
There’s a well-identified support level where price has bounced before (highlighted in yellow).
A Fair Value Gap (FVG) zone is marked slightly above the support level, which could act as a short-term demand area.
Price is currently pulling back into this zone, potentially setting up a buying opportunity.
3. EMA 200 Support
The 200 EMA (~143.78) is acting as dynamic support just below the current price.
If price drops further, this level may offer strong technical support.
4. RSI Momentum
RSI is above 50 (currently 56.37), supporting the bullish trend and showing room for continued upside.
5. Target Point
The chart anticipates a bounce off the support/FVG zone and a rally toward the upper boundary of the channel, targeting 147.153.
Mr SMC Trading point
---
Summary of the Idea:
This is a bullish continuation setup within an uptrend channel. The analyst expects a potential long entry around the FVG/support zone, with a target at the channel top (147.15). Confluence from the EMA 200, RSI, and previous structure supports this bullish bias.
Pales support boost 🚀 analysis follow)
Analysis of the Latest SignalsRecently, the situation in Ukraine and Russia has remained tense, and the conflict in the Middle East has escalated (such as the confrontation between Israel and the Houthi armed forces in Yemen), prompting funds to flow to traditional safe - haven currencies. However, the Bank of Japan (BoJ) maintained a dovish stance last week and did not clarify the interest - rate - hike path, which limited the upside potential of the yen.
Although inflation in Japan persists and wage growth is strong (the largest increase in 34 years), the BoJ's cautious attitude towards economic recovery has led the market to lower the interest - rate - hike expectations for June and July, putting pressure on the yen.
you are currently struggling with losses, or are unsure which of the numerous trading strategies to follow, at this moment, you can choose to observe the operations within our channel.

USDJPY Retest of Supply Zone Before Bearish ContinuationUSDJPY pair is reacting to key supply around 143.70–144.00 but shows signs of weakness after failing to hold above this level. With renewed risk-off sentiment and escalating global trade tensions—especially involving Japan and the U.S.—this pair may be setting up for a bearish continuation. Here's what both the chart and macro backdrop suggest.
📊 Technical Breakdown (4H Chart)
Key Supply Zone Retested:
The pair retraced into a previously broken structure zone (blue box), rejecting the 143.70–144.00 area multiple times.
Price is now forming lower highs, indicating bearish pressure building beneath resistance.
Bearish Continuation Pattern:
Price action resembles a bear flag, with a minor pullback likely before continuation lower.
A retest of 143.00–143.50 could serve as an ideal sell zone.
Major Support Levels:
142.04–142.02: Immediate support, already tested.
140.16: Key structure low from late April.
138.04: Final measured move target based on Fibonacci extension and prior demand zone.
Bearish Trade Setup:
Entry Zone: 143.00–143.50
Stop: Above 145.35
TP1: 142.00
TP2: 140.15
TP3: 138.00
🌐 Macro Fundamentals
Trump Tariffs Stir Instability:
President Trump is pressing Japan in trade talks with threats of new tariffs, already impacting investor confidence
A 25% tariff on Japanese auto exports has gone into effect, disrupting trade negotiations.
Urgency for a Deal, But No Progress Yet:
Trump says multiple deals are “coming,” but little substance has emerged. Analysts fear economic fallout and potential global recession if tensions continue
JPY Strengthening on Safe-Haven Flows:
With U.S. economic indicators weakening and global uncertainty rising, the yen may benefit from risk aversion.
✅ Summary
USDJPY remains vulnerable to downside continuation from the 143–144 resistance zone. If price breaks below 142.00 again with conviction, expect momentum to build toward 140.15 and potentially 138.00.

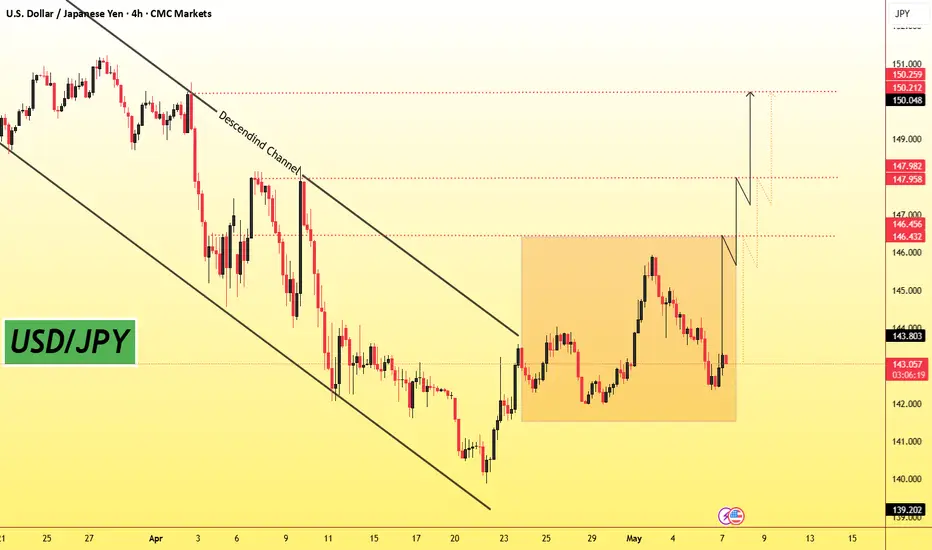
Bullish Breakout from Falling WedgeThe exchange rate of the US dollar against the Japanese yen shows a slight downward trend. The opening rate of the US dollar against the Japanese yen on that day was 144.8740. During the trading session, it hit a high of 144.9890 and a low of 144.085. The latest trading price is 144.082, which is 0.60% lower than the closing price of 144.9180 in the New York foreign exchange market on the previous trading day.
Buffett has warned of the risks of the US dollar, and funds may flow to safe - haven assets such as the Japanese yen, which may have had a certain impact on the exchange rate of the US dollar against the Japanese yen. On the other hand, from a technical perspective, according to the chart data, the "Daily Chart PP" of the US dollar / Japanese yen shows that its pivot point is at 158.27, and the maximum coverage range of the corresponding support and resistance is 157.29 - 159.33. The current exchange rate is at a relatively low level and may be attracted by the lower support level.
you are currently struggling with losses, or are unsure which of the numerous trading strategies to follow, at this moment, you can choose to observe the operations within our channel.

USDJPY and GBPJPY Analysis todayHello traders, this is a complete multiple timeframe analysis of this pair. We see could find significant trading opportunities as per analysis upon price action confirmation we may take this trade. Smash the like button if you find value in this analysis and drop a comment if you have any questions or let me know which pair to cover in my next analysis.

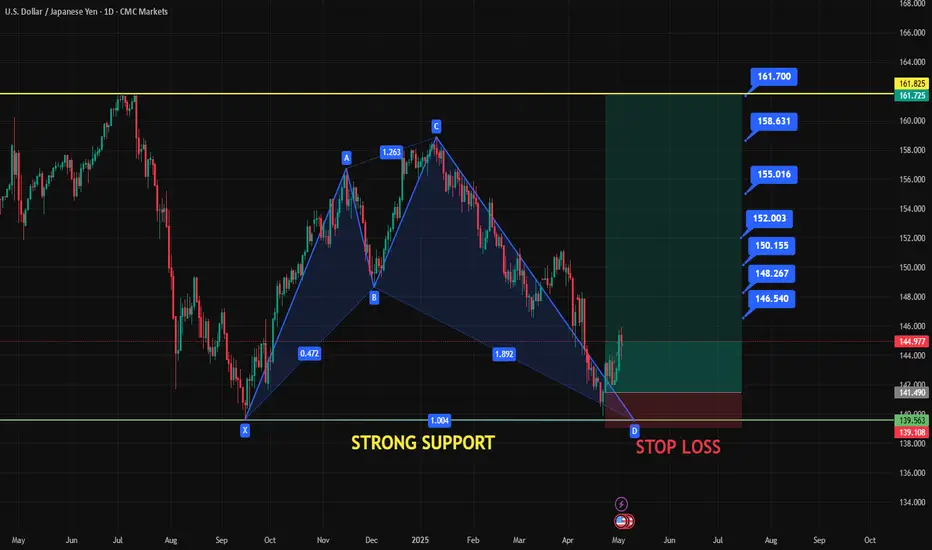
USDJPY WILL FLY TO 161 !!HELLO TRADES
As you can see a harmonic pattren on Daily Chart for this pair udsjpy we have a great oppritunity to join the Us Dollar Rally we can see a horizontal Support was tested and and its moving to given Targets chart is simple and easy to ready make a proper research before taking any trade these are only dail based valid targets if not break given Stop loss We need ur Supports and comments Stay Tuned for more update ...
USDJPY Daily & H4 Forecasts, Technical Analysis & Trading IdeaTechnical analysis is on the chart!
No description needed!
FX:USDJPY
________________________________________________________________
❤️ If you find this helpful and want more FREE forecasts in TradingView,
. . . . . . . . Hit the 'BOOST' button 👍
. . . . . . . . . . . Drop some feedback in the comments below! (e.g., What did you find most useful? How can we improve?)
🙏 Your support is appreciated!
Now, it's your turn!
Be sure to leave a comment; let us know how you see this opportunity and forecast.
Have a successful week,
ForecastCity Support Team

Technicals USDJPY Key Level (Horizontal Resistance)
A horizontal resistance zone around 143.90 has been tested multiple times.
Price is currently retesting this zone, marked as an "Entry Zone", suggesting a potential breakout or rejection.
2. Price Structure
Prior downtrend bottomed near 140.00, then formed higher lows, showing a potential trend reversal.
Current price is approaching the resistance with strong bullish candles, indicating possible momentum buildup.
3. Volume
Volume spikes align with swing highs and lows, suggesting these moves were backed by stronger participation.
4. Scenarios Outlined
Bullish Path (Black Arrow): Breakout above the entry zone could lead to targets near 147.00–150.00, continuing a bullish reversal.
Bearish Path (Red Wave): Rejection at the resistance may cause a drop toward 140.00, forming a ranging or distribution pattern.
The Fed (USD) maintains relatively high interest rates, while the BoJ (JPY) continues a dovish stance, creating upward pressure on USD/JPY.

USD/JPYThe Japanese Yen (JPY) oscillates in a narrow trading band at the start of a new week and remains close to a two-week trough touched against its American counterpart on Friday. Mixed signals from the US and China temper hopes for a quick resolution of the trade conflict between the world's two largest economies, which, in turn, offers support to the safe-haven JPY. Moreover, expectations that Japan will strike a trade deal with the US turn out to be another factor underpinning the JPY.
Meanwhile, investors have been scaling back their bets for an immediate interest rate hike by the Bank of Japan (BoJ) as rising economic risks from US tariffs overshadow signs of broadening inflation in Japan. This holds back the JPY bulls from placing aggressive bets, which, along with a modest US Dollar (USD) uptick, acts as a tailwind for the USD/JPY pair. However, the divergent BoJ-Federal Reserve (Fed) policy expectations should cap the USD and benefit the lower-yielding JPY.

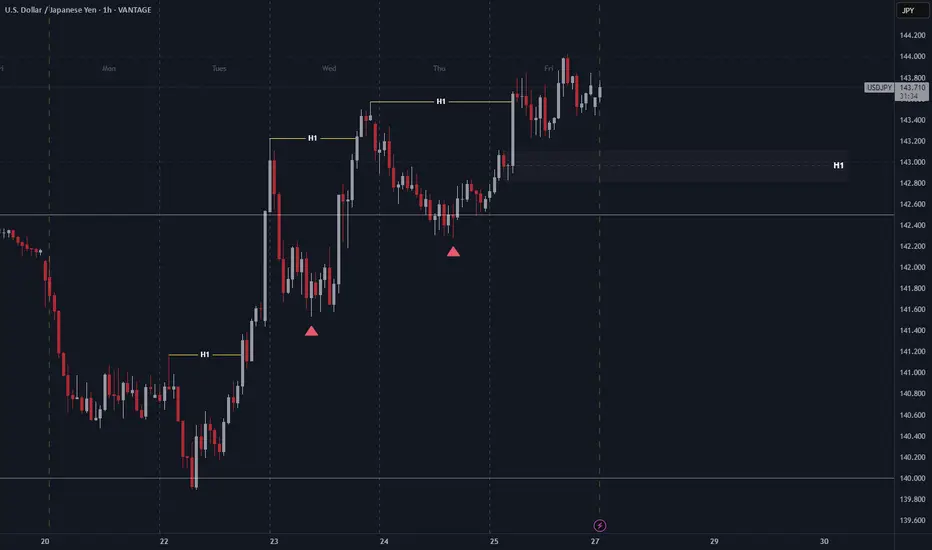
USD/JPY 1H Chart AnalysisStructure: Bullish, with higher highs (H1) and higher lows consistently forming.
Key Zone: A demand zone around 143.00 – 143.20. Price could pull back here for liquidity before continuing higher.
Current Price: Consolidating near 143.70 after a strong impulse.
Bias: Bullish, as long as price holds above 143.00. Watching for a possible dip into demand before resuming the uptrend toward 144.20 highs.
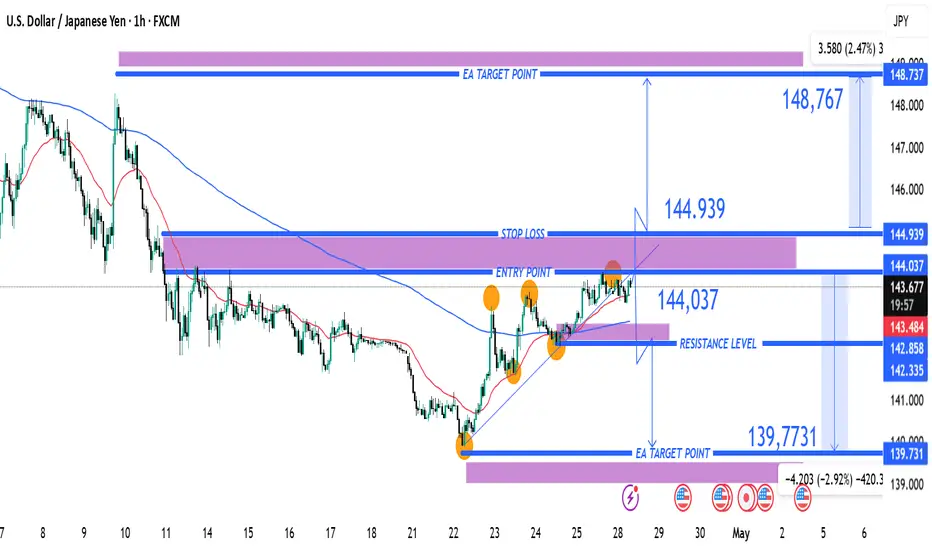
USD/JPY Bullish Breakout Setup: Key Resistance at 144.939 and TaEntry Point: ~144.037
Stop Loss: ~144.939 (above the recent resistance zone)
Resistance Zone: Between 144.037 and 144.939 (highlighted by purple area)
First Target Point (EA Target Point): ~139.731 (Bearish target if reversal happens)
Second Target Point (Bullish EA Target Point): ~148.737
Current Price:
As of the chart, price is around 143.743, slightly below the entry point.
Possible Scenarios:
Bullish Breakout:
If price breaks and closes above 144.939, expect strong bullish momentum toward 148.737.
Confirmation: Look for strong bullish candles with volume above the resistance zone.
Bearish Rejection:
If price fails to break 144.939 and shows bearish reversal patterns (e.g., bearish engulfing), a pullback toward 144.037 or even down to 139.731 is likely.
Additional Notes:
The orange circles highlight key points where price respected trendlines and support zones — showing strong buyer interest.
A rising trendline (drawn underneath recent lows) supports the ongoing bullish structure.
Risk-Reward seems well balanced: small risk (~90 pips) for a potential reward (~400+ pips).
Summary:
Bias: Cautiously bullish, but watch carefully around the 144.939 resistance.
Action: Wait for a clean breakout or a rejection pattern before deciding.
USDJPY BULLISHMy deeply studied quantitative analysis indicates that price bears an overall bullish sentiment and that it will get to 150.150

buy is coming on USDJPYThe USD/JPY pair recently experienced a bearish movement, which is largely influenced by heightened concerns surrounding the ongoing trade and tariff tensions between the U.S. and its global counterparts. This risk-off sentiment triggered a flight to safe-haven assets, weighing on the pair.
However, price action has now approached a key trendline support zone, which has held firmly in previous sessions. Technical indicators like RSI are also beginning to show signs of bullish divergence, suggesting a potential reversal. If this trendline continues to act as strong support, we may see a bullish bounce from the current level, aligning with the overall ascending trend structure but if the trade break these support zones, then the bearish movement might continues
for now we will be watching for confirmation signals such as bullish candlestick patterns or a break above near-term resistance levels to validate the upward movement.
USDJPY - Analysis and Potential Setups (Intraday- 25.04.25)Overall Trend & Context:
This pair is in an overall uptrend and has reacted off the 140.00 support levels (as well as the 200 EMA on the Daily chart).
Technical Findings:
Price is trading above 25, 50,100 and 200 EMA's on intraday charts.
Powerful break of structure which leaves no question about bullish force.
Current consolidation - Demand needs to be built before continuation.
Notes:
Price is currently at a historic support level however has not closed above daily supply, we are still in the area of doing so.
Manage your risk, take the trade with confirmations only.
USDJPY Buy UpdateUSDJPY Buyers stepping in fully...
Analyzing the information from what the yearly candle printed a strong buy is building up at these level
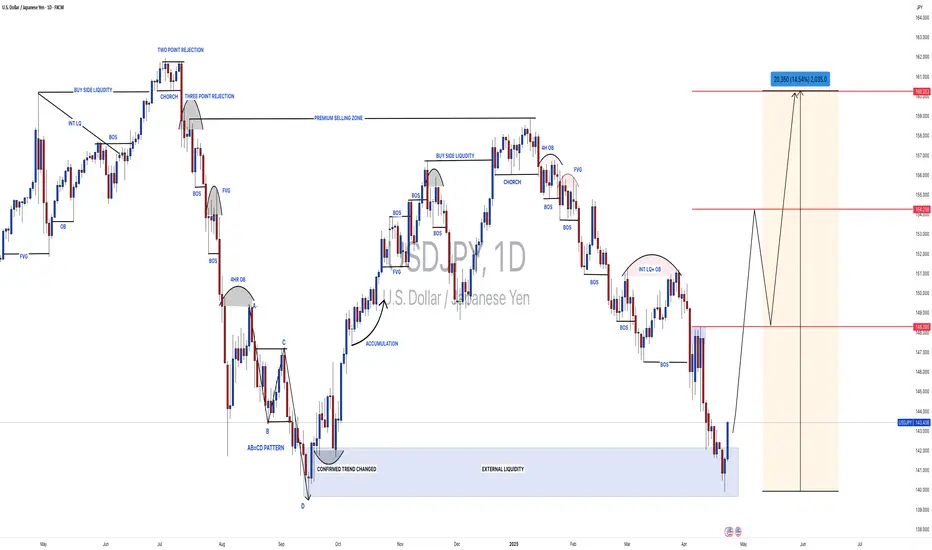
#USDJPY: 2050+ Pips Swing Buy| Trend Confirmed| Comment Views? **FX:USDJPY** A significant market movement has confirmed, indicating the potential for a substantial bullish swing that could reach approximately 2050 pips. Three targets have been identified, allowing you to select the one that aligns best with your analysis. The primary catalyst for this move is the reversal of the Japanese Yen (JPY) to a bearish trend. It is crucial to employ precise risk management techniques and exercise caution during this period.
Good luck and trade safely.
Thanks for your support! 😊
If you want to help us out, here are a few things you can do:
- Like our ideas
- Comment on our ideas
- Share our ideas
Team Setupsfx_
❤️
USDJPY Short Term Buy Trading Plan Update!!!Hi Traders, on April 23rd I shared this idea "USDJPY Short Term Buy Trading Plan"
I expected bullish continuation higher from the marked Fibonacci support zones. You can read the full post using the link above.
Price reached the first Fibonacci support zone, respected it and bounced higher as expected!!!
If you enjoy this idea, don’t forget to LIKE 👍, FOLLOW ✅, SHARE 🙌, and COMMENT ✍! Drop your thoughts and charts below to keep the discussion going. Your support helps keep this content free and reach more people! 🚀
-------------------------------------------------------------------------------------------------------------------
Disclosure: I am part of Trade Nation's Influencer program and receive a monthly fee for using their TradingView charts in my analysis.
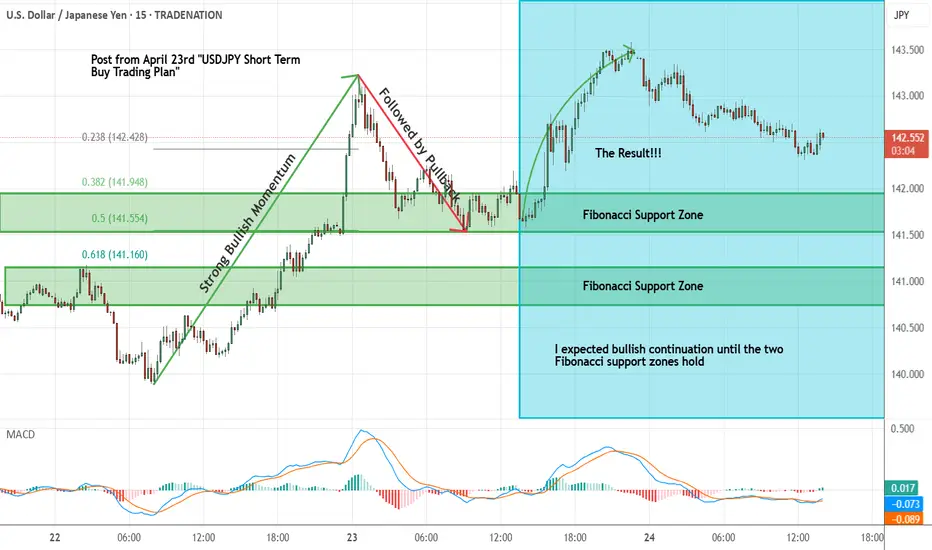
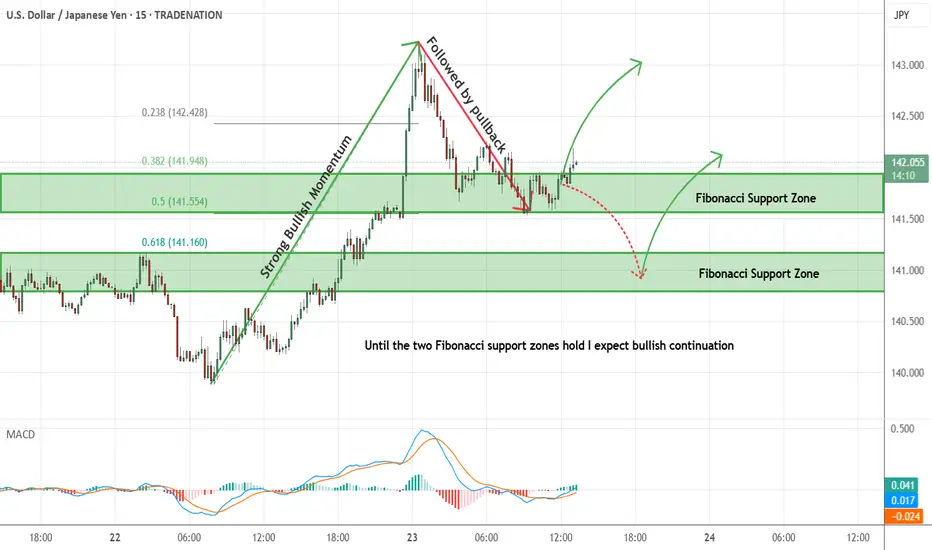
USDJPY Short Term Buy Trading PlanM15 - Strong bullish momentum followed by a pullback
No opposite signs
Expecting bullish continuation until the two Fibonacci support zones hold.
If you enjoy this idea, don’t forget to LIKE 👍, FOLLOW ✅, SHARE 🙌, and COMMENT ✍! Drop your thoughts and charts below to keep the discussion going. Your support helps keep this content free and reach more people! 🚀
--------------------------------------------------------------------------------------------------------------------
Disclosure: I am part of Trade Nation's Influencer program and receive a monthly fee for using their TradingView charts in my analysis.
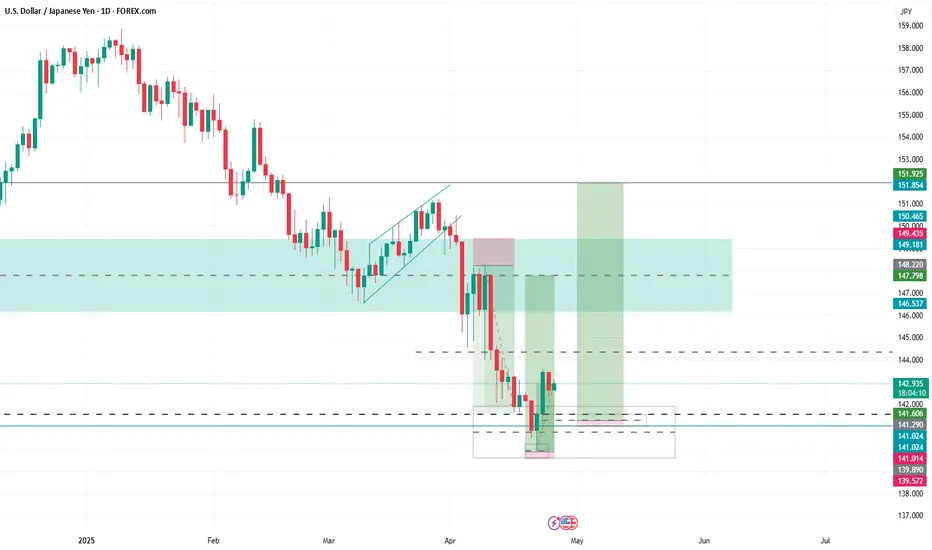
Japanese Yen seems poised to appreciate further against weaker UFrom a technical perspective, the daily Relative Strength Index (RSI) is already flashing slightly oversold conditions and warrants some caution for bearish traders. Hence, it will be prudent to wait for some near-term consolidation or a modest bounce before positioning for an extension of the USD/JPY pair's well-established downtrend witnessed over the past three months or so.
In the meantime, attempted recovery might now confront some resistance near the 141.60-141.65 region. This is followed by the 142.00 round figure and the 142.40-142.45 hurdle, above which a fresh bout of a short-covering move could lift the USD/JPY pair to the 143.00 mark en route to the 143.25-143.30 zone. Any further move up, however, might still be seen as a selling opportunity.
On the flip side, a sustained break and acceptance below the 141.00 mark could be seen as a fresh trigger for bearish traders and makes the USD/JPY pair vulnerable. The subsequent downfall below the 140.45-140.40 intermediate support might expose the 140.00 psychological mark. The downward trajectory could extend to the 2024 yearly swing low, around the 139.60-139.55 region.

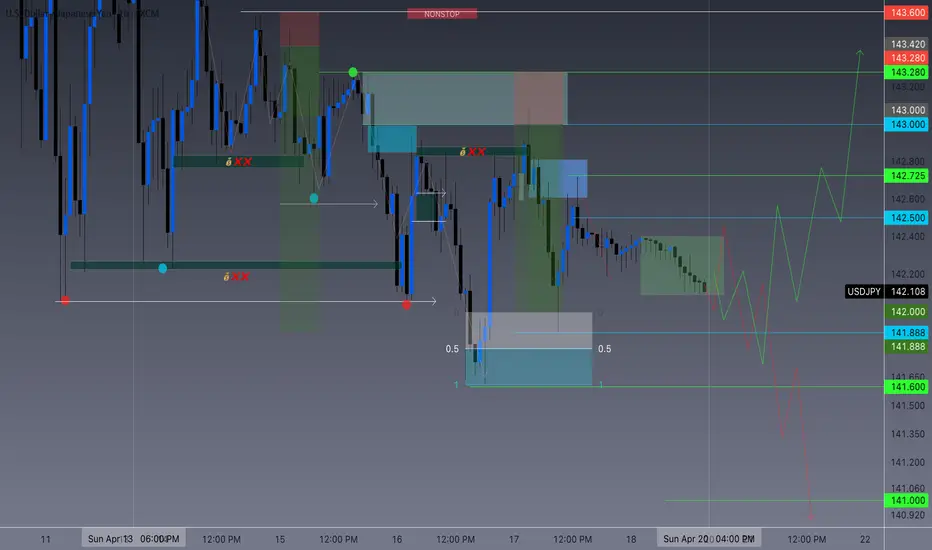
USDJPY Outlook – Bearish Continuation or Bullish Reversal??In this analysis, I'm breaking down the USDJPY structure starting from the 4H to identify the overall market direction (Bearish/Sells), then zooming into the 1H to fine-tune potential trade setups.
On the 4H timeframe, we’re assessing whether the recent bearish momentum is likely to continue or if price action is showing early signs of a bullish reversal. The LOW created at 141.800 level is our first target IF we continue to sell as its creating that LowerLow.
IF price closes bullish above 142.500, I will switch sides and look for potential buys.
On the 1H timeframe, I’m watching for a bullish liquidity sweep below141.888, followed by a clear break of structure to the upside on the 15m or 1H for more confirmation. That would indicate smart money accumulation and a potential shift in market sentiment—giving me confirmation to start looking for long setups.
🚀 Give me a boost and follow for upcoming $niper entries this week! 🦇🔥
CMCMARKETS:USDJPY