USD/JPY "The Ninja" Forex Bank Heist Plan (Day / Scalping Trade)🌟Hi! Hola! Ola! Bonjour! Hallo! Marhaba!🌟
Dear Money Makers & Robbers, 🤑 💰💸✈️
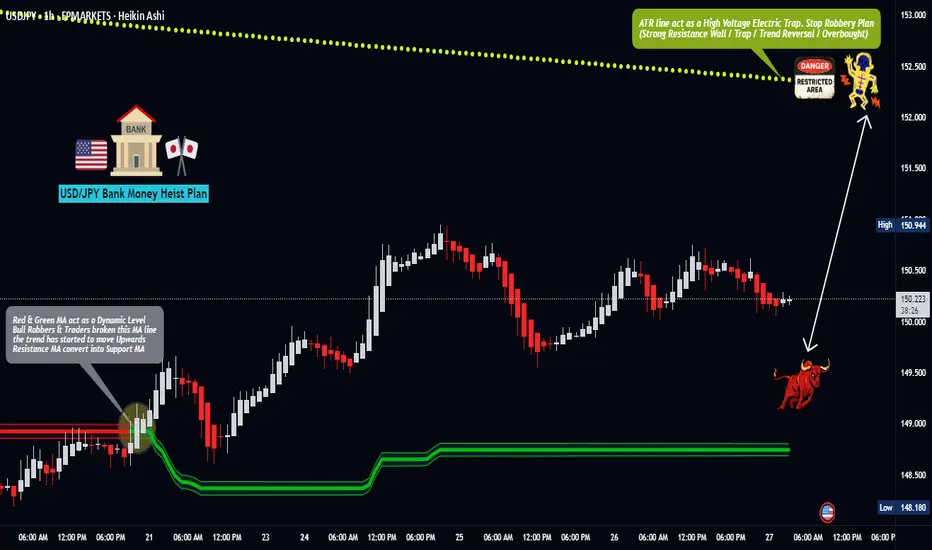
Based on 🔥Thief Trading style technical and fundamental analysis🔥, here is our master plan to heist the USD/JPY "The Ninja" Forex Bank . Please adhere to the strategy I've outlined in the chart, which emphasizes long entry. Our aim is the high-risk Red Zone. Risky level, overbought market, consolidation, trend reversal, trap at the level where traders and bearish robbers are stronger. 🏆💸"Take profit and treat yourself, traders. You deserve it!💪🏆🎉
Entry 📈 : "The vault is wide open! Swipe the Bullish loot at any price - the heist is on!
however I advise to Place buy limit orders within a 15 or 30 minute timeframe most recent or swing, low or high level.
Stop Loss 🛑:
Thief SL placed at the recent/swing low level Using the 1H timeframe (148.600) Day / scalping trade basis.
SL is based on your risk of the trade, lot size and how many multiple orders you have to take.
🏴☠️Target 🎯: 152.400 (or) Escape Before the Target
🧲Scalpers, take note 👀 : only scalp on the Long side. If you have a lot of money, you can go straight away; if not, you can join swing traders and carry out the robbery plan. Use trailing SL to safeguard your money 💰.
USD/JPY "The Ninja" Forex Bank Heist Plan (Day/Scalping Trade) is currently experiencing a bullishness,., driven by several key factors.
📰🗞️Get & Read the Fundamental, Macro, COT Report, Quantitative Analysis, Sentimental Outlook, Intermarket Analysis, Future trend targets.. go ahead to check 👉👉👉🔗
⚠️Trading Alert : News Releases and Position Management 📰 🗞️ 🚫🚏
As a reminder, news releases can have a significant impact on market prices and volatility. To minimize potential losses and protect your running positions,
we recommend the following:
Avoid taking new trades during news releases
Use trailing stop-loss orders to protect your running positions and lock in profits
💖Supporting our robbery plan 💥Hit the Boost Button💥 will enable us to effortlessly make and steal money 💰💵. Boost the strength of our robbery team. Every day in this market make money with ease by using the Thief Trading Style.🏆💪🤝❤️🎉🚀
I'll see you soon with another heist plan, so stay tuned 🤑🐱👤🤗🤩
Usdjpylong
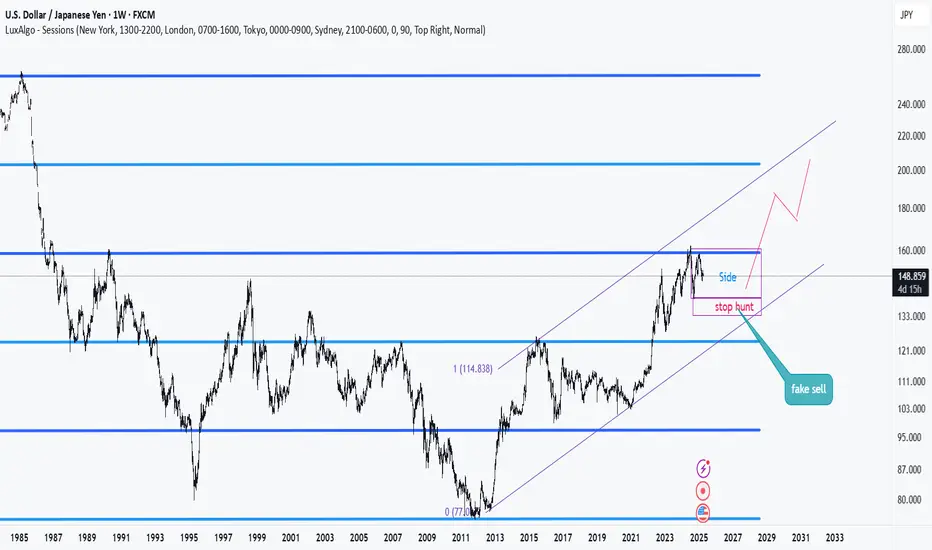
usdjpy road mapWeakly time frame we are in side way now, 90% of my trades was short this month, it is simple and clear.
USD/JPY(20250328)Today's AnalysisToday's buying and selling boundaries:
150.74
Support and resistance levels
151.83
151.42
151.16
150.32
150.06
149.66
Trading strategy:
If the price breaks through 151.16, consider buying, the first target price is 151.42
If the price breaks through 150.74, consider selling, the first target price is 150.32

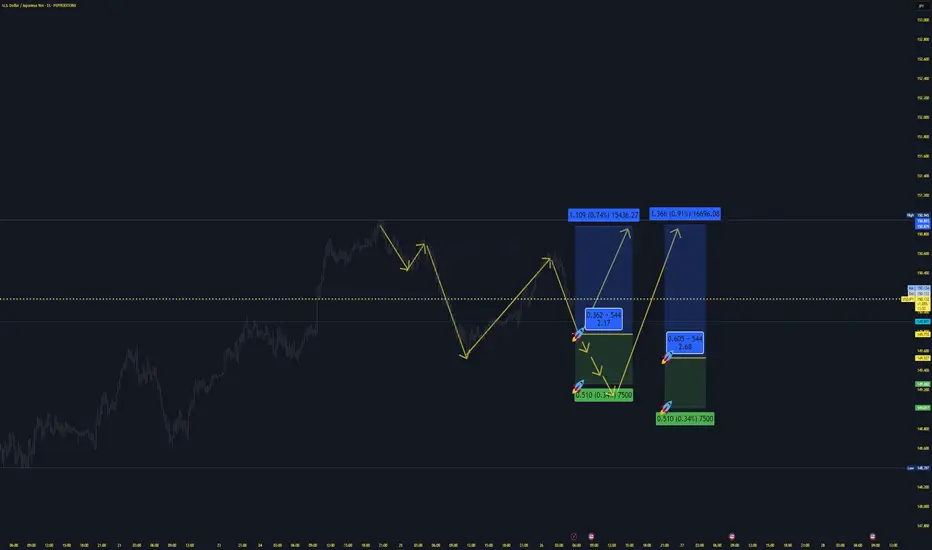
USDJPY LongAussie Inflation and BOJ Decision in focuse
Dollar getting strong because of FED Decision:,,No-rates cuts!,,
2 ways to trade this:
aggressive entry
and conservative entry:Risk to enter the 2nd approach(That price comes back to the 2nd entry is 37,25% but higher reward-risk ratio
Risk management based on your risk appetite
151.00 Cracks: Is USD/JPY’s Rally Over? Key Levels AheadFrom a fundamental perspective, the USD/JPY exchange rate retreated from around the 151.00 level. Despite the poor Japanese PMI data on Monday, investors bought the Japanese yen influenced by the hawkish outlook of the Bank of Japan (BoJ). The minutes of the January meeting showed that policymakers tend to tighten policies when appropriate. The BoJ governor also stated that the degree of monetary easing will be adjusted once the 2% inflation target is achieved.
Technically, the overnight breakout above the 150.00 psychological mark and the 200 - period Simple Moving Average (SMA) on the 4 - hour chart is a bullish signal. Indicators on the daily chart also support appreciation, and pullbacks may present buying opportunities. If the rate breaks below 150.00, it may accelerate its decline to support levels such as 149.30 - 149.25. Failure to hold these levels indicates that the rebound momentum has been exhausted and the trend may turn bearish. Conversely, if it stabilizes above 151.00, the upward resistance levels are successively 151.30, 151.75 (the 200 - day SMA), and it may even rise to 153.00.
I will share trading signals every day. All the signals have been accurate for a whole month in a row. If you also need them, please click on the link below the article to obtain them.
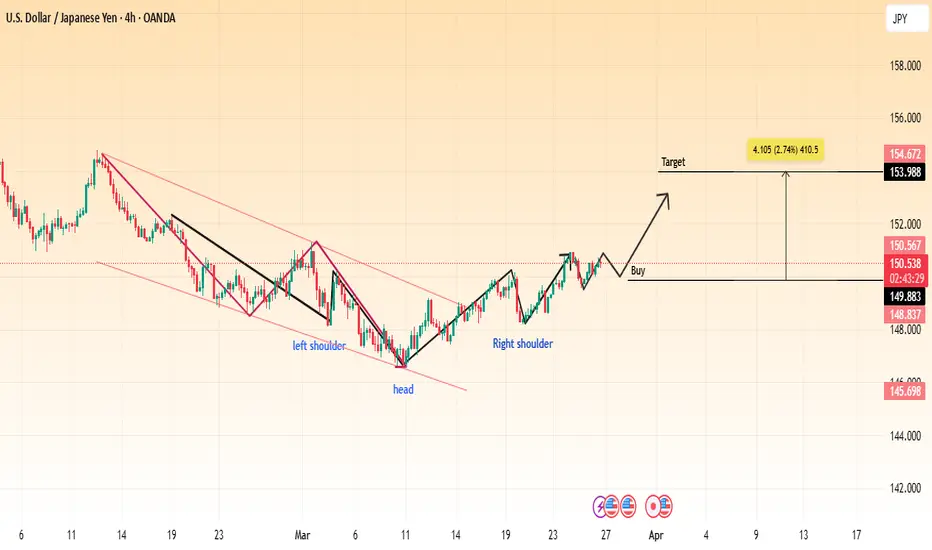
USD/JPY Bullish Reversal (Inverse Head & Shoulders)📌 Pattern: Inverse Head & Shoulders
📌 Analysis: The chart showcases an inverse head and shoulders pattern, a classic bullish reversal formation. The price has successfully broken out of the downward trendline, indicating potential upside movement.
🔹 Left Shoulder: Formed during the previous retracement.
🔹 Head: The lowest point of the pattern, marking strong support.
🔹 Right Shoulder: Completed with a breakout above resistance.
📈 Trading Plan:
✅ Entry (Buy): After a confirmed breakout and possible retest.
🎯 Target: 153.988 - 154.672 (2.74% potential gain).
🔻 Support: 149.883 - 148.837 (Stops should be placed accordingly).
📊 Conclusion:
If the price maintains above the breakout level, we may see a strong rally toward the resistance target. Watch for volume confirmation and pullback retests before entering a trade.
USDJPY 18K PROFIT LIVE TRADE AND BREAK DOWNUSD/JPY rebounds toward 150.50 on risk recovery
USD/JPY is bouncing back toward 150.50 in Wednesday's Asian session. The pair reverses US President Trump's fresh tariff threats and hawkish BoJ commentary-led drop, tracking the rebound in risk sentiment and the US Dollar. All eyes stay on US tariffs, data and Fedspeak.

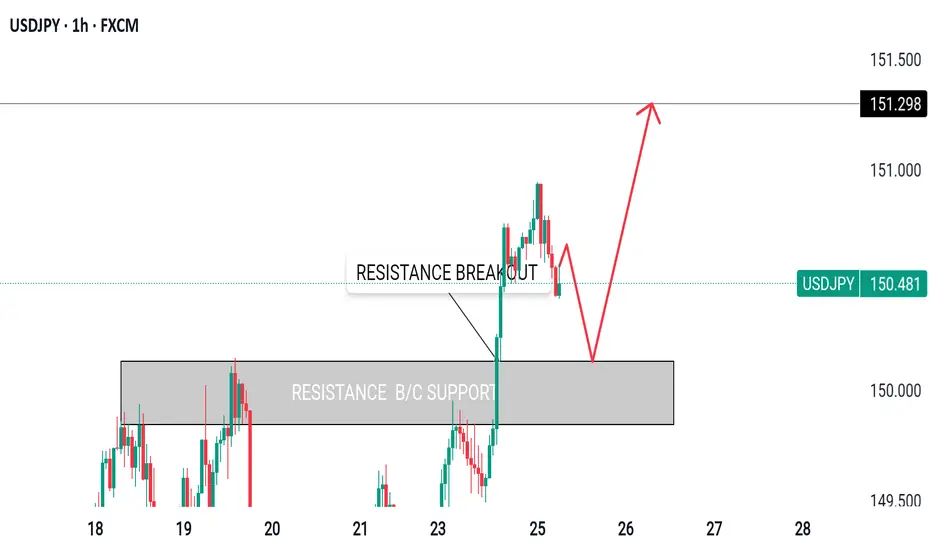
USDJPY R&S ANALYSIS IS READY Hello Guys Here Is Chart Of USDJPY in 1-H AT
Entry Limit: BUY Around 150.000
SUPPORT: 150.000 - 149.600
Target Will Be : 151.300
This analysis R&S the price respects the Support zone.And it went to Uptrend
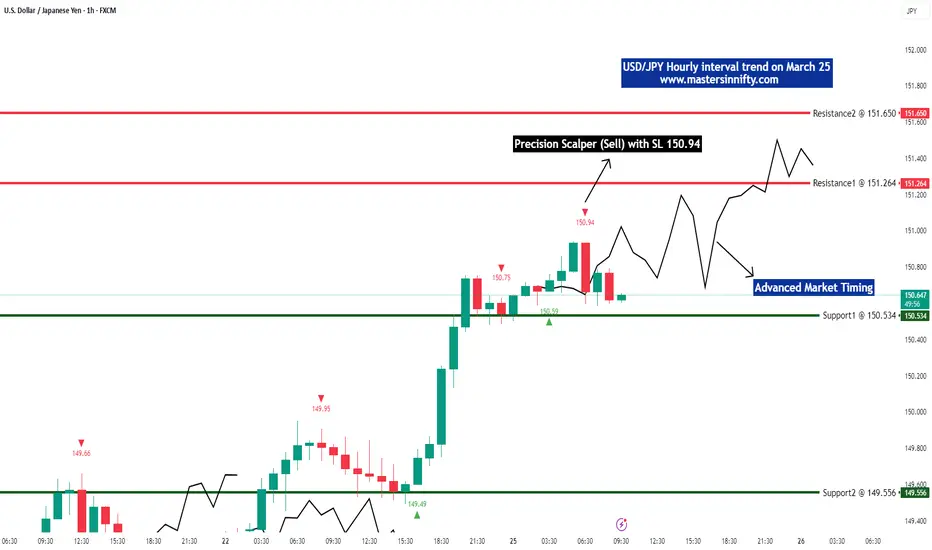
USD/JPY hourly trend on March 25thThis Forex pair is still bullish. Support at 150.534 and 149.556 and Resistance at 151.264 and 151.650. Our "Precision Scalper" indicator has confirmed Sell with a SL @ 150.94.
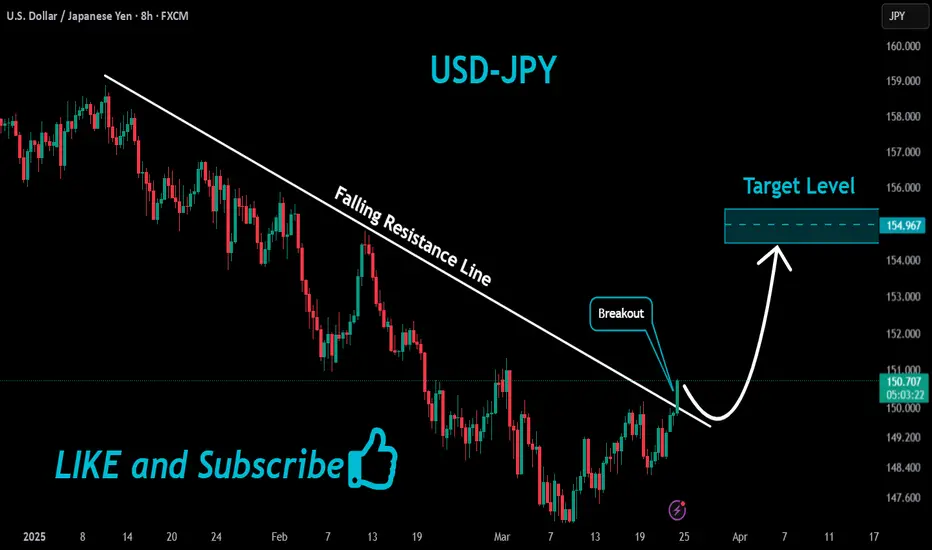
USDJPY Bullish Breakout!
HI,Traders !
USD-JPY was trading
Beneath the falling resistance
Line but now we are seeing a
Bullish breakout so we are
Now locally bullish biased
And we will be expecting a
Further bullish move up !
Comment and subscribe to help us grow !
USDJPY 1.2850 Long in Profit: Next Week's Take - Profit GuideThis week, the long position signal on USDJPY at the 1.28500 level has already started yielding profits. As we look ahead to next week, it is advisable to commence position closing once the price reaches the pre - determined target levels. Rest assured, I will persist in furnishing precise trading signals.
I will share trading signals every day. All the signals have been accurate for a whole month in a row. If you also need them, please click on the link below the article to obtain them.
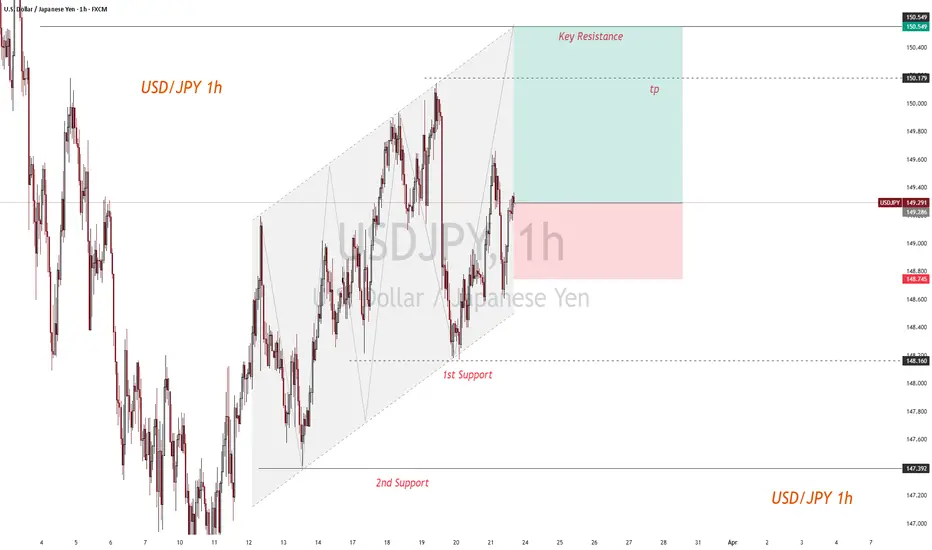
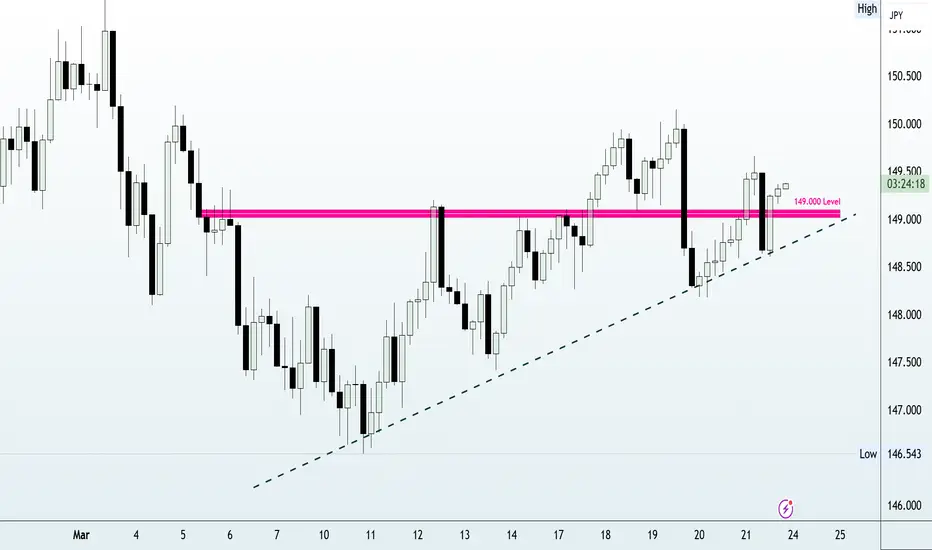
UJ Price Analysis: Key Insights for Next Week Trading DecisionThe USD/JPY pair is currently in a temporary uptrend within a broader consolidation, following a strong bearish move that started at the beginning of the year. The Y149.000 level will be a key zone for our trading decisions.
📌 Key Technical Outlook:
🔹 Price faced selling pressure around Y150.000, leading to a pullback.
🔹 As long as price holds above the ascending trendline & Y149.000, I’ll be looking for buying opportunities in the short term.
🔹 A breakdown and retest of Y149.000 and the trendline would confirm a resumption of the long-term bearish structure.
📌 Major Market Drivers:
🔹 Federal Reserve’s Policy Stance: Powell reiterated that rate cuts are not urgent, keeping the USD supported.
🔹 Trump’s Trade Tariffs: Expected to drive US inflation higher, adding strength to the Dollar.
🔹 Bank of Japan’s Hawkish Expectations: Japan’s largest trade union group (Rengo) secured a 5.4% pay rise, reinforcing expectations that the BoJ will tighten policy further this year.
🔹 Japan’s CPI Cooling Down: Lower inflation in Japan could weaken the Yen and offer USD/JPY support.
📅 Key Economic Events on Our Radar Next Week:
🗓 Tuesday: US S&P Global PMI – A key sentiment indicator for economic conditions.
🗓 Thursday: US GDP (Q4 Final) – A major market mover influencing the Fed’s policy direction.
🗓 Friday: Tokyo CPI & US Core PCE Index – The BoJ and Fed’s preferred inflation measures, critical for future rate decisions.
I’ll be watching how USD/JPY behaves around Y149.000 for confirmation of trend continuation or a bearish continuation. We’ll discuss this in-depth during Forex Morning Mastery tomorrow—stay tuned! 🔥📈 #USDJPY #Forex #MarketAnalysis
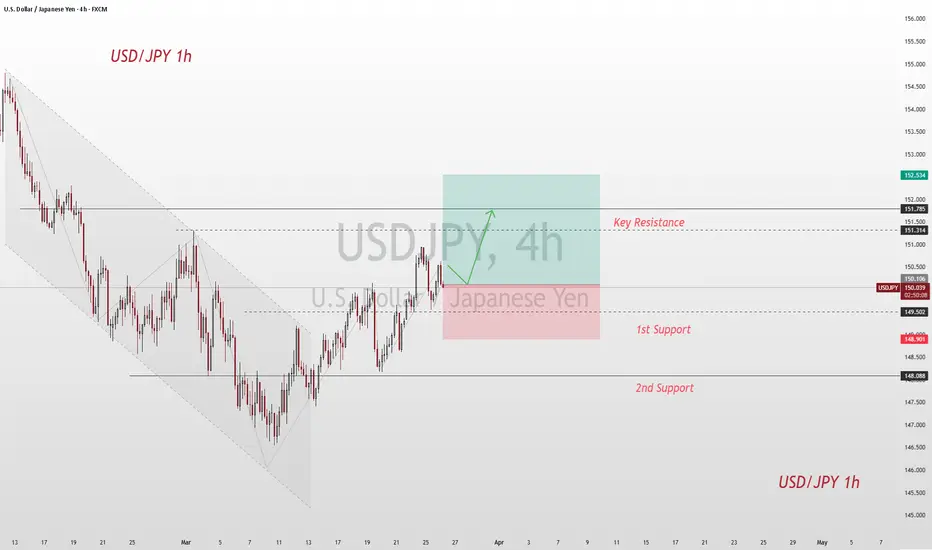
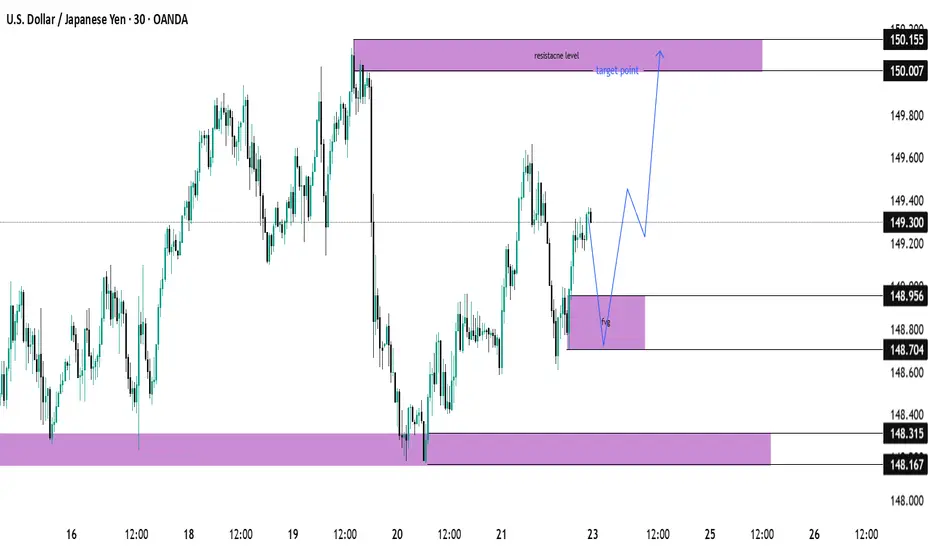
USD/JPY Bullish Outlook – Targeting Key Resistance at 150.155USD/JPY Technical Analysis – Bullish Outlook Toward Resistance
Chart Insights:
The price is currently in a recovery phase after a significant drop.
A Fair Value Gap (FVG) zone has been identified, suggesting a potential pullback before further movement.
The target point aligns with the resistance level around 150.155, which acts as a key supply zone.
Potential Scenario:
Price may retrace into the FVG zone around 148.704 – 148.956.
A bullish rebound from this level could drive price toward the resistance at 150.155.
If price reaches the resistance level, further rejection or continuation will depend on market conditions.
Key Levels:
Support Zone: 148.167 – 148.315
FVG Area: 148.704 – 148.956
Resistance Zone: 150.007 – 150.155 (Target area)
Conclusion:
The current structure suggests a bullish bias if price respects the FVG zone for a push higher. However, a break below the FVG could signal further downside movement.
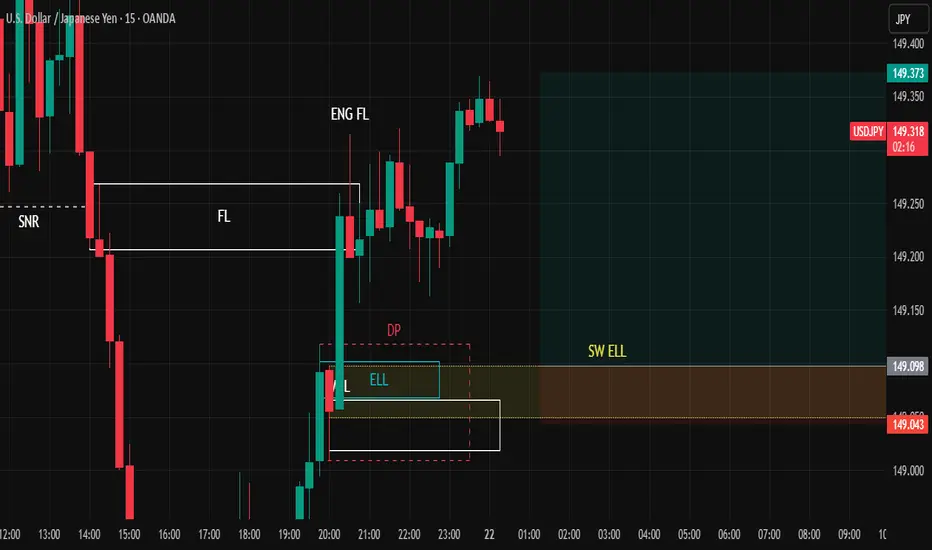
USDJPYAre you ready for scalp?
Buy USDJPY
Entry: 149.098
SL: 149.043
TP: 149.373
The reward is 4 times greater than your risk.
USDJPY LONG, and short USDJPY, Buy from the 1h orderblock until the next order upside, then sell until the next orderblock. Daily is bearish.
USDJPY Analysis todayHello traders, this is a complete multiple timeframe analysis of this pair. We see could find significant trading opportunities as per analysis upon price action confirmation we may take this trade. Smash the like button if you find value in this analysis and drop a comment if you have any questions or let me know which pair to cover in my next analysis.

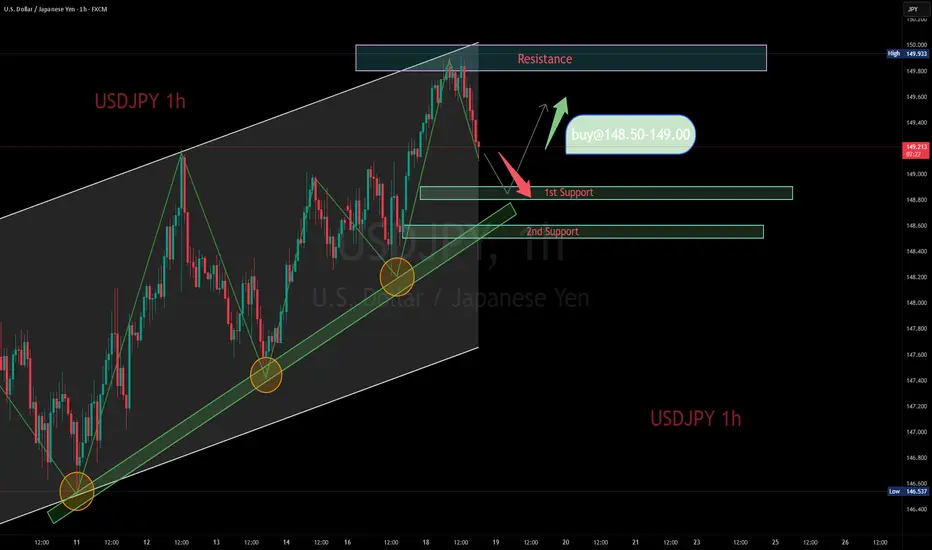
USDJPY Trading strategyThe USDJPY is currently at a critical level, with the price fluctuating around 149.00. The resistance level above is at 150.00, and if broken through, it may further test 151.00. The support level below is at 148.50, and if it falls below, it may drop to 148.00. Recently, the market has been focusing on the monetary policy trends of the Federal Reserve and the Bank of Japan. The strengthening of the US dollar and the weakness of the Japanese yen may push USDJPY higher.
USDJPY Trading strategy:
buy@148.50-149.00
tp:150.00-150.50-151.00
Traders, if this concept fits your style or you have insights, comment! I'm keen to hear.
For those who are seeking professional guidance in trading trend analysis, strategy formulation, and risk management, please click below to get the daily strategy updates.
USDJPY analysis todayHello traders, this is a complete multiple timeframe analysis of this pair. We see could find significant trading opportunities as per analysis upon price action confirmation we may take this trade. Smash the like button if you find value in this analysis and drop a comment if you have any questions or let me know which pair to cover in my next analysis.

UsdJpy buy continuation Taking Yesterday's low as Inducement my point of interest is 149.034. I'm anticipating price to retrace back to that zone before pushing toward.
Kindly boost if you find this insightful 🫴
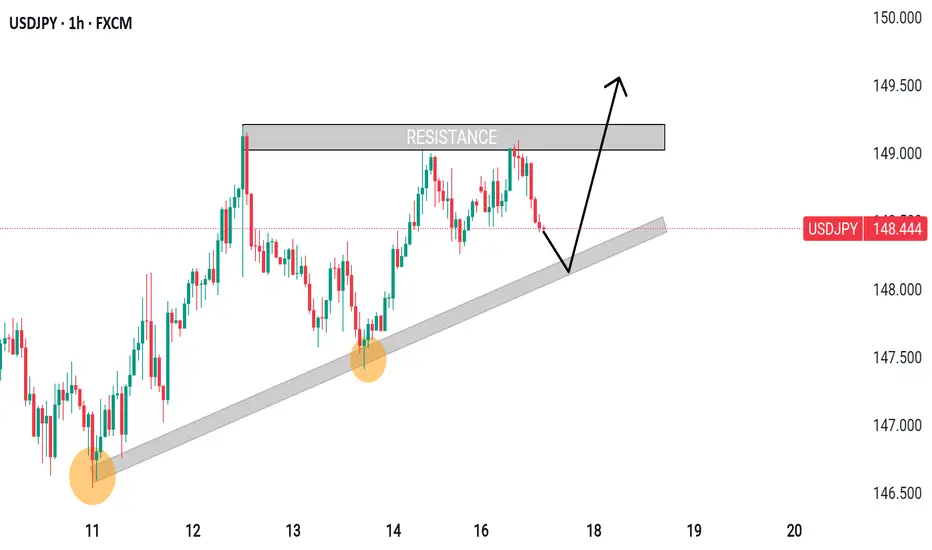
USDJPY S&R IN 1-H AT MUST WATCH OUTHello Guys Here Is Chart Of USDJPY in 1-H AT
Entry Level: BUY Around 148,300 - 148,000
Target Will Be : 149,300
Support: 148,000 The yellow circles highlight previous points where the price respected this trendline as support
However, if the price breaks below the trendline, the bullish scenario may be invalidated.
UsdJpy bullish continuation I was patiently waiting for price at 147.842 last week but it didn't come to my point of interest.
Nothing spoil, I'll watch how price reacts at 148.033, that's my assumed poi for the bullish continuation. If price didn't respect that zone then I'll be expecting price at 147.842
My draw on Liquidity 🧲 is the current higher high 149.193.
Kindly boost if you find this insightful 🫴

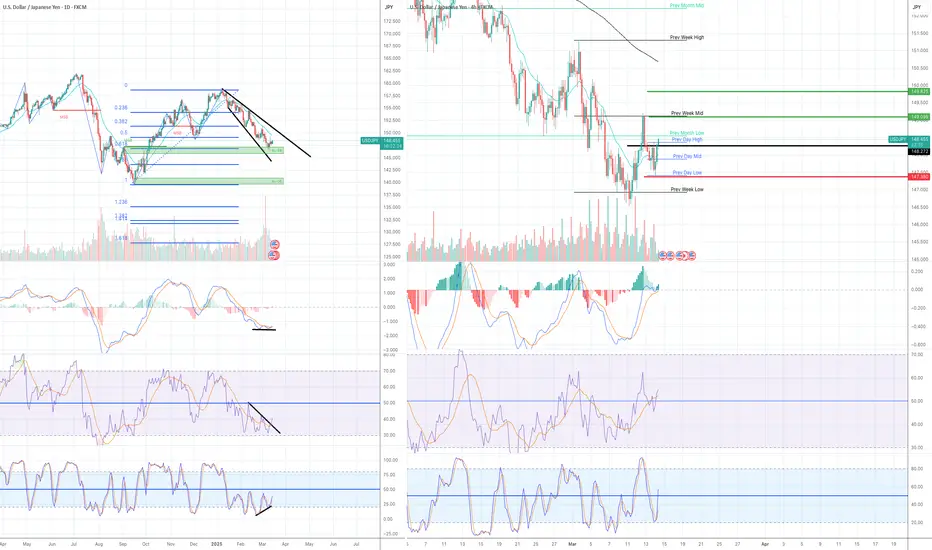
Long I opened two long positions for USDJPY pair:
My overall bias for USDJPY is bearish so I have been mainly shorting the pair but I saw a good set up wroth while to go long.
Trade set up:
Entry - 148.272 (black line in 4H chart)Target 1 - 149 (previous high and previous week mid price) - Green line in 4H chart)Target 2 - 149.82 (Green line in 4H chart)Stop loss- 147.38 (red line in 4H chart)
Reasons for this trade:
1) All momentum indicators have entered bull territory in 4H chart.
2) All daily momentum indicators are showing positive divergence.
3) All daily momentum indicators are still deep in the bear territory but have crossed to the upside, so it indicates the beginning of the potential corrective move to the upside.
4) The price has dropped to Fib 0.618 level and are boucing up to the upside in the daily chart
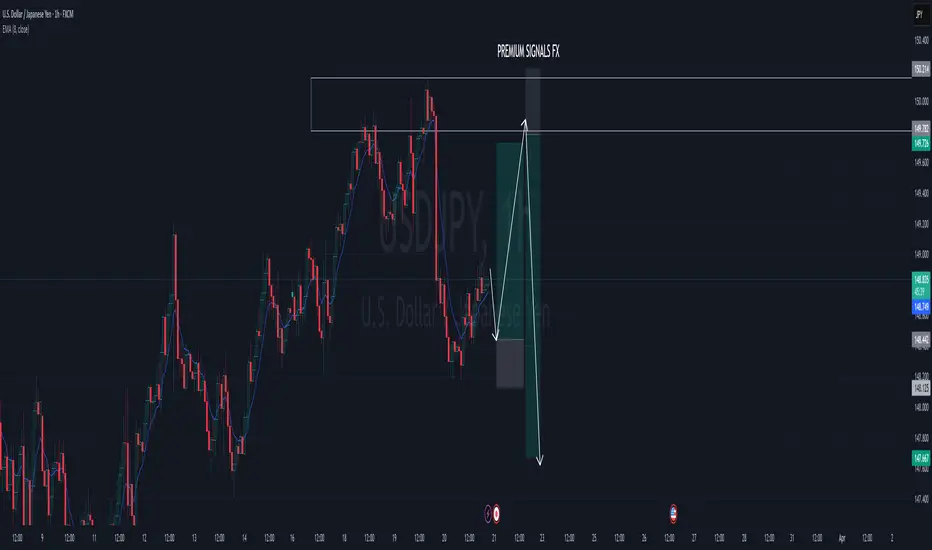
USD/JPY Price Rejection at Resistance with Potential Bearish.hello traders.
what are your thoughs on USD/JPY.
my idea is
. Trade Setup:
Entry: Around 148.153, aligning with the pullback area.
Stop Loss: Above 148.624, placed strategically to avoid minor fluctuations.
Take Profit Levels:
First Target: 147.596 – a potential support level where price may find temporary stability.
Final Target: 147.167 – deeper support level indicating further bearish continuation.
