USDJPY lonIn a positive trend, we are approaching the bottom of the range, which I expect to reverse, and we have a good position, and at the bottom of this range we have the sacred 86 line.
Usdjpylong
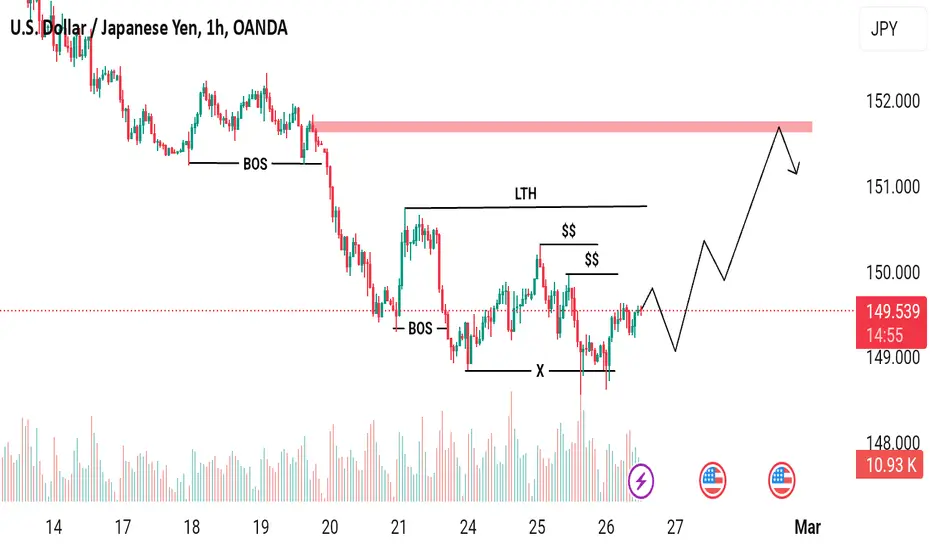
USDJPY rebound until level 60% fibbonacci USDJPY Rebound from the 1h orderblock until level 60% fibbonacci on daily timeframe.

USDJPY TRADE IDEA : LONG | BUY (12/03)Price has been ever so bullish. Taking advantage of that opportunity.
RR: 5
N.B.: This is not financial advice. Trade safely and with caution.
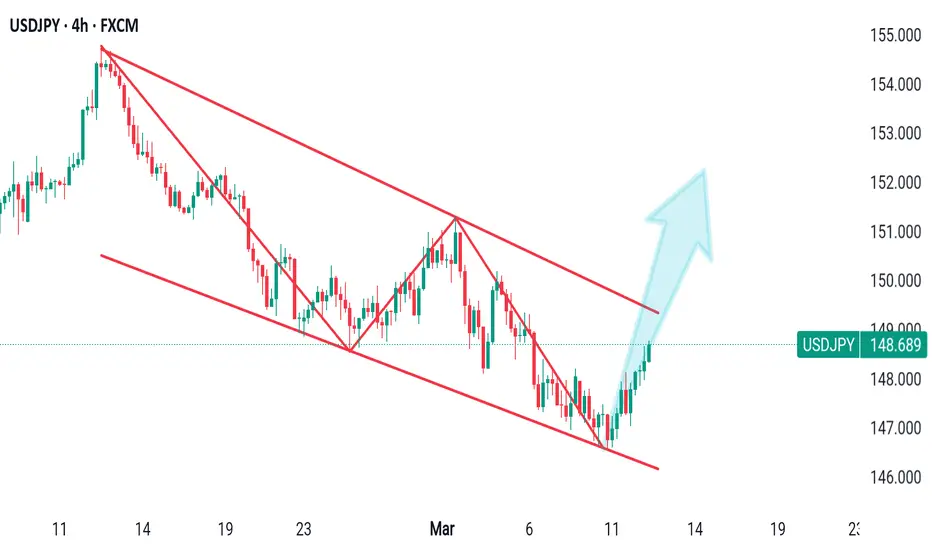
USDJPY MADE FALLING WEDGE PATTERN IN 4-H TA Hello Guys Here Is Chart Of USDJPY in 4-H AT
Entry Level: Buy Around 142.000
Support: lower Low around $140.000
Target Will Be : 154.000
If USDJPY breaks upper resistance level, the wedge pattern is successful,
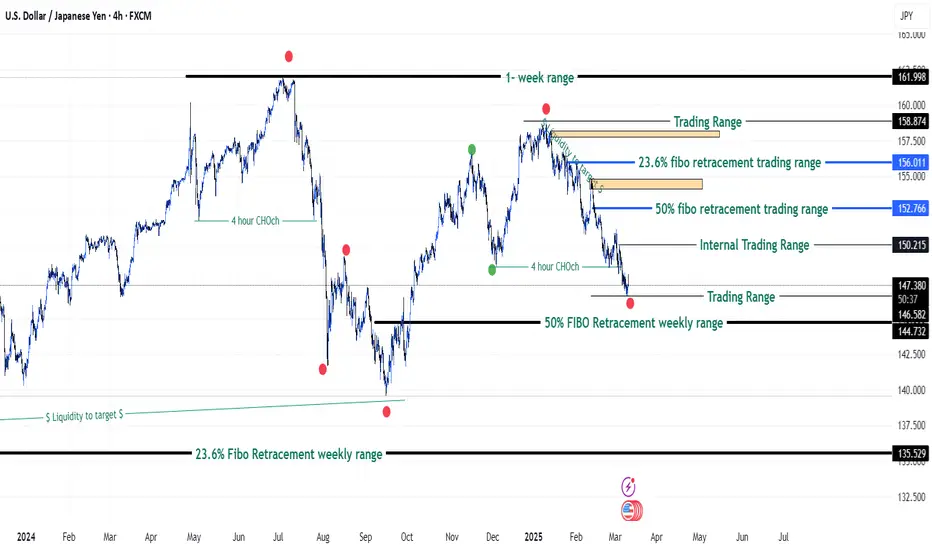
USDJPY Counter Trend Opportunities - Fxdollars - {11/03/2025}Educational Analysis says USDJPY may give countertrend opportunities from this range, according to my technical.
Broker - FXCM
So my analysis is based on a top-down approach from weekly to trend range to internal trend range.
The weekly trend range is long up to 170.000
Trading Range Approach is a long counter trend opportunity or pushback up to 155.000
The internal Trend Range Approach is a Long counter trend opportunity or pushback up to 150.000
or continue going down with an internal trading range or trading range up to 135.000
Let's see what this pair brings to the table for us in the future.
Please check the comment section to see how this turned out.
DISCLAIMER:-
This is not an entry signal. THIS IS ONLY EDUCATIONAL PURPOSE ANALYSIS.
I have no concerns with your profit and loss from this analysis.
I HAVE NO CONCERNS WITH YOUR PROFIT OR LOSS,
Happy Trading, Fx Dollars .
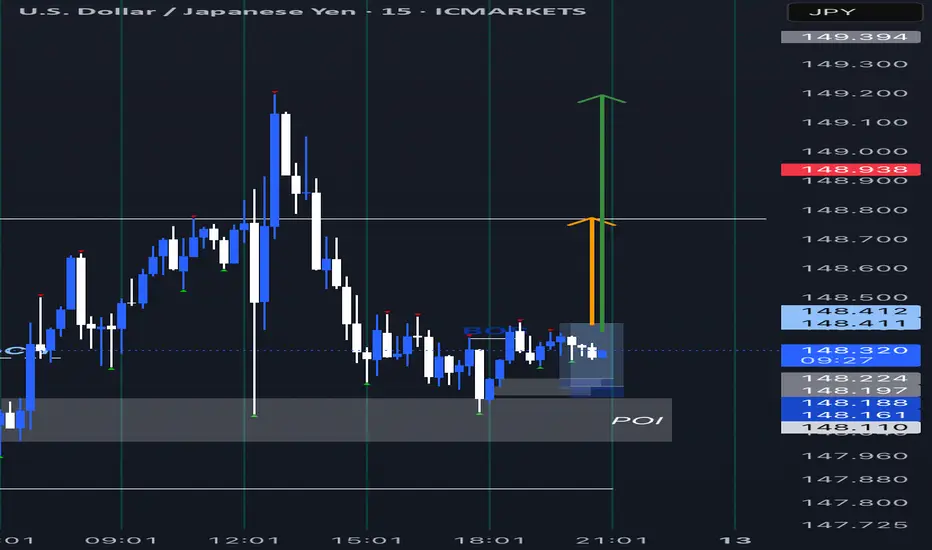
JPY Market Analysis Update – Key Level at 148.000Market Overview:
📈 Strong JPY Performance:
Expectations of another BoJ rate hike have pushed the Japanese Yen to perform strongly in the Asia-Pacific region.
📊 Record Net Long Positions:
Non-commercial traders' net long yen futures surged to 96K contracts (up from 61K), setting a 30-year record according to CFTC data.
Technical Insights:
📉 Descending Channel & Reversal Setup:
While bearish pressure has been evident, momentum is showing signs of easing, hinting at a potential stabilization or near-term bounce. A reversal setup is identified in the 147.000/148.000 zone.
🎯 Key Level:
Next week, the crucial level is 148.000. Be prepared for a buy signal if prices break above, or a sell signal if they remain below this level.
Upcoming Catalysts:
⏰ Fed Policy Uncertainty:
With Fed Chair Jerome Powell indicating that rate cuts are not imminent, this policy uncertainty could favor the US Dollar in the coming week, influencing the JPY further.
Keep an eye on the Consumer Price Index, Producer Price Index, and Michigan Consumer Sentiment Index.
Stay Tuned:
I'll provide a detailed update at the beginning of next week. Follow along for more insights and actionable trading strategies!
Happy Trading!
Disclaimer:
Forex and other market trading involve high risk and may not be for everyone. This content is educational only—not financial advice. Always assess your situation and consult a professional before investing. Past performance doesn’t guarantee future results.

Usdjpy sell now down more opportunity for pattern of crazy 1. Alternative Scenario (Bullish Counter to Bearish Setup):
While the chart is heavily bearish, showing a breakdown area and targeting 144.110, price currently holds above 147, which could act as interim support.
If price fails to break below 146.500, a bullish retracement to 148.500–149.000 is possible before any further downside.
Watch for a false breakdown and reversal signals near 146.500–147.000.
2. Volume Analysis:
Note that recent volume spikes around breakdown attempts could suggest that buyers are still active, absorbing selling pressure.
If volume dries up on further breakdown attempts, momentum for the drop may weaken.
3. Hidden Bullish Divergence:
If RSI/MACD (if added) shows higher lows while price makes lower lows, hidden bullish divergence could hint at a potential bounce — invalidating the straight move to 144 for now.
4. Invalidation Levels:
The 147.800–148.200 zone may serve as a key resistance; if price reclaims this area, it could negate the bearish outlook.
Above 149.500, bears would be invalidated, and we might return to test the 150.100 resistance mentioned in your chart.
5. Fundamental Factors:
Any USD news catalyst (like CPI, NFP, or Fed decisions) might shift momentum abruptly. If USD strengthens, JPY pairs could reverse the expected bearish move

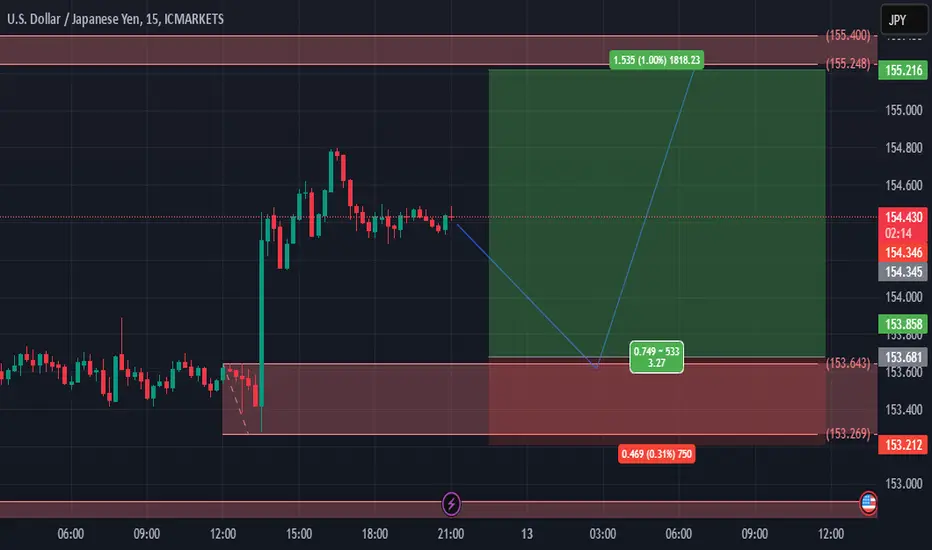
U.S. Dollar / Japanese YenHello and Respect to Dear Traders
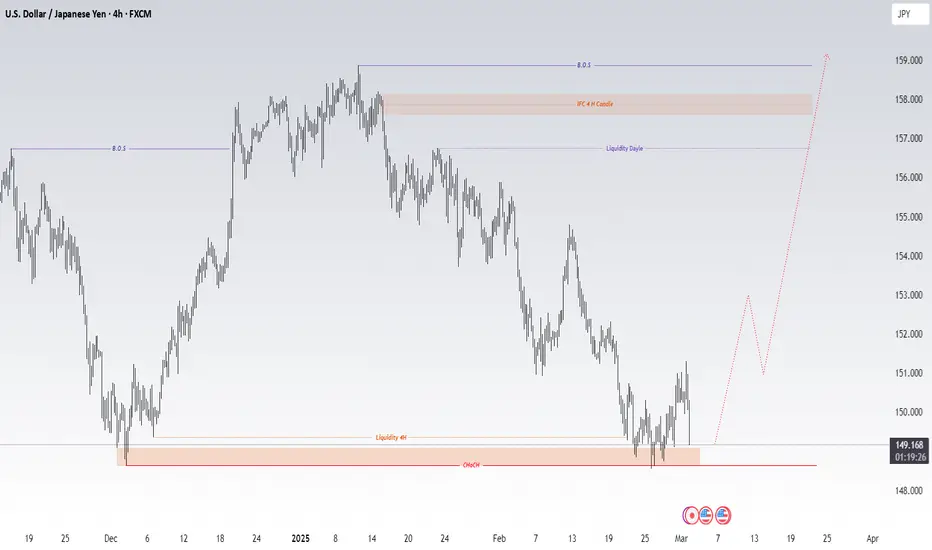
Last week, we received the necessary confirmations for the bullish trend of the Japanese yen chart, and we were waiting for the price to return to an optimal buying range. At this hour, I have obtained the essential confirmations, and we can utilize the 15-minute timeframe for optimal entry.
Specifically, based on recent fundamental news, the Japanese government has announced that interest rates in the country will not change in the near future, which could help strengthen the yen and boost its price. Therefore, this presents a suitable opportunity to enter a long-term buy position on the daily timeframe.
Keep in mind that this currency can be held until the main target.
Important Points:
Liquidity Daily: 156.755
IFC 4 H Candle: 157.617 & 158.136
And finally, our main target is 158.874.
Thank you for your support. A very simple and clear chart has been drawn for your use.
Wishing you all success!
Fereydoon Bahrami
A retail trader in the Wall Street Trading Center (Forex)
Risk Disclosure:
Trading in the Forex market is risky due to high price volatility. This analysis is solely my personal opinion and should not be considered financial advice. Please do your own research. You are responsible for any profits or losses resulting from this analysis.
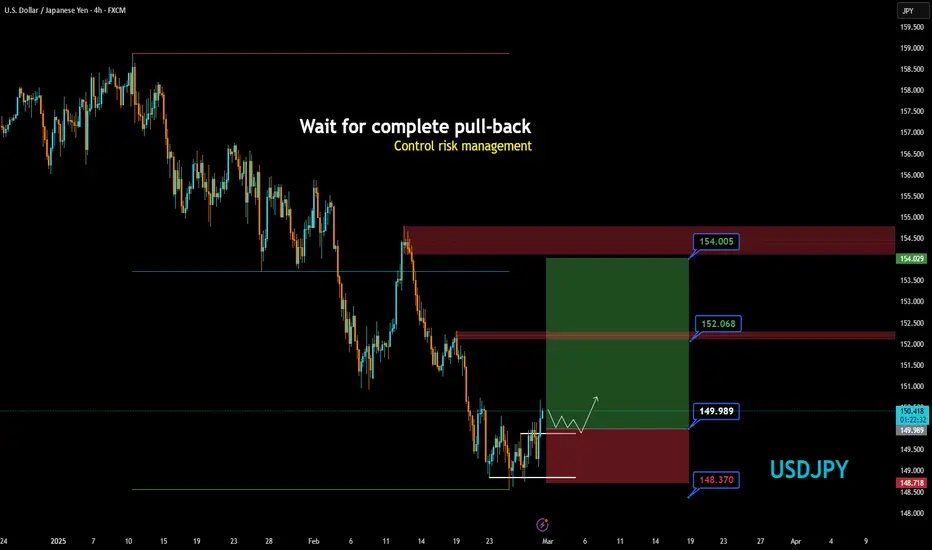
USDJPY BuyUSDJPY Trade Signal
📉 Pullback & Potential Reversal
Price Level: 150.41
Support Zone: 148.37 - 149.98
Resistance Targets: 152.06 / 154.00
📌 Trade Plan:
Wait for a pullback confirmation before entering long.
Stop Loss: Below 148.37
Targets: 152.06 → 154.00
⚠️ Risk Management: Control risk and wait for a clear breakout.
USDJPY Buy TradeUSDJPY buy trade can be taken below the mentioned area as it's break higher high on 4hrs to target mentioned in the chart.
Manage your risk according to your account size!

USD/JPY BUYThis analysis is based on the provided image and should not be considered financial advice. Trading involves risks, and it is essential to conduct your own research and consult with a financial advisor before making any trading decisions.
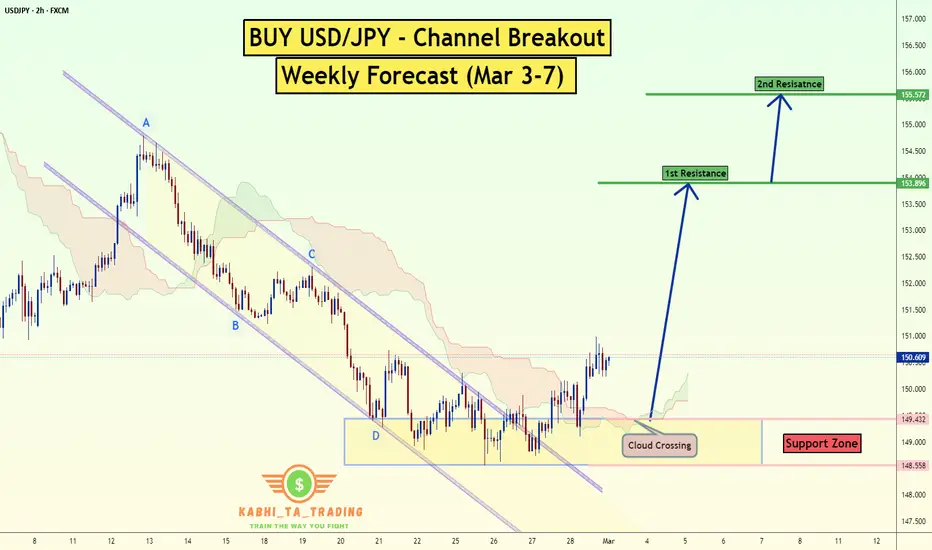
USD/JPY Channel Breakout (Weekly Forecast Mar 3-7)The USD/JPY pair on the H2 timeframe presents a Potential Buying Opportunity due to a recent Formation of a Channel Breakout Pattern. This suggests a shift in momentum towards the upside and a higher likelihood of further advances in the coming hours.
Possible Long Trade:
Entry: Consider Entering A Long Position around Trendline Of The Pattern.
Target Levels:
1st Resistance – 153.90
2nd Resistance – 155.60
🎁 Please hit the like button and
🎁 Leave a comment to support for My Post !
Your likes and comments are incredibly motivating and will encourage me to share more analysis with you.
Best Regards, KABHI_TA_TRADING
Thank you.
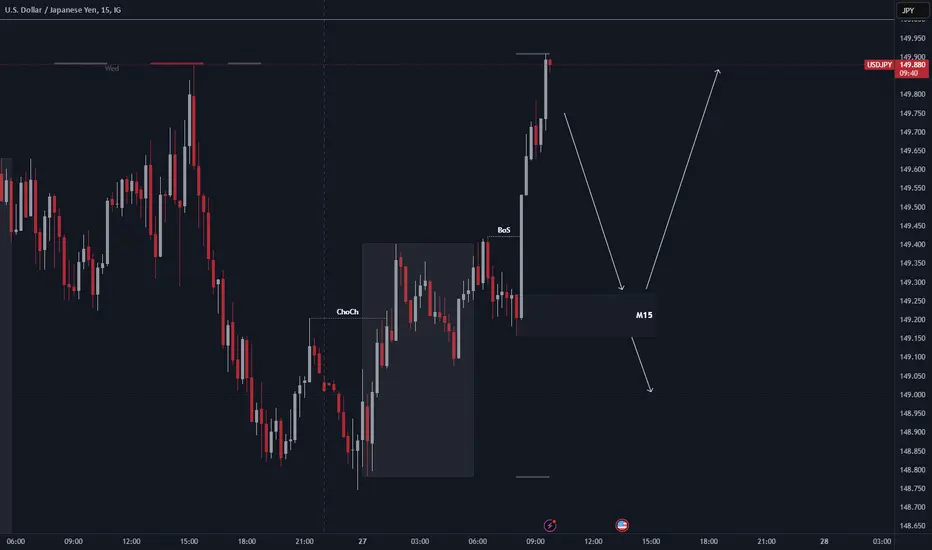
USD/JPY Market Analysis – Potential Reversal or Continuation?This 15-minute chart of USD/JPY displays a clear bullish impulse following a Change of Character (ChoCh) and a Break of Structure (BoS) . Price action has reached a key resistance zone, and traders are now anticipating the next move based on market reactions.
Key Observations :
1. Change of Character (ChoCh) :
- This indicates a shift from bearish to bullish sentiment.
- The market rejected lower prices and started forming higher highs and higher lows.
2. b]Break of Structure (BoS) :
- This confirms bullish momentum as previous resistance levels are broken.
- A strong bullish move suggests demand is dominating.
3. Current Price Action :
- The price has approached a liquidity zone (previous high).
- Potential rejection at this level suggests profit-taking or a shift in order flow.
Possible Scenarios:
✅ Bullish Continuation :
- If price retraces into the M15 demand zone (marked on the chart) and finds support, a continuation to the upside is likely.
- A break above the current high could push price towards 149.950 or even 150.000.
❌ Bearish Reversal :
- If price aggressively rejects the current high and breaks the M15 demand zone , we could see a bearish move towards **149.100 - 148.900**.
- This would indicate a deeper correction or potential trend reversal.
Trading Plan:
- **Wait for confirmation at the M15 demand zone.**
- **Look for bullish price action signals for continuation trades.**
- **If demand fails, shift bias to bearish setups.**
📌 Conclusion :
USD/JPY is at a critical decision point. The next move will depend on whether buyers defend the demand zone or if sellers step in to drive price lower. Stay patient and react to market structure shifts accordingly. 🚀📉
#USDJPY 4HUSDJPY (4H Timeframe) Analysis
Market Structure:
The price is currently respecting a trendline support, indicating that buyers are maintaining control. Additionally, the presence of a buy engulfing area suggests strong bullish momentum, signaling a potential continuation of the uptrend.
Forecast:
A buy opportunity may arise if the price continues to hold above the trendline support, confirming bullish pressure.
Key Levels to Watch:
- Entry Zone: A buy position can be considered near the trendline support after confirmation of bullish price action.
- Risk Management:
- Stop Loss: Placed below the trendline support to manage risk.
- Take Profit: Target key resistance levels based on previous price action.
Market Sentiment:
The combination of trendline support and a buy engulfing area indicates strong buying interest. A confirmed bullish move from this level can provide better validation for a buy setup.

IS USDJPY HAVE BUY SIDE LEQUIDITY?USDJPY is Sweep Buy Side Lequidity now sell side Lequidity Rest In Upside Market Will Go And Hunt These Lequidities That I Mentioned In Chart Be Patience Be Discipline With Your Strategies Without Knowing Market Behaviors Not Put Your Harder Money.
This Is Analysis Not A Financial Advice DYOR.
UsdJpy buy bias The previous day was bullish, and we clear previous week low 148.919 and there's a break on H4
My point of interest is 149.068 let's watch what price would do maybe it'll get to my draw on Liquidity at 150.654
Kindly boost if you find this insightful 🫴
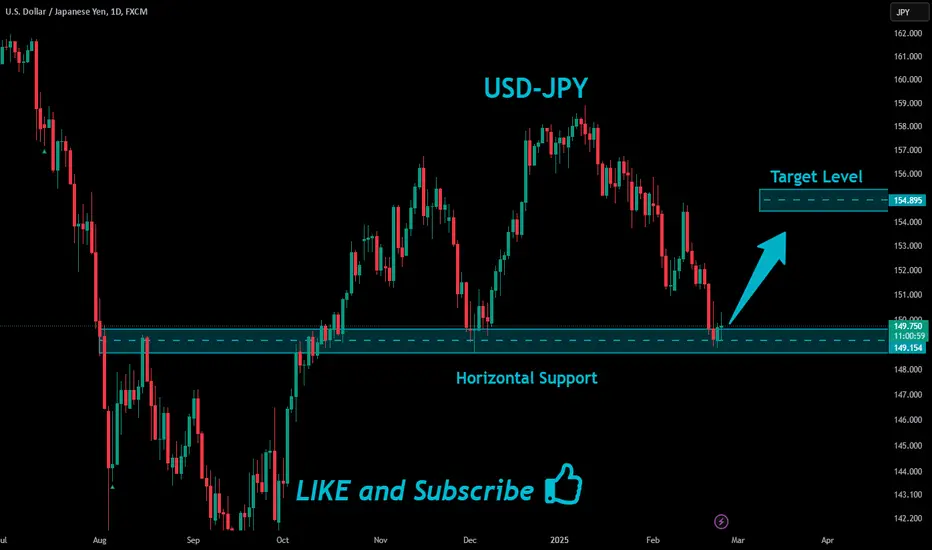
USDJPY Will Grow!
HI,Traders !
USD-JPY is already making
A local bullish rebound from
The horizontal support
Level of 149.154 so we are
Locally bullish biased and
We will be expecting a
Further move up !
Comment and subscribe to help us grow !
USDJPY Signal - 5 months support test 24.2.25148.60 to 152.70 range
Currently trading at 149.70
Support of 148.60-149.80 range is holding strong for the past 5 months.
Standard correction 300 pips up towards 152.70 makes sense following the expanding wedge pattern highlighted on the chart.
100 pip downside compared to 300 pip upside swing trade.
Make logical, timed, calculated action sticking to a plan and managing risk as top priorities.
GOOD LUCK!

USDJPY: remains below 150.00Furthermore, any significant retracement could find immediate support near the 149.50 level, which is followed closely by the 149.00 round number. A break below the latter might expose the USD/JPY pair to a retest of the 148.50 region, a level seen as the next strong support. Sustained weakness below this area could pave the way for a deeper corrective decline, with the next target around the 148.00 level. Traders will likely keep a close eye on these levels, as they could provide fresh directional impetus for the pair.

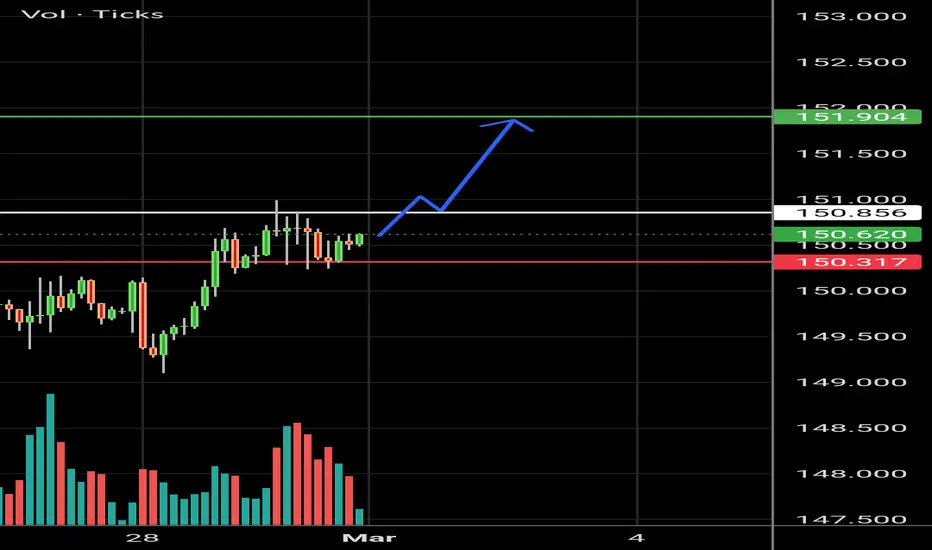
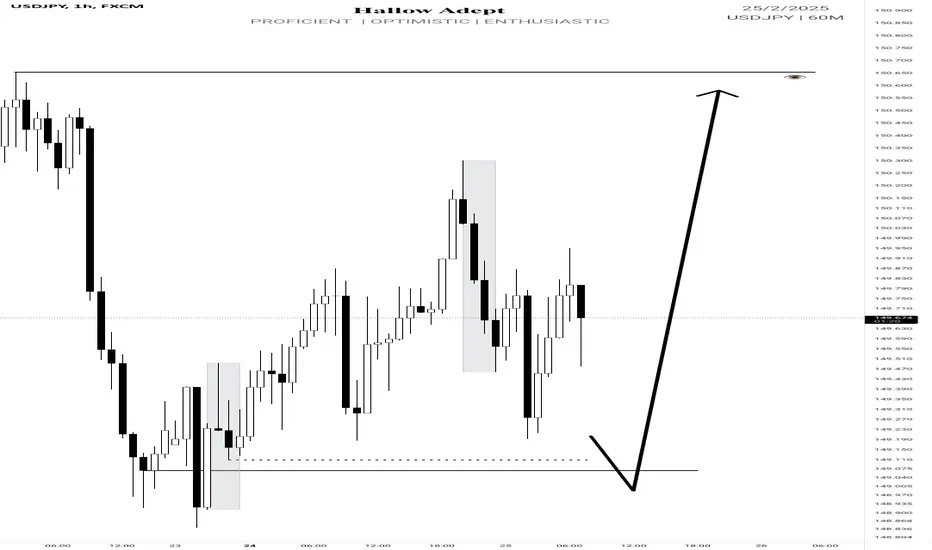
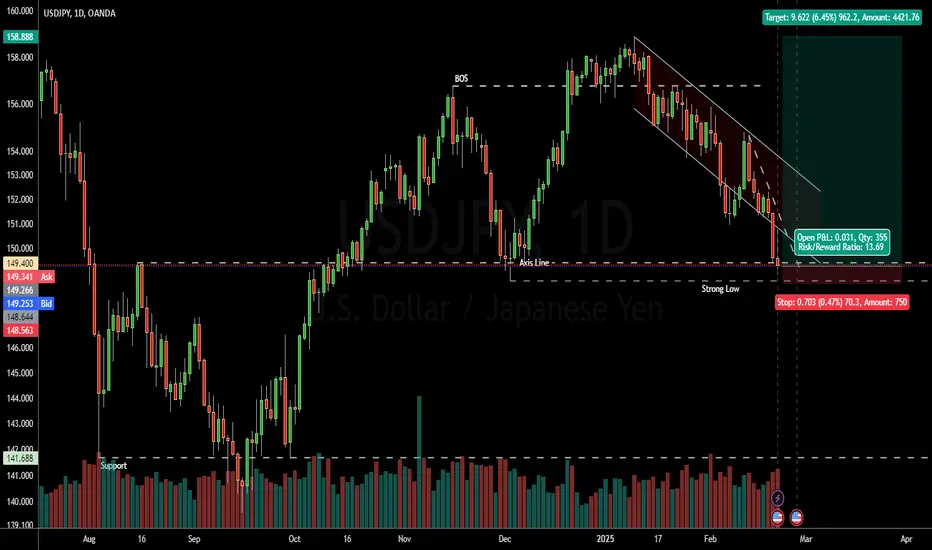
USDJPY Week of 23 Feb 25: Bullish
Trend Channel to steep down trend
Possible Reversal at axis line
Rising volume hints on absorption
Plan to go long on 24
Target Price to recent high
Stop Loss near below axis line
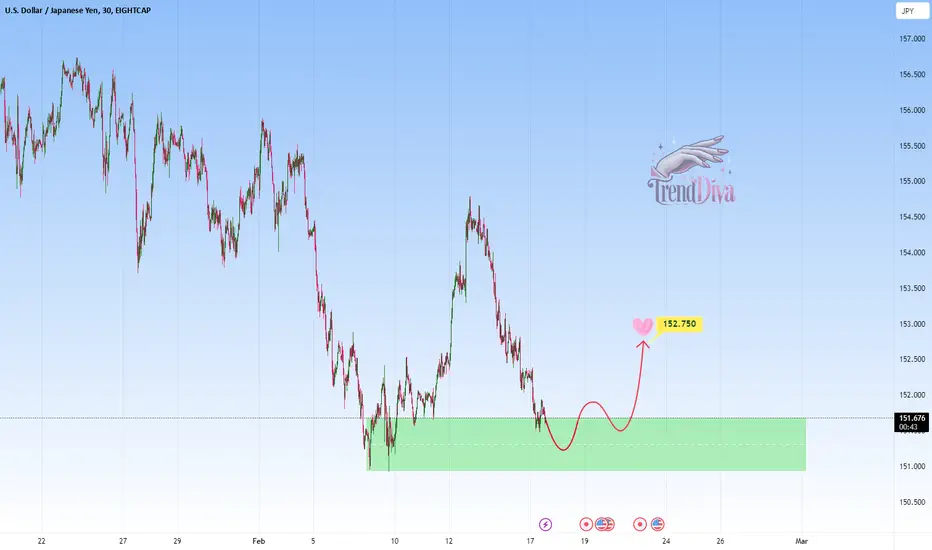
USDJPY at Key Support - Potential Buying OpportunityOANDA:USDJPY is inside a support zone, which has been a turning point for bullish move before. The recent bearish pressure brings the price into this area, creating a potential buying opportunity.
If bullish signals emerge, such as strong buying volume or bullish candlestick patterns, I expect the price to move toward 152,750. However, a break below this support would invalidate the bullish bias and could lead to further declines.
Just my take on support and resistance zones—not financial advice. Always confirm your setups and trade with solid risk management!
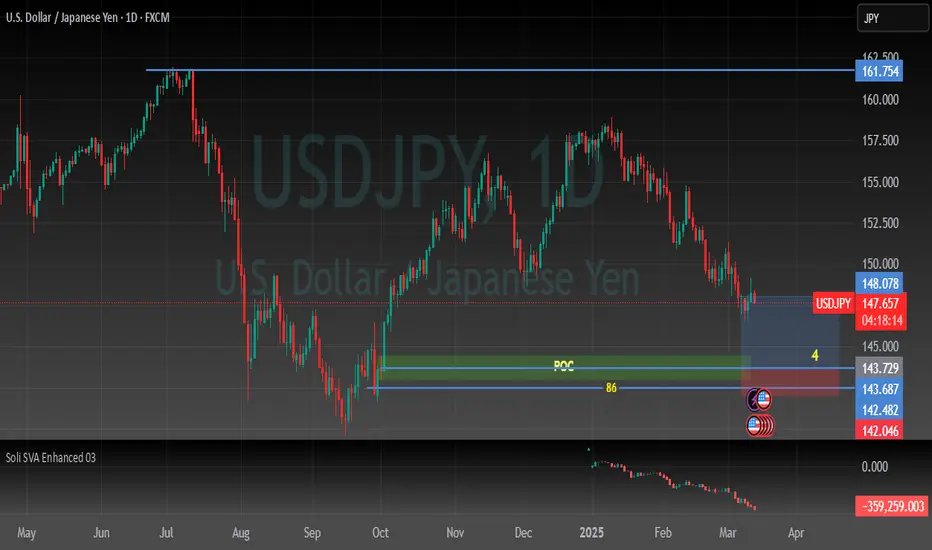
USDJPY BullishWith reference to
USDJPY is assumed bullish, and likely support near 149 level, and a re-attempt to go to 161.

USDJPYWe have a bullish trend and as we see the price show a strong demand zone with strong movement now if the price come back to the zone and show as a confirmation we take it long to the next supply zone
LR