usdjpy shortthere is a possible short position in usdjpy
if price make a new low, below the last recent low we can go for it...
for this move we can consider selected zone as TP
Usdjpyshort

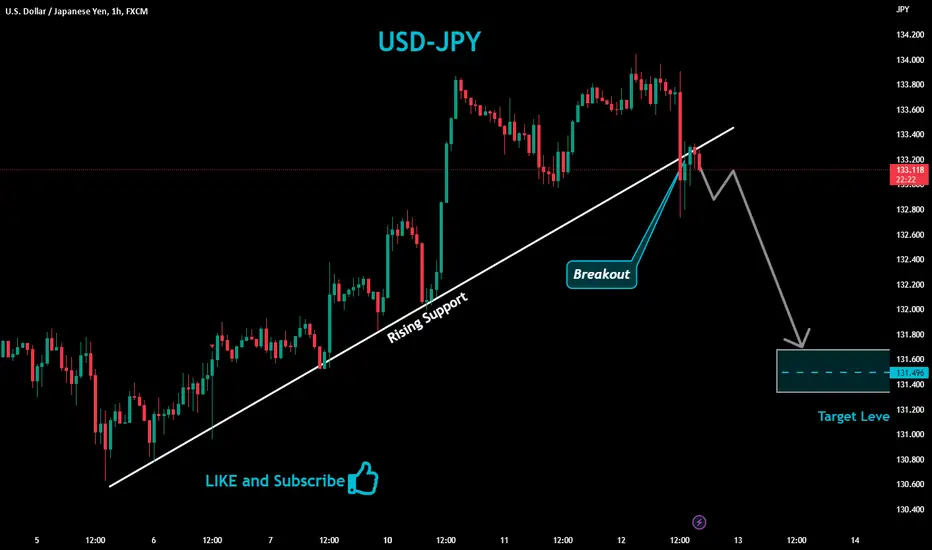
USDJPY Bearish Breakout!USD-JPY is trading in a local
Downtrend and the pair
Broke the rising support
Made a pullback and retest
And is going down again
So I am bearish biased
And I think that we will
See a further move down
usdjpy BUYWelcome. According to my analysis of the USDJPY pair, there is a high possibility of a bullish move. With a rising flag. The market is now trying to break the strong resistance at 133.500. good luck for everbody.Note: If you like this analysis, please give your opinion on it. in the comments. I will be happy to share ideas. Like and click to get free content. Thank you

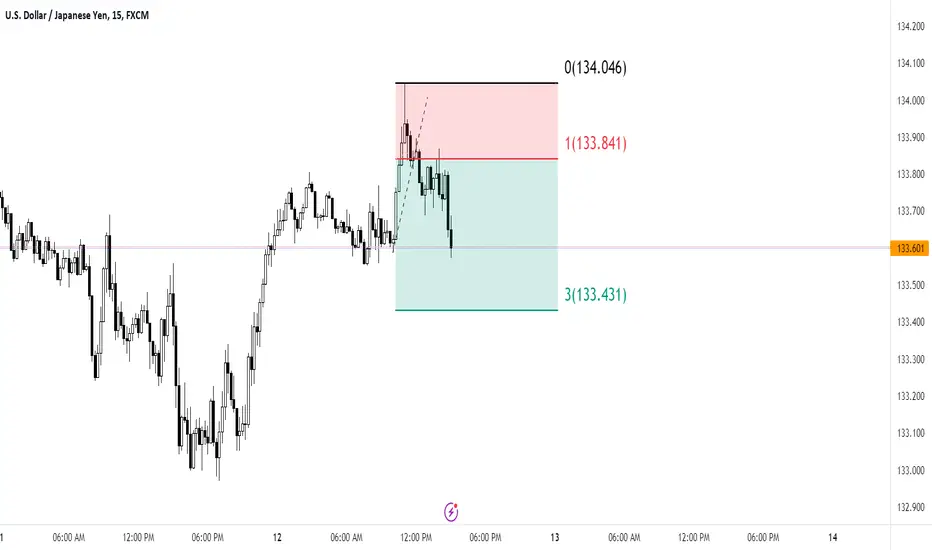
Intraday Sell usdjpy (12 MAR 2023)USDJPY intraday trading alert
3 simple steps to find a quality setup!
Risk Reward Ratio 1:2
Anyone same idea with me?
SELL USDJPY
Good luck traders...
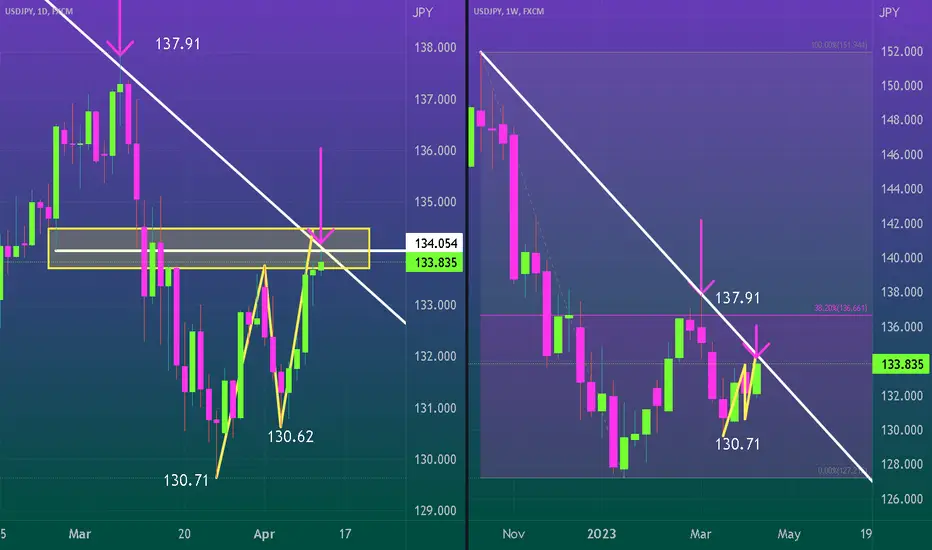
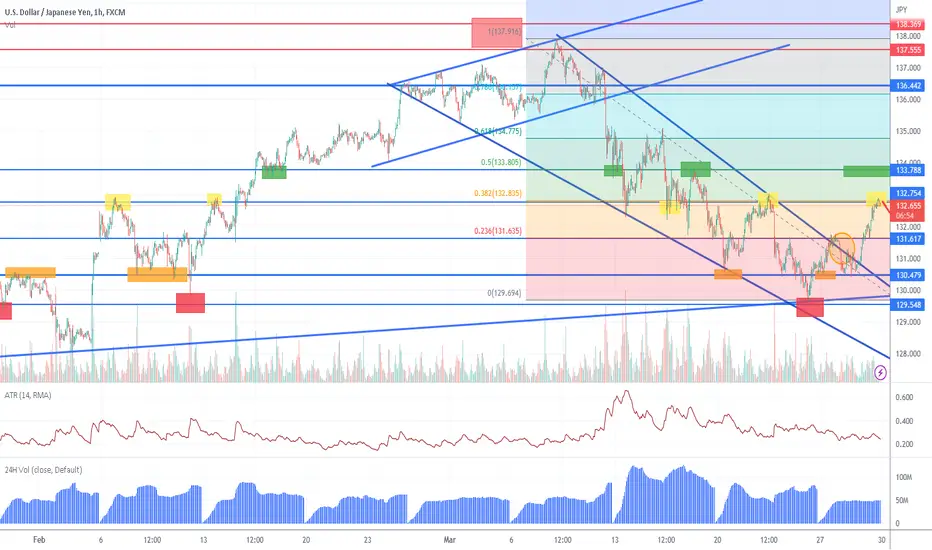
STRONG BEARISH WAVE COULD BE COMING✅WHERE WE ARE
We've been having the bearish wave since 137.91.
If the corrective bullish wave from 130.62 is over, we could see the strong bearish wave
PLEASE DO NOT FORGET TO SMASH LIKE👍🏻 AND FOLLOW ME❤ IT MOTIVATES ME TO THE NEXT IDEA! THANK YOU 🎉
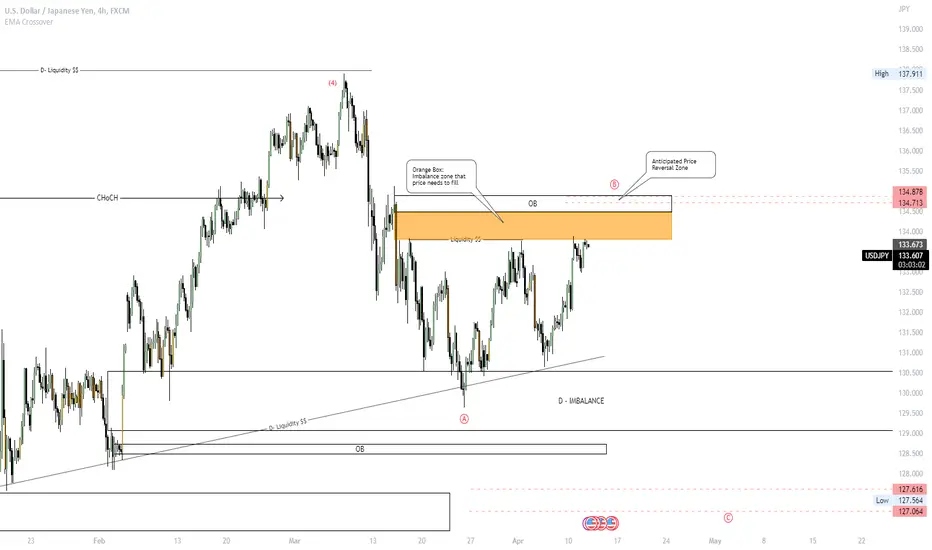
USDJPY Bull near exhaustion?So far, price has stayed above the 21 EMA which makes me bullish biased still but I am anticipating a reversal at 134.71 - 134.87 region, I will suggest waiting for confirmation.
I would love to hear your thoughts 🤔, feel free to leave a comment ✍. Please like 👍❤ this idea 💡 if you agree, and follow me for more updates ❕❕❕
USDJPY - Upside for an imbalance ✅Hello traders!
‼️ This is my perspective on USDJPY.
Technical analysis: As I expected in my previous post price filled the imbalance and rejected from bullish order block. Here I am still bullish and expect now price to create a new BOS and to fill the imbalance higher.
Fundamental analysis: Tomorrow we have news events on USD, will be released monthly and yearly CPI followed by a FOMC Meeting the same day. As well, on Thursday will be released monthly PPI in USA. Keep attention on the results in order to validate the bias.
Like, comment and subscribe to be in touch with my content!

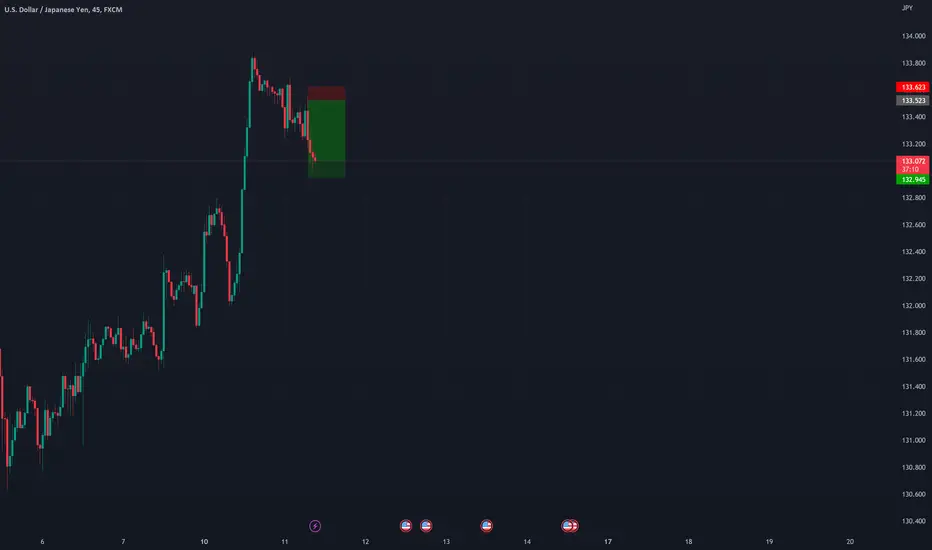
UsdJPY Short IdeaI'm already short usdjpy at 133.55
Forgot to post this earlier.
I still expect further bearish moves down.
My 2 cents

USD/JPY SHORT TRADE UPDATEHey Guys!
Last night I was stopped out on the short trade from last week. In this post I explain why I didn't abort this short entry, what I learned from this loss, as well as how I view this Weekly bias at this point.
That's it!
I'll keep you guys updated!
Have a great day!
Ken

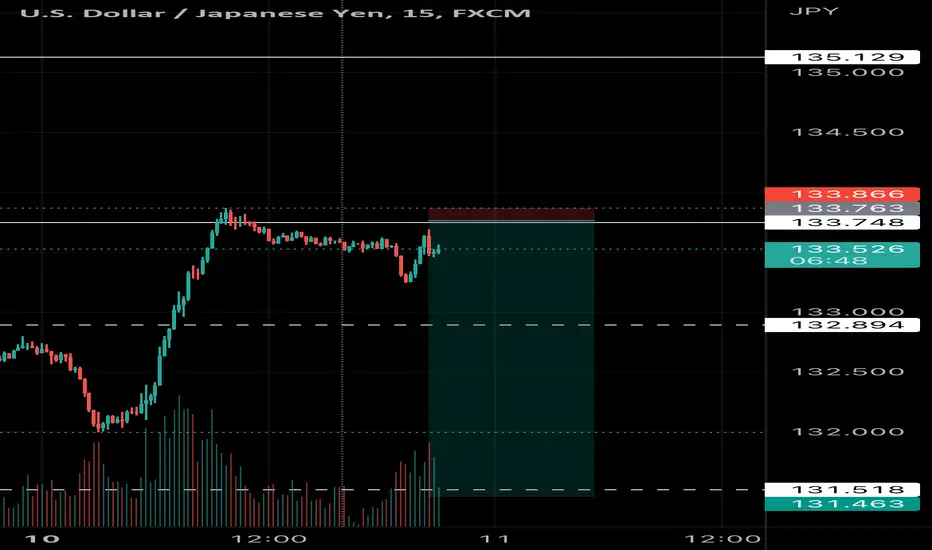
USDJPY ShortAfter forming yesterdays highs with strength, UJ has shown some selling pressure. Ideally I’d like to see a sweep of todays high in Europes session into continued selling. This trade will likely run through the end of the week.
USDJPY BEAR SWING RESUMEEOur USDJPY bear swing paused about 300 pips ago and created a temporary bottom from which we took short term buys from
After a nice run of 200+ PIPS we are EXIT the shorts. Now USDJPY should resume its bear swing on the route to new lows. From a technical aspect this retracement has come up to retest the overall trend at the 38 Fib level. Normally I would be expecting a further correction, up to the 50 area but under these economic conditions I expect USDJPY to resume its bear trend at a much more aggresive rate than most trends. Right now the "Carry Trade" is about to work against the dollar, as outflows continue to pull USDJPY down. Make no mistake there is a LOOONG way for this pair to fall still.
We are emtering longs with stop losses above the recent "Lower high"
If for some reason the bullish momentum were to resume, I would still be looking to SELL USDJPY around the 50 fib or 134 area.
Theres not much to update on the fundamentals. The US economy is still heading towards recession faster than the FED RESERVE can control. Yen has a long way to go before it becomes "overvalued" in this environment currently. USDJPY sells will always be the safer option for the near term.
20 Reason for Buy USDJPY 🔆MULTI-TIME FRAME TOP-DOWN ANALYSIS OVERVIEW☀️
1:✨Eagle eye: a bullish trap and, after it, a solid inside candle
2:📆Monthly: confirm high and choch market making a deep corrective move now may make a further down base more significant trend
3:📅Weekly: choch and fresh high market going down, forming a low
📈 7-Dimension Analysis
🟢 Analysis Time Frame: Daily
Price Structure: The price structure is currently bullish, indicating a potential upward trend.
Pattern Candle Chart: The failed head and shoulder pattern, as well as the twizzer pattern, suggests that the market may be experiencing a shift towards the bullish side.
Volume: Although there is a significant amount of bearish volume in the market, the price is not able to make lower lows, indicating that the volume may be an execution sign of the end of the bearish move.
Momentum (UNCONVENTIONAL RSI): The RSI is currently between 60 and 40, suggesting a consolidation or sideways movement, with multiple supports at the 40 level.
Volatility Measure (Bollinger Bands): The market is exhibiting a classic W pattern, indicating a potential trend reversal.
Strength (ADX): The ADX is almost neutral, suggesting that the market is in a period of consolidation.
Sentiment (ROC): Using the rate of change, the USD is currently stronger than the JPY.
✔️ Entry Time Frame: H1
Entry TF Structure: The H1 structure is bullish, indicating a potential upward trend.
Entry Move: We need to wait for the end of the corrective move before entering the market.
Support Resistance Base: We need support of the OB current move.
FIB: Drawing a trendline from the upper side breakout is necessary.
☑️ Final Comments: Wait for the correction to end before entering the market.
💡Decision: Buy
🚀Entry: 131.856
✋Stop Loss: 131.490
🎯Take Profit: 133.686
😊Risk to Reward Ratio: 1:4.63
🕛 Expected Duration: 5 days

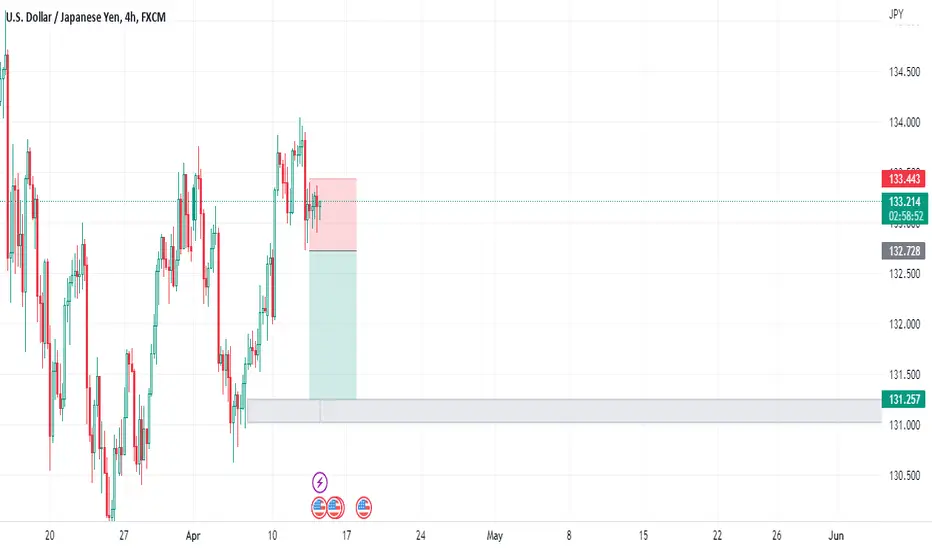
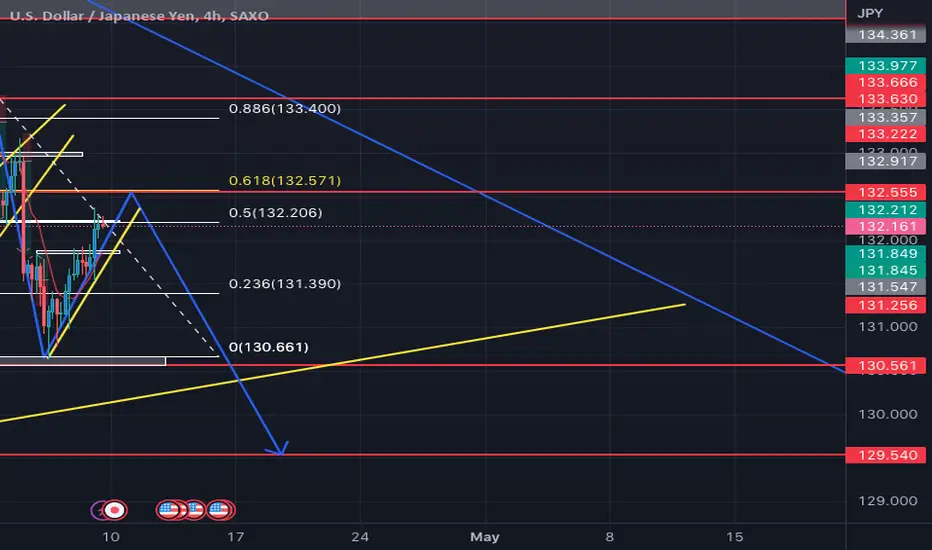
USDJPY Short 4hrGood afternoon,
I hope everybody had an amazing week and trading week and grew one percent in all areas. The market was very bearish for the first couple of days and then began its retracement going bullish around early Wednesday morning. Price fell from 133.600 to 130.600 before beginning the retracement to the upside.This week i'm predicting that UJ is still in a bearish market and is only currently in a corrective state. In this snapshot you can see that price has broken the uptrend trend line and is currently potentially moving up in correction. I am predicting that price is going to reject at the gold zone of .618 on my fibonacci continue the downtrend bearish market. I am looking for price to move up to 132.565 area and for price to reject. If price is rejecting and stays that way causing it to close below that zone once the four hour candle closes, I will be looking to take my entry. I am looking for price to drop to my next demand zone at price point 130.560. I believe price will drop lower, however the goal is to make trades that make sense where you'll have a higher chance of hitting TP. I'm open to all feedback and questions, please do not hesitate to comment and interact. If anyone agrees with my analysis or has a similar set up please like, share, and comment.
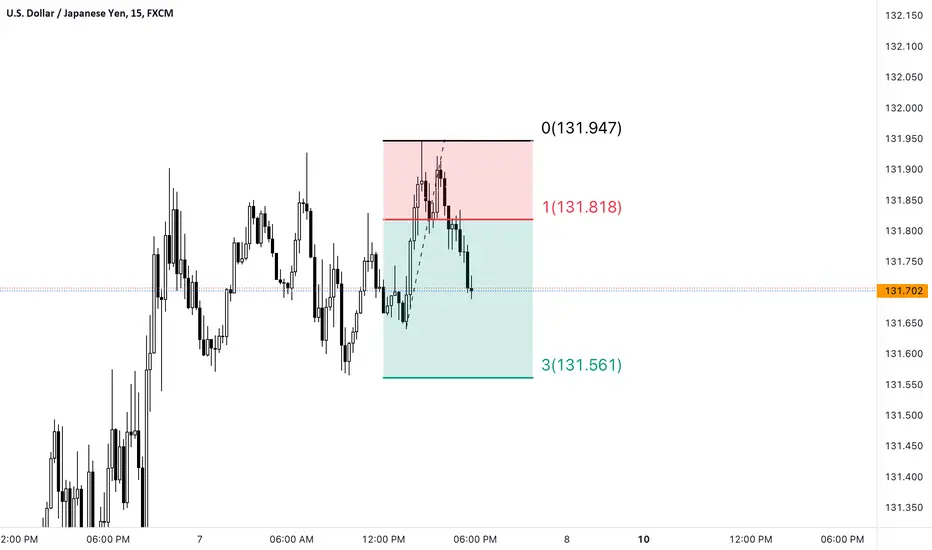
Intraday Sell usdjpy (07 MAR 2023)USDJPY intraday trading alert
3 simple steps to find a quality setup!
Risk Reward Ratio 1:2
Anyone same idea with me?
SELL USDJPY
Good luck traders...