USDJPY - CURRENT SENTIMENT , FUNDAMENTAL BIAS- Today is a fairly important day for USDJPY. This is due to the release of USD PCE DATA. So it's a very HIGH IMPACT NEWS. We need to be vigilant about that. Currently, the USPJPY is being hit hardest by the JPY. This is because some of the things that JAPAN issues are DATA and UPDATES are somewhat NEGATIVE.
- JPY FEATURE is currently on the rise. Somehow it will come back down. The main reason for this is that the MARKET SENTIMENT RISK OFF TONE is still playing. But JPY MARKET is now CORRECTION and we see the nature of it. JPY FEATURE is at 0.00762 LEVEL. According to the JPY ECONOMIC PROJECTION, JPY can be WEAK in the future as well. But if the MARKETS RISK continues to be ON, the USDJPY price may go up further. USDJPY stands above DYNAMIC LEVELS.
- Currently the OVERALL MARKET is RISK ON. Also the STOKES are turning a bit GREEN. COMMODITIES RISK ON TONE is what gives us. So I'm trying to be a bit HIGH BEATA CURRENCIES BUY right now. Anyway VIX is getting a bit DOWN right now. Also BONDS PRICES show a slightly NEUTRAL BIAS. But BONDS SPREADS are getting GREEN. MARKET currently has a MARKET ENVIRONMENT with a NEUTRAL BIAS close to RISK ON.
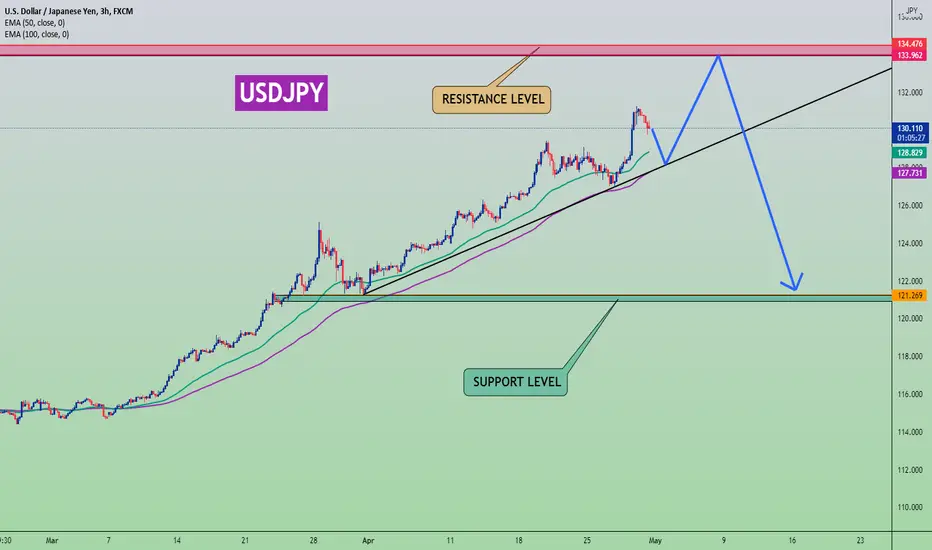
- USDJPY PRICE can be REJECT at 134.47 LEVEL. For VOLATILITY UP, and JPY FEATURE UP. USDJPY may change due to US PCE DATA due today.
- USDJPY PRICE can go to 134.47 LEVEL. Before that maybe a RETRACEMENT to 127.48 LEVEL can come up on the TREND LINE. However, if the TREND LINE is BREAK, the USDJPY price may fall to 121.269 LEVEL.
Usdjpytechnicalanalysis
USDJPY - CURRENT SENTIMENT , FUNDAMENTAL BIAS- UNEMPLOYMENT CLAIMS DATA is due to be released today for the US dollar. PHILLY FED MANUFACTURING INDEX DATA will also be released. And there's another important EVENT FED CHAIR POWELL SPEAK today. It will definitely be the strongest NEWS for USD. According to the MARKET SENTIMENT, a DEMAND can still come to USDJPY.
- JPY FEATURE is currently on the rise. The main reason for this is that the MARKET SENTIMENT is RISK OFF. But JPY MARKET is now CORRECTION and we see the nature of it. JPY FEATURE stands at 0.00782 LEVEL. According to the JPY ECONOMIC PROJECTION, JPY can be WEAK in the future as well. But if the MARKETS RISK continues to be ON, the USDJPY price may go up further. USDJPY stands above DYNAMIC LEVELS.
- Currently the OVERALL MARKET is RISK ON. Also the STOKES are turning a bit GREEN. COMMODITIES gives us a slightly MIXED RISK TONE. So I'm a bit reluctant to be a HIGH BEATA CURRENCIES BUY. Anyway VIX is getting a bit DOWN right now. Also BONDS PRICES show a slightly NEUTRAL BIAS. But BONDS SPREADS are getting GREEN. MARKET currently has a MARKET ENVIRONMENT with a NEUTRAL BIAS close to RISK ON.
- USDJPY PRICE can be REJECT from 131.86 LEVEL. For VOLATILITY UP, and JPY FEATURE UP. Due to the FEAD CHAIRMAN's SPEECH coming today, the impact on USD could be huge.
- Before the USDJPY PRICE goes to 131.868 LEVEL maybe a RETRACEMENT will come to 124.180 LEVEL. However, if the TREND LINE is BREAK, the USDJPY price may fall to 121.269 LEVEL.

USDJPY - FURTHER JPY WILL STRONG OR NOT ? WHAT'S GOING ON UJ?
⛔️ ISM MANUFACTURING PMI and US LABOR DATA are due to be released today for the US dollar. These are the most important ECONOMIC INDICATORS and these are the HIGH VOLATILIE INDICATORS. This data is very important for USDJPY today. Also, despite the high impact news for JPY being lost this week, the Japanese YEN is following the market sentiment.
⛔️ JPY FEATURE is currently on the rise. The main reason for this is that the MARKET SENTIMENT is becoming RISK OFF. JPY MARKET Now we see the nature of CORRECTION. JPY FEATURE stands at 0.0081 LEVEL. According to the JPY ECONOMIC PROJECTION, JPY can be WEAK in the future. But if the MARKETS RISK OFF continues, the USDJPY price may fall further. USDJPY stays on DYNAMIC LEVELS.
⛔️ Currently the OVERALL MARKET is RISK ON. Also the STOKES are turning a bit GREEN. VIX is getting a bit DOWN. Also COMMODITIES still shows a DOWN SIDE BIAS. Currently there is a NEUTRAL BIAS on the market side.
⛔️ USDJPY PRICE can be REJECT from 124.180 LEVEL. For VOLATILITY UP, and JPY FEATURE UP. The NFP DATA to be released today is very important and can have a huge impact on the USDJPY.
⛔️ Before the USDJPY PRICE goes to 118.388 LEVEL maybe a RETRACEMENT will come to 124.180 LEVEL. Then the USDJPY price can come down by breaking the TREND LINE. It is very important if the markets are to be RISK OFF.

USDJPY CONFIRM THE BEARISH MOVES (TECHNICAL ANALYSIS) USDJPY CONFIRM THE BEARISH MOVES
it was noted that the ninja pair had been waiting for a confirmation in regards to pushing the price of the market towards the April 22, lowest point.
However, It all a came out of the tight range momentum the market has been undergoing in the past few days, luckily during the London trading session on Wednesday the volatility of the pair has managed to escape out of the hand of weaker volatility and it regains strength which tends to be stronger than ever before.
On the flip side, before the confirmation of the bearish move, when looking at the 4hour time Frame market players will noticed that there is a build up forming below the mid of the tight range price action, hence this build up should serves as a confirmation or an area of value where entry point and stop loss should be marked with.
To be precise the price of USDJPY eyes a negative correction along the lines of the April 22 lowest price level which is recorded at 107.810.
To prevent yourself from suspicious brokers I choose WikiFx to research brokers:
USD/JPY multi time frame analysis, WILL BE UPDATED STAY TUNED !Will be Updated During the next days for possible trade opportunity Stay Tuned (BE SURE THAT FOLLOW ME TO GET NOTIFICATION)
If like this and if help you with your trading Please Like, Share, Follow and comment that give me motivation to make another Market analysis and trading ideas
If you have some suggestion, comment or other opinion feel free to write it in comment
Wish you succesfull and consistent trading with profits!
This is not an investment advice.
"CFDs are complex instruments and come with a high risk of losing money rapidly due to leverage. Between 74-89% of retail investor accounts lose money when trading CFDs. You should consider whether you understand how CFDs work and whether you can afford to take the high risk of losing your money."
USD/JPY- Weekly Analysis- 06-06-2021 - 06-11-2021 ✯✯✯✯✯✯✯✯✯✯✯✯✯✯✯✯✯✯✯✯✯✯✯✯✯✯✯✯✯✯✯✯✯✯✯✯✯✯✯✯✯✯✯✯✯✯✯✯✯✯✯✯✯✯✯✯✯✯✯✯✯✯✯✯✯✯✯✯
✯✯✯✯✯✯✯✯UJ- USD/JPY- Weekly Forex Trade Analysis- 06-06-2021 - 06-11-2021✯✯✯✯✯✯✯
✯✯✯✯✯✯✯✯✯✯✯✯✯✯✯Trade Idea Information And Market Analysis✯✯✯✯✯✯✯✯✯✯✯✯✯✯✯✯✯✯✯✯✯✯✯✯✯✯✯✯✯
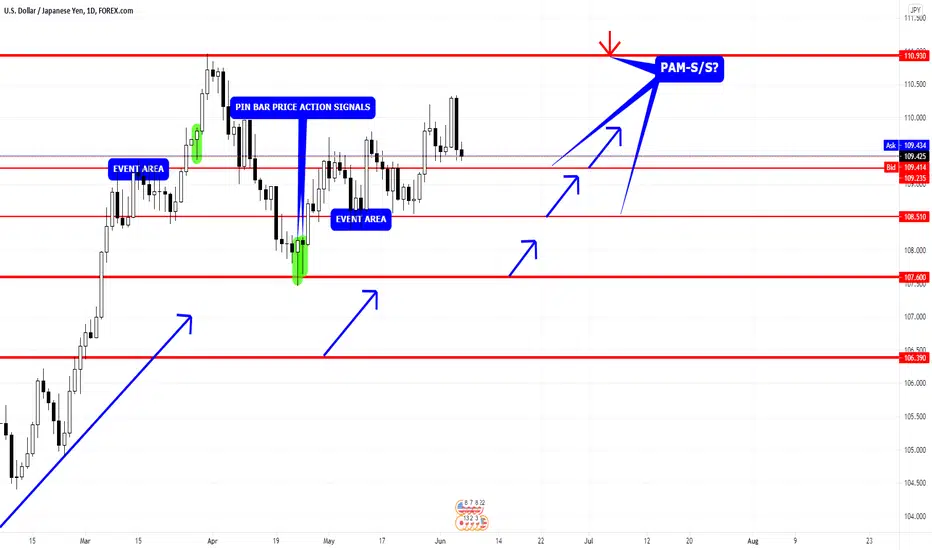
#1- Market Trend / Market Bias = Uptrend- The Market Trend Is Up
A. Blue Arrow Pointing Upwards... Signaling A Strong Uptrend
B. Blue Arrows Signaling Uptrend Continuation Moves From Support Levels
C. Red Arrow Signaling Downtrend / Counter-Trend Move From Resistance Level
✯✯✯✯✯✯✯✯✯✯✯✯✯✯✯✯✯✯✯✯✯✯✯✯✯✯✯✯✯✯✯✯✯✯✯✯✯✯✯✯✯✯✯✯✯✯✯✯✯✯✯✯✯✯✯✯✯✯✯✯✯✯✯✯✯✯✯✯
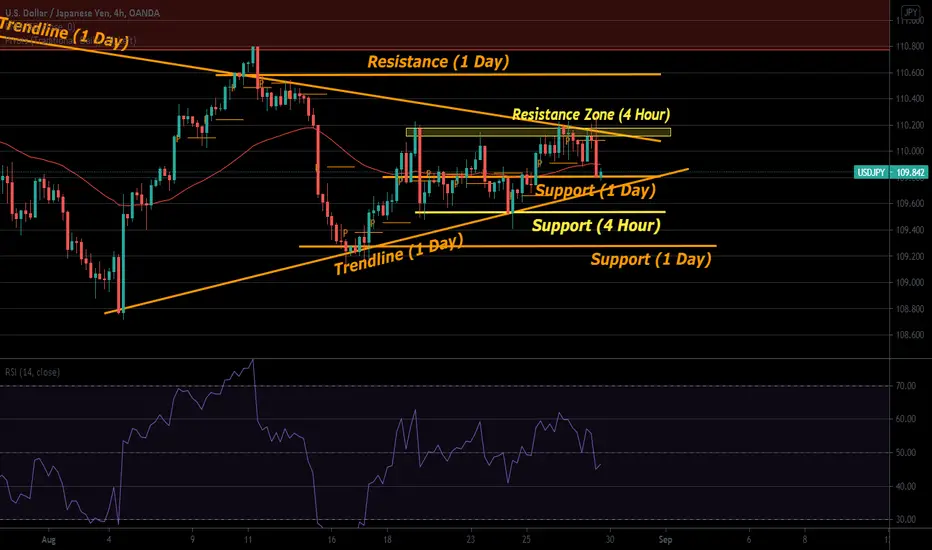
#2- Key Market Support And Resistance Levels
A. Weekly Support & Resistance Level At 110.930
B. Weekly Support & Resistance Level At 107.600
C. Weekly Support & Resistance Level At 106.390
D. Daily Support & Resistance Level At 109.435
E. Daily Support & Resistance Level At 108.510
✯✯✯✯✯✯✯✯✯✯✯✯✯✯✯✯✯✯✯✯✯✯✯✯✯✯✯✯✯✯✯✯✯✯✯✯✯✯✯✯✯✯✯✯✯✯✯✯✯✯✯✯✯✯✯✯✯✯✯✯✯✯✯✯✯✯✯✯
#3- Price Action Market Trading Signals / Setups
A.✯First Highlighted PAM Signal Was A PIN BAR
B.✯✯Second Highlighted PAM Signal Was A PIN BAR
C.✯✯✯Third Highlighted PAM Signal Was A PIN BAR
D.✯✯✯✯Future Potential HIGHLIGHTED PAM Signal/Setup???
✯✯✯Highlighted Pin Bar Buy Signal Formations All Signaling Uptrend Moves✯✯✯
✯✯✯Looking For The Potential Formation Of A PRICE ACTION BUY SIGNAL✯✯✯
✯✯✯✯✯✯✯✯✯✯✯✯✯✯✯✯✯✯✯✯✯✯✯✯✯✯✯✯✯✯✯✯✯✯✯✯✯✯✯✯✯✯✯✯✯✯✯✯✯✯✯✯✯✯✯✯✯✯✯✯✯✯✯✯✯✯✯✯
4. EVENT AREA Highlighted Area
A. Signaling A Strong Area / Level For A Potential Big Future Movement
✯✯✯✯✯✯✯✯✯✯✯✯✯✯✯✯✯✯✯✯✯✯✯✯✯✯✯✯✯✯✯✯✯✯✯✯✯✯✯✯✯✯✯✯✯✯✯✯✯✯✯✯✯✯✯✯✯✯✯✯✯✯✯✯✯✯✯✯

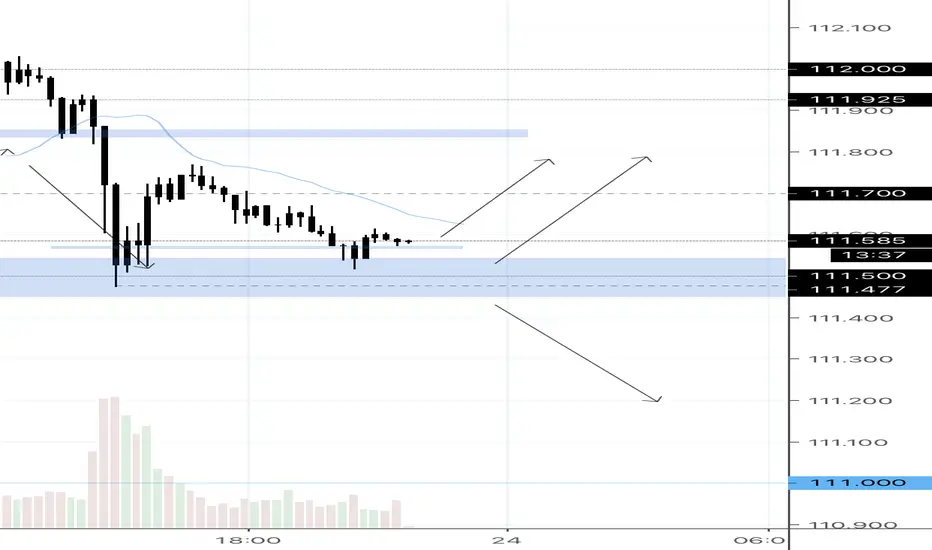
USDJPY update* (15min)in addition to recent USDJPY analysis..
like a spring
anticipate - react - execute
cheers.

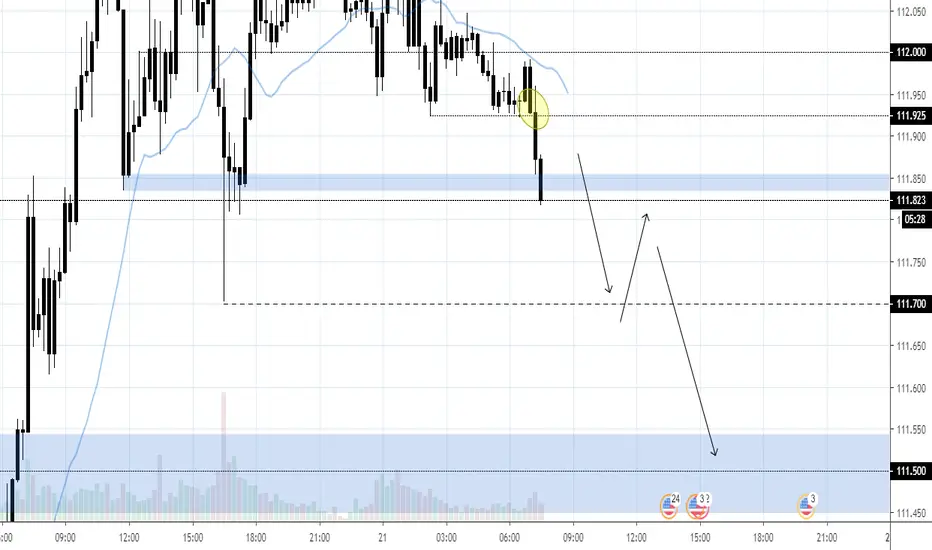
USDJPY update* (15min)in addition to recent USDJPY analysis..
more detailed look at price -recent closures for new lows - looking for continuation
anticipate - react - execute
cheers.
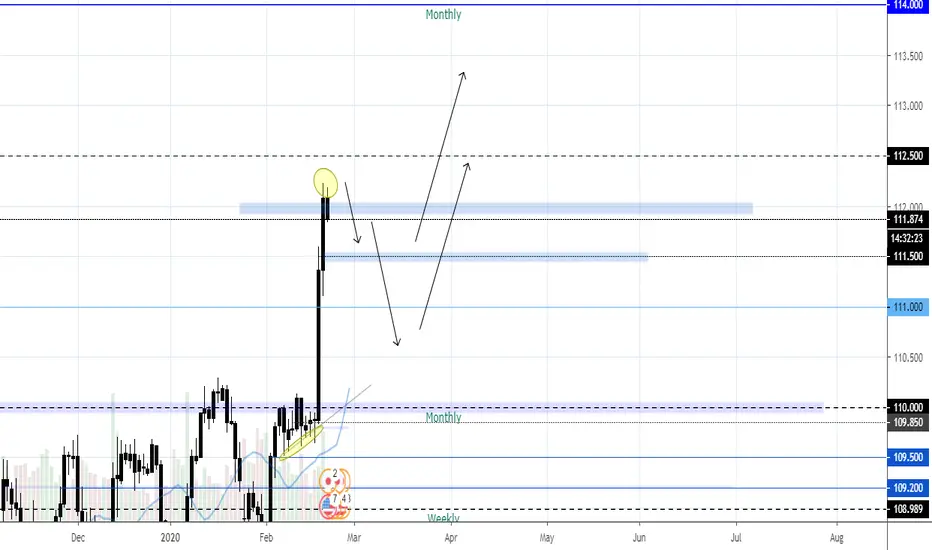
USDJPY update*in respects to recent USDJPY analysis..
after a big bullish push toward desired zones
sights on closure below current structure - playing the pullback
anticipate - react execute
cheers.
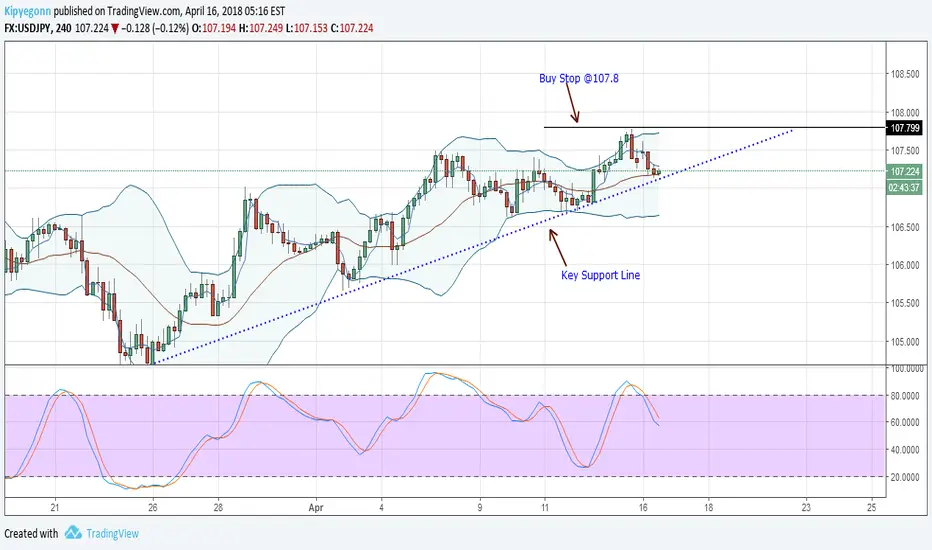
(Buy Stops) USDJPY Technical Analysis for April 16, 2018Hello Traders,
My focus pair today is USDJPY and while the Yen seems to be gaining ground as the chart shows, I expect prices to possibly rebound and edge higher in the coming days. These are my reasons. In the weekly chart, stochastics are turning from deep the oversold territory and we have that clear buy signals and higher highs which begun from late March 2018.
What’s interesting though is this minor resistance at last year’s lows and this is why I really think that this week’s price action could possibly shape the short to medium term trend of this pair. With this resistance, last year’s lows or support will effectively become a resistance zone if it succeeds in rebuffing further bull pressure.
When we zoom in to the 4HR chart, prices are retesting a key support line. Even though our technical indicators are mixed, we should practice patience and wait until there is a stochastic buy signal or a double bar reversal pattern prints at this level. On the flip side, conservative traders can wait for a close above last week’s highs at around 107.80 before initiating longs.
Because of this projection, my USDJPY trade plan would be as follows:
Buy Stop: 107.80
Stop Loss: 107
Take Profit: 112 but ideally at 115
Let me know what you think. Have a good trading day!!
First published at Forex.Today by Dalmas Ngetich