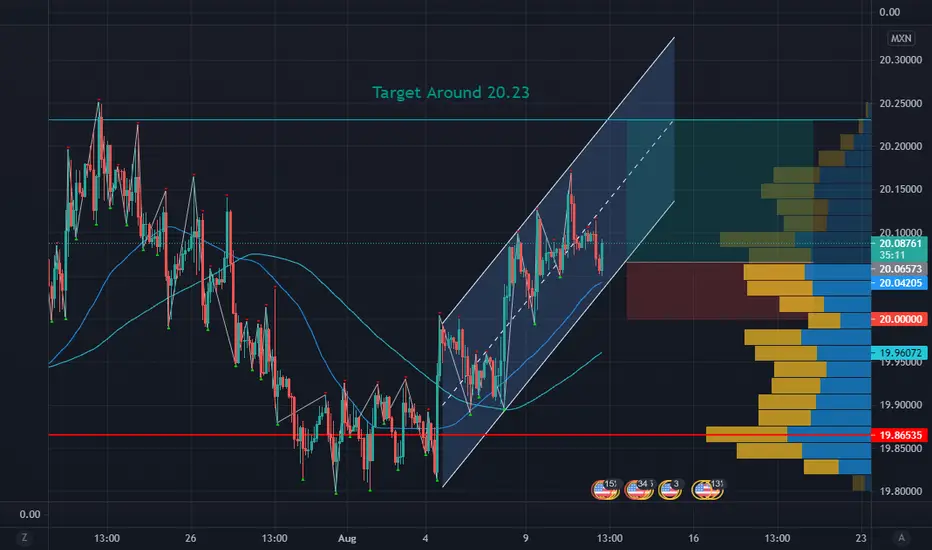
USDMXN Channelling Higher, Targeting 20.23Trend Analysis
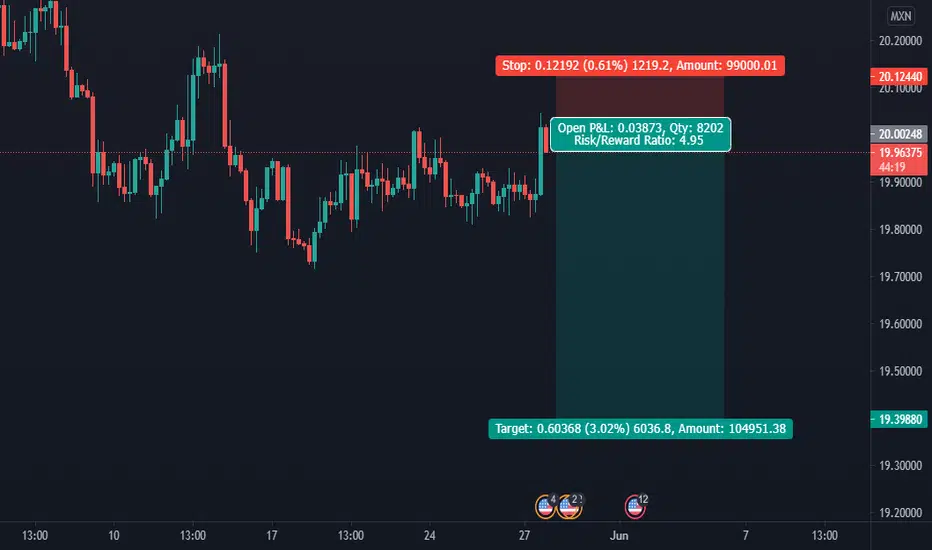
The main view of this trade idea is on the 2-Hour Chart. The FX Cross USDMXN is channeling higher and is currently and the lower end of the support channel around 20.05. Expectations are for support to hold and the FX Cross rally towards the upper end of the trend channel at around 20.23, 0.81% away. If this upward price movement breaks down, a stop loss should be set at around 20.
Technical Indicators
The short (25-MA) and medium (75-MA) fractal moving averages indicates a change in trend in USDMXN, supporting the short term bullish view. Currently USDMXN is trading above these respective moving averages and there has been a bullish crossover on them, with the short term fractal moving average crossing above the medium term fractal moving average.
Recommendation
The recommendation will be to go long at market. Stop loss will be set around the 20.00 price level and a target of 20.23. This produces a risk-reward ratio of 2.50.
Disclaimer
The views expressed are mine and do not represent the views of my employers and business partners. Persons acting on these recommendations are doing so at their own risk. These recommendations are not a solicitation to buy or to sell but are for purely discussion purposes. At the time publishing, I have a position in USDMXN .
USDMXN
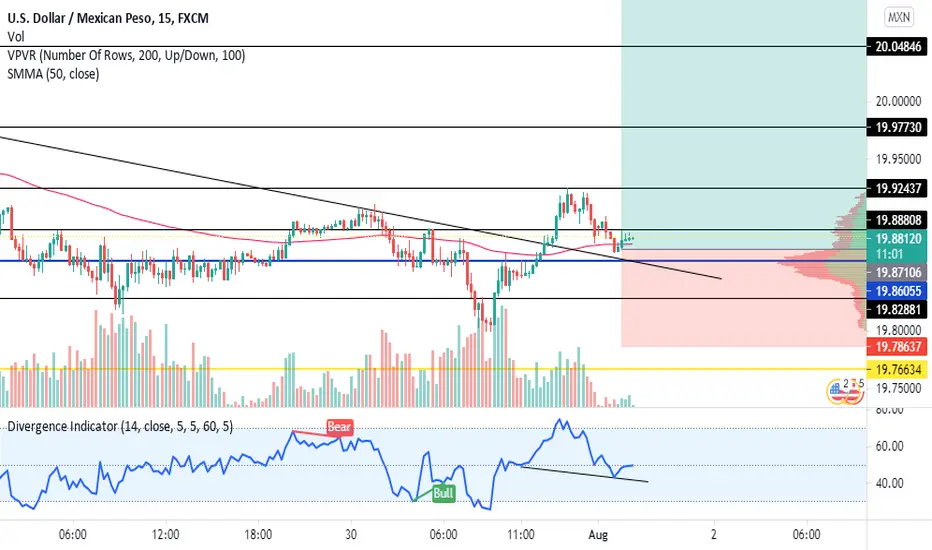
USDMXN position longuePossible retournement sur USDMXN, cassure de canal baissier + retest + bougie de confirmation + divergence rsi en 15 min. Possible impulsion en daily.
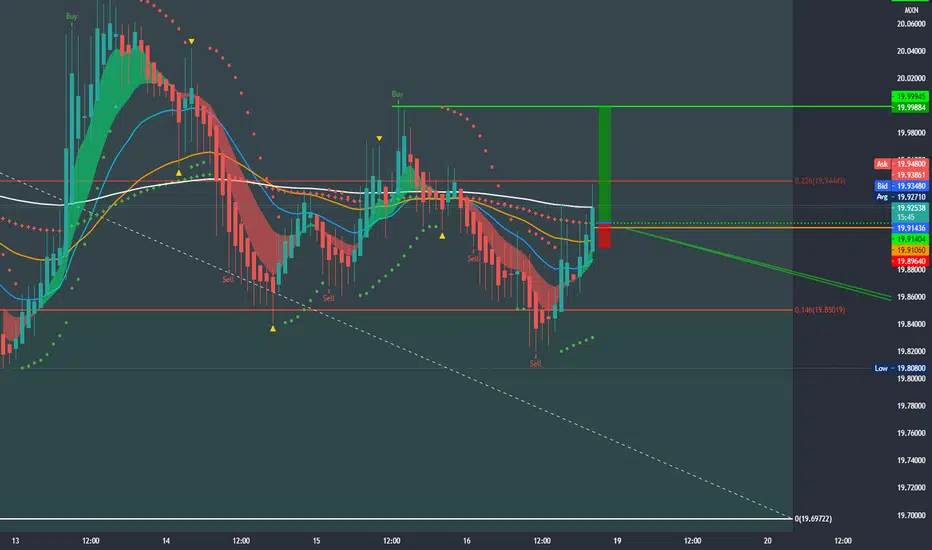
USDMXN Buy PositionMissed an earlier retest of this at the top of the hour 2000 ET 7/18/21, looking for a retest of the area for my Buy Limit to kick in. There are 3 TP areas I have of interest.
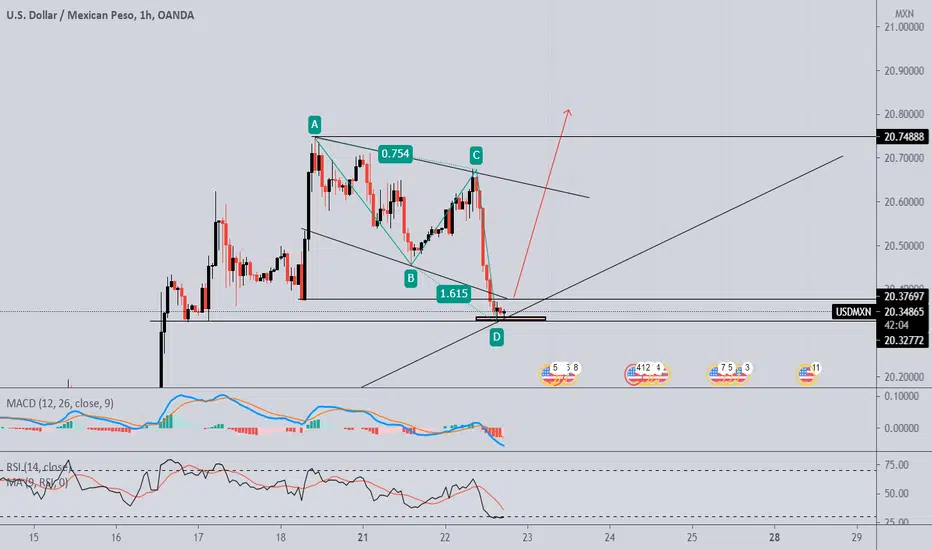
Elliott Wave Analysis: USDMXN Is Forming A Bearish TriangleHello traders!
We want to share a chart with interesting and known pattern called triangle on USDMXN currency pair.
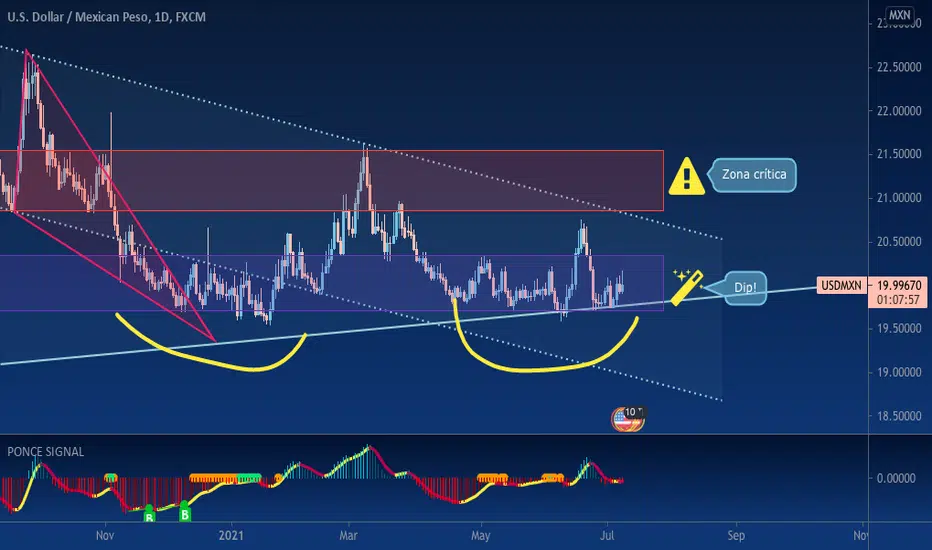
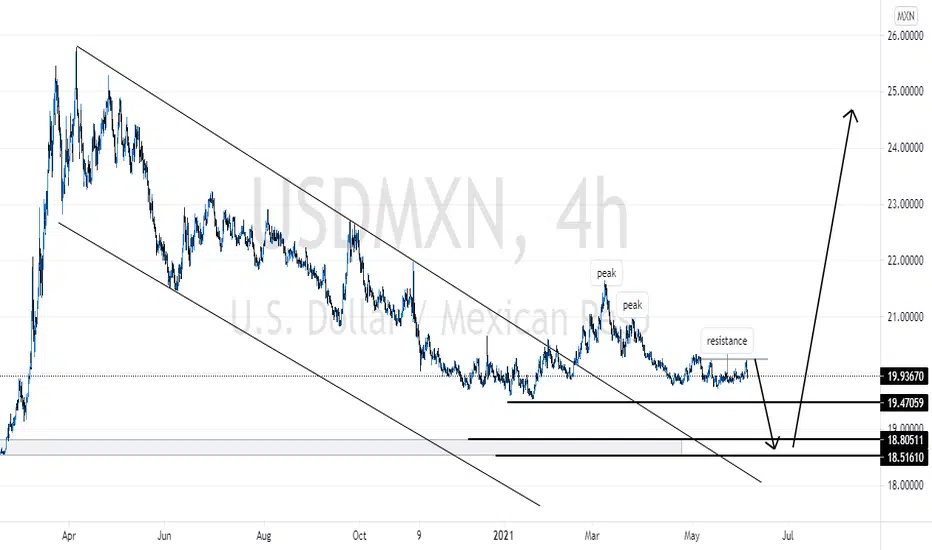
As you can see, USDMXN is trading sideways since the beginning of 2021. With slow price action and corrective sideways wave structure, we believe it's just a correction within downtrend, ideally a bearish triangle formation within a higher degree wave (IV) that can send the price even lower within wave (V).
Triangles are continuation patterns which consist of five waves A-B-C-D-E and seems like the final wave E can be now in progress, so watch out for a drop back to lows towards 18.x area soon.
It’s also worth to mention that three weeks back the central bank of Mexico (Banxico) hiked the benchmark interest rate by 25 basis points to 4.25%. This seems to be very bullish for MXN across the board and it may last until other banks will start increasing the rates as well. However, a lot of CB seem to be waiting on the FED first. Today, Powell will definitely talk about inflation, but recent retracement on some of the commodities, like Lumber, may give more time to the FED, so they can wait with aggressive taper- talk, possibly till September or maybe even end of the year. Under that situation dollar may face limited upside.
Be humble and trade smart!
If you like what we do, then please like and share our idea!
Disclosure: Please be informed that information we provide is NOT a trading recommendation or investment advice. All of our work is for educational purposes only.

usdmxn longhi pals ⚔🧨
If you are tired of losing money in this market
Just pull the trigger with us and enjoy 🏹🏹🏹
Risk/reward 1/10 minimum
win rate 80 and up
#trigger_price_action
#forex
#currency
#price_action
#hunter

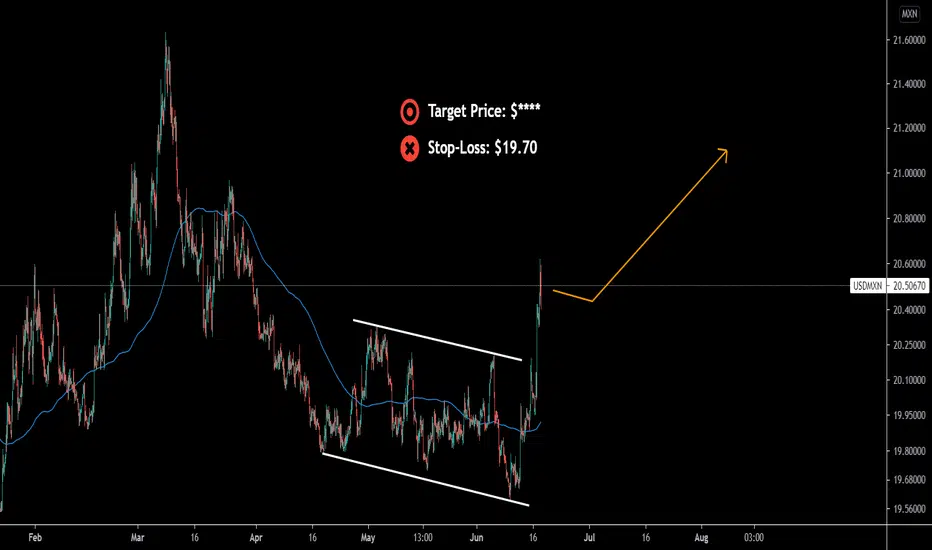
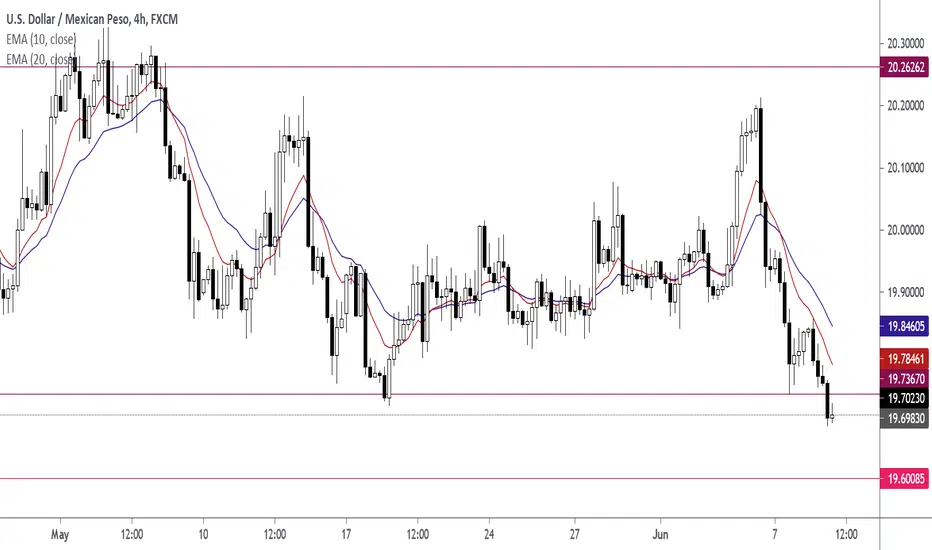
USDMXNRemains into range $19.70 - $20.30, same vision since last year
Short term sideways into range 📉 📈
Of course bullish long term 📈

USDMXN. Long I'm waiting for this pair to make a reversal near 19.80 to place an order to buy.
Right now, we can see a break of the trendline, so this could be the beginning of a new uptrend.

USDMXN. NeutralUSDMXN has been in a downtrend since 06/18. This pair must break the trendline and form a pattern to change direction and go upside.
If the trendline is not broken, we can see more movement to the downside.

USDMXN, just buy itIt is operating in a support zone after the peak it reached last week. I see another probable bounce.

USDMXN. Long We have a correction in the price, we can see that this is the second part of the Elliot Wave.
I think we can see an uptrend in the following weeks, this to get a third wave and eventually finish our Elliot Wave Movement.

Long USDMXN. USDMXN is in an uptrend, and I think we can see this pair go further than 21.00 MXN.
-It has already finished a channel pattern, and this is an absolute buy trade.
USDMXN. Long I'm waiting for this correction to finish to place an order to buy in USDMXN.
I think we can see USDMXN near 21.4 - 21.5.
-We have a channel pattern and a correction to the downside, so I'm just waiting for this trend to change direction.

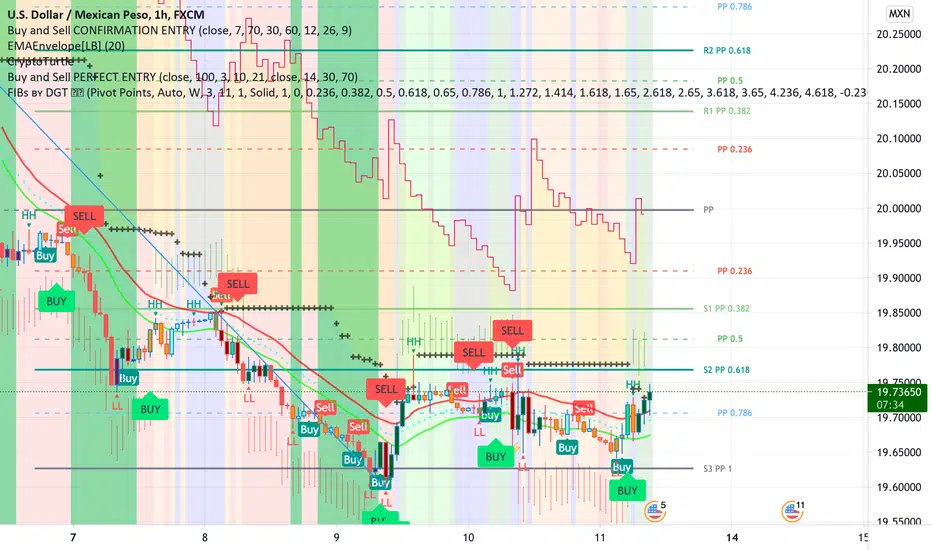
IS USDMXN READY FOR BREAKOUT ? #BLESSEDPIPS HELD GREAT SUPPORT AT THE 0.786 FIB RETRACEMENT , LETS SEE WHAT HAPPENS FROM HERE.
#BLESSEDPIPS
USDMXN on a spicy level 🦐USDMXN is currently testing a weekly support.
The price is trading above an ascending trendline with some retracement to the upside for a test of the 0.5 and 0.382 Fibonacci level.
According to Plancton's strategy if the price will break below the structure we will set a nice short order.
–––––
Follow the Shrimp 🦐
Keep in mind.
🟣 Purple structure -> Monthly structure.
🔴 Red structure -> Weekly structure.
🔵 Blue structure -> Daily structure.
🟡 Yellow structure -> 4h structure.
⚫️ Black structure -> >4h structure.
Here is the Plancton0618 technical analysis , please comment below if you have any question.
The ENTRY in the market will be taken only if the condition of the Plancton0618 strategy will trigger.

USDMXN top-down analysisHi Guys, this is the full breakdown of this pair. We will take this trade if all the conditions are satisfied as discussed in the analysis video. Smash the like button if you find value in this analysis and drop a comment if you have any questions or let me know which pair to cover my next analysis.
Also let me know your thought in the comment section what you think about this pair.

Peso down move to 18.80500 (USD/MXN)Very slow market on the weekly with over extended correction on lower time frames. Expecting price to drive down to 18.8000 range before any possible longs
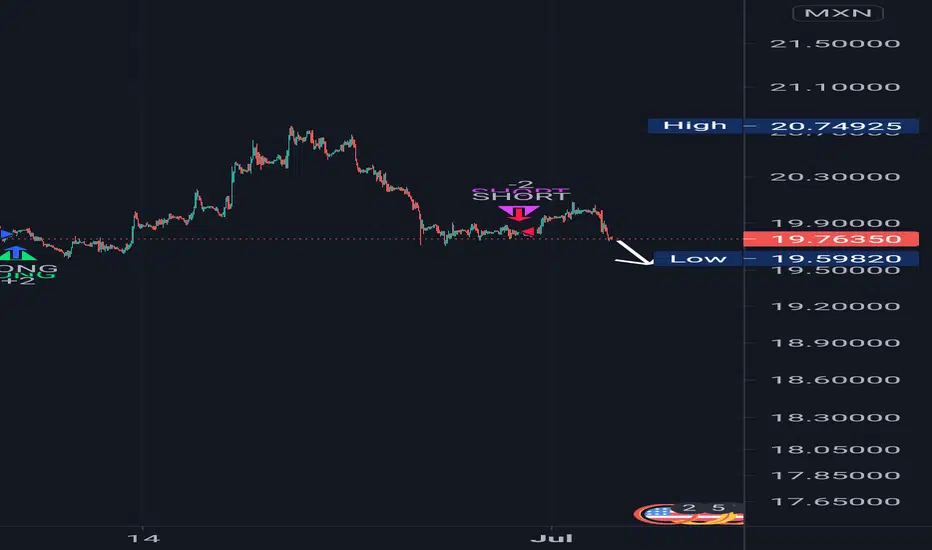
USDMXN | SHORT-Values-
Entry Range: 19.93293 - 19.97017
Average Entry: 19.95845 (RRR: 1.86)
Stop Loss: 20.00931
Profit Target: 19.86254
-HOW TO ENTER MY TRADES-
1. Ladder your entries.
You'll want to ladder place your orders exponentially within the Entry Range to the point your RRR is atleast 1.5 if fully filled.
2. Only first touches are valid.
If price is rebounding back into the entry zone after either the profit target or stop loss was hit the entry zone is no longer valid.
Example:
Trade Idea:
Valid and Invalid Entry:

USDMXN - SELL
Momentum trade : Full bearish in W and D1
Confirmation in H1
Keep an eye in the way it return to our demand zone
