DOLLAR INDEX (DXY): Bullish Reversal Confirmed?!
Dollar Index formed an inverted head and shoulders pattern on a daily.
Its neckline breakout is a strong bullish reversal signal.
The broken neckline of the pattern turns into a significant support now.
We can expect a growth from that at least to 101.25 resistance.
❤️Please, support my work with like, thank you!❤️
DJ FXCM Index

Heading into 61.8% Fibonacci resistance?US Dollar Index (DXY) is rising towards the pivot which is a pullback resistance and could reverse to the 1st support.
Pivot: 101.39
1st Support: 99.91
1st Resistance: 102.58
Risk Warning:
Trading Forex and CFDs carries a high level of risk to your capital and you should only trade with money you can afford to lose. Trading Forex and CFDs may not be suitable for all investors, so please ensure that you fully understand the risks involved and seek independent advice if necessary.
Disclaimer:
The above opinions given constitute general market commentary, and do not constitute the opinion or advice of IC Markets or any form of personal or investment advice.
Any opinions, news, research, analyses, prices, other information, or links to third-party sites contained on this website are provided on an "as-is" basis, are intended only to be informative, is not an advice nor a recommendation, nor research, or a record of our trading prices, or an offer of, or solicitation for a transaction in any financial instrument and thus should not be treated as such. The information provided does not involve any specific investment objectives, financial situation and needs of any specific person who may receive it. Please be aware, that past performance is not a reliable indicator of future performance and/or results. Past Performance or Forward-looking scenarios based upon the reasonable beliefs of the third-party provider are not a guarantee of future performance. Actual results may differ materially from those anticipated in forward-looking or past performance statements. IC Markets makes no representation or warranty and assumes no liability as to the accuracy or completeness of the information provided, nor any loss arising from any investment based on a recommendation, forecast or any information supplied by any third-party.

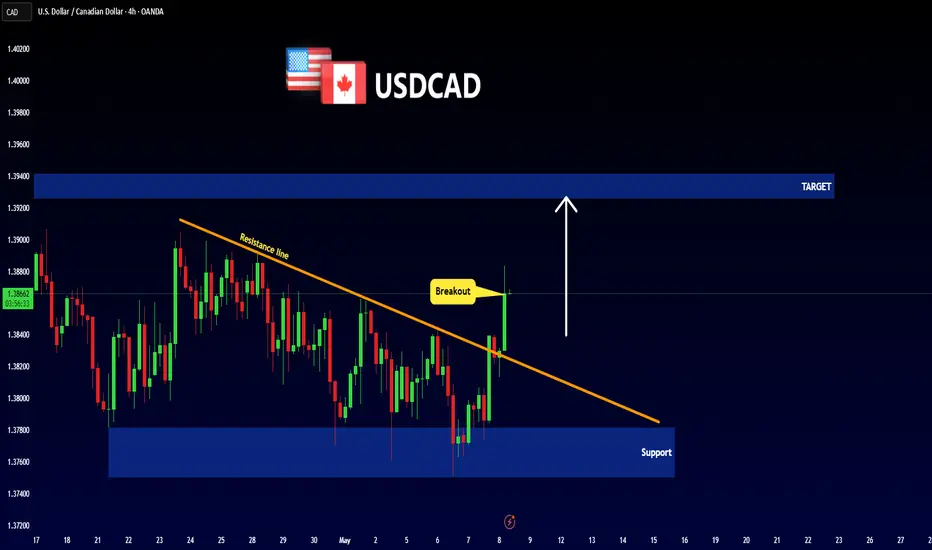
USDCAD - BULLISH MOVEHello Traders !
The USDCAD price formed a descending triangle.
Currently, The Resistance line is broken !
So, I expect a bullish move🚀
______________
TARGET: 1.39260🎯
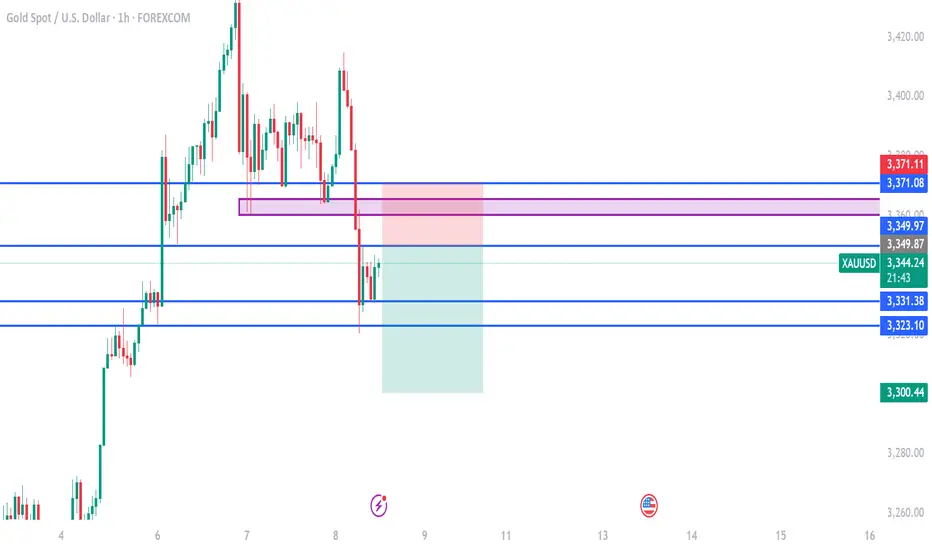
gold on bearish#XAUUSD on price correction, possible breakout at 3350 will take reverse on sell which can drop till 3300.
Now we await for this zone to sell, 3350,3362,3331 and 3323, but main price is at 3350 which holds strong decline on sell, Target 3300, stop loss 3371.
Above 3371 holds bullish which will take the price back 3400.
Weekly Forecasts UPDATES! ALL Markets Analyzed! Stocks & FOREXIn this Weekly Forecast UPDATE, we will analyze the S&P 500, NASDAQ, DOW JONES, Gold and Metals futures, and the FOREX Majors for Thursday, May 8th.
The targets set in last weekend's forecasts are still in play! Trade accordingly.
Enjoy!
May profits be upon you.
Leave any questions or comments in the comment section.
I appreciate any feedback from my viewers!
Like and/or subscribe if you want more accurate analysis.
Thank you so much!
Disclaimer:
I do not provide personal investment advice and I am not a qualified licensed investment advisor.
All information found here, including any ideas, opinions, views, predictions, forecasts, commentaries, suggestions, expressed or implied herein, are for informational, entertainment or educational purposes only and should not be construed as personal investment advice. While the information provided is believed to be accurate, it may include errors or inaccuracies.
I will not and cannot be held liable for any actions you take as a result of anything you read here.
Conduct your own due diligence, or consult a licensed financial advisor or broker before making any and all investment decisions. Any investments, trades, speculations, or decisions made on the basis of any information found on this channel, expressed or implied herein, are committed at your own risk, financial or otherwise.

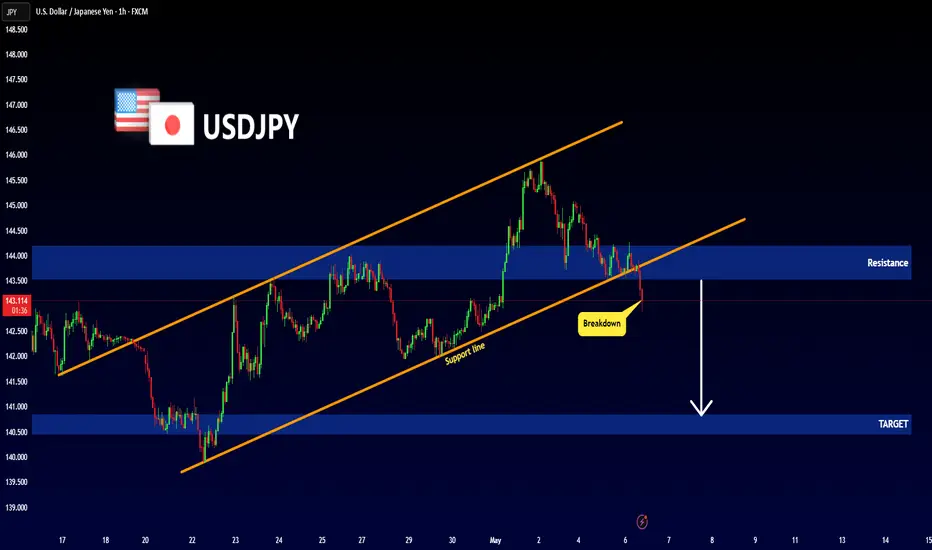
USDJPY - NEW BREAKDOWNHello Traders !
The USDJPY price formed an ascending channel.
Currently, The support line is broken!
So, I expect a bearish move📉
______________
TARGET: 140.850🎯
Fed pleases everyone, except for one. BoE is next on the watchThe Federal Reserve came out with its rate decision and it seems that all market participants got pleased, except for one.
Today it's the BoE's turn to deliver rates.
Let's dig in!
TVC:DJI
TVC:DXY
FX_IDC:GBPUSD
MARKETSCOM:100UK
Let us know what you think in the comments below.
Thank you.
77.3% of retail investor accounts lose money when trading CFDs with this provider. You should consider whether you understand how CFDs work and whether you can afford to take the high risk of losing your money. Past performance is not necessarily indicative of future results. The value of investments may fall as well as rise and the investor may not get back the amount initially invested. This content is not intended for nor applicable to residents of the UK. Cryptocurrency CFDs and spread bets are restricted in the UK for all retail clients.

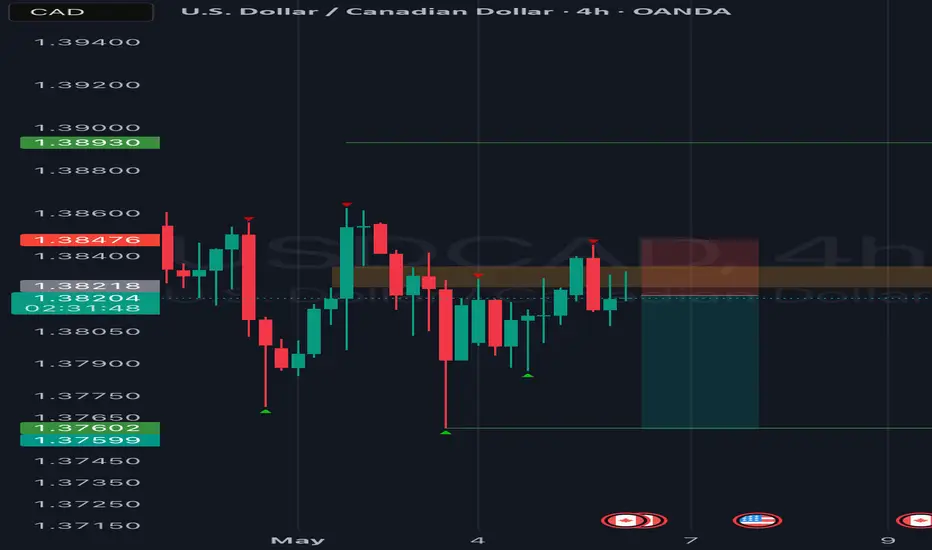
USD/CAD could decrease to C$1.35The US dollar has weakened recently against other major currencies including the euro, pound and yen. While it may not have grabbed the headlines, there’s another currency we can add to that list: the Canadian dollar.
The Canadian dollar – which was trading at around C$1.45 per US dollar at the end of January – may continue to strengthen against its southerly neighbour in the near term, potentially reaching C$1.35 per US dollar. Let’s examine why.
The area between C$1.38 and C$1.39 has previously served as a resistance zone for USD/CAD, marking significant tops in 2022, 2023 and 2024. Each time, this area ended the dollar’s gains and led to a renewed period of Canadian dollar strength. The pattern changed in October 2024, when – after multiple failed attempts to break through resistance – USD/CAD finally pushed to a new high of C$1.45. Now, as USD/CAD declines from that peak, the old resistance area of C$1.38 to C$1.39 is providing support.
If USD/CAD falls below support at C$1.38, it could decline towards C$1.347, partly because there are no meaningful levels of support to slow such a move. A falling bear flag pattern also seems to be forming, suggesting that a breakdown may be imminent, potentially supporting a drop to around C$1.35. Meanwhile, the completion of the diamond reversal top that formed from December 2024 to March 2025 could imply a return to the pattern’s origin near C$1.35.
The USD/CAD chart pattern also shows a high degree of symmetry between the left and right sides. In other words, the decline on the right side is occurring at a similar pace to the earlier rise on the left. Completing this symmetrical pattern might suggest a return to the starting point around C$1.35.
Of course, if support at C$1.38 holds and the Canadian dollar does not strengthen further, a swift rise for the US dollar back towards C$1.41 cannot be ruled out.
Written by Michael J. Kramer, founder of Mott Capital Management
Disclaimer: CMC Markets is an execution-only service provider. The material (whether or not it states any opinions) is for general information purposes only and does not take into account your personal circumstances or objectives. Nothing in this material is (or should be considered to be) financial, investment or other advice on which reliance should be placed.
No opinion given in the material constitutes a recommendation by CMC Markets or the author that any particular investment, security, transaction, or investment strategy is suitable for any specific person. The material has not been prepared in accordance with legal requirements designed to promote the independence of investment research. Although we are not specifically prevented from dealing before providing this material, we do not seek to take advantage of the material prior to its dissemination.
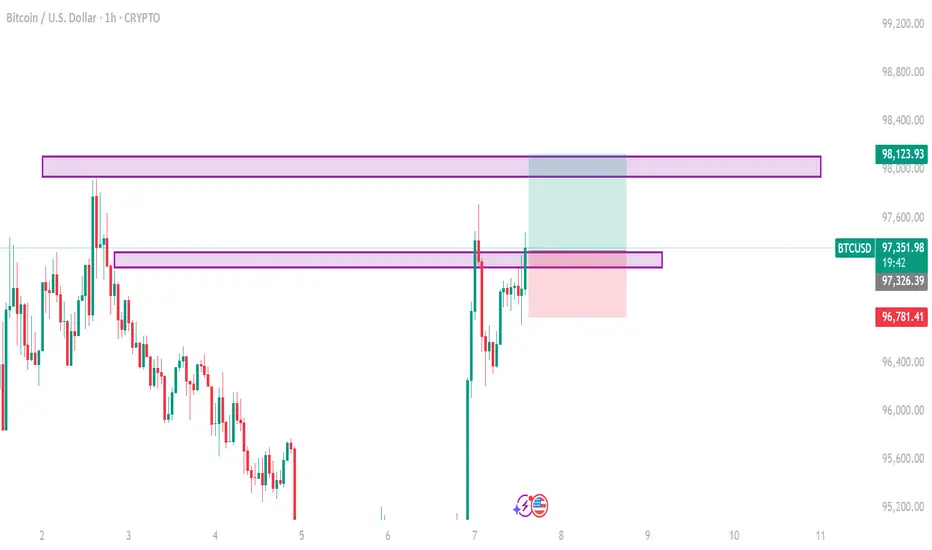
btc on bullish#BTCUSD now above the third pattern, price is expected to continue bullish from 98150.
Above and 2 times breakout at 97326 will take the price above 98150, stop loss 96781.
Above 98150 have bullish formation which will target 100k, any reverse below 96781 will retrace bullish back.
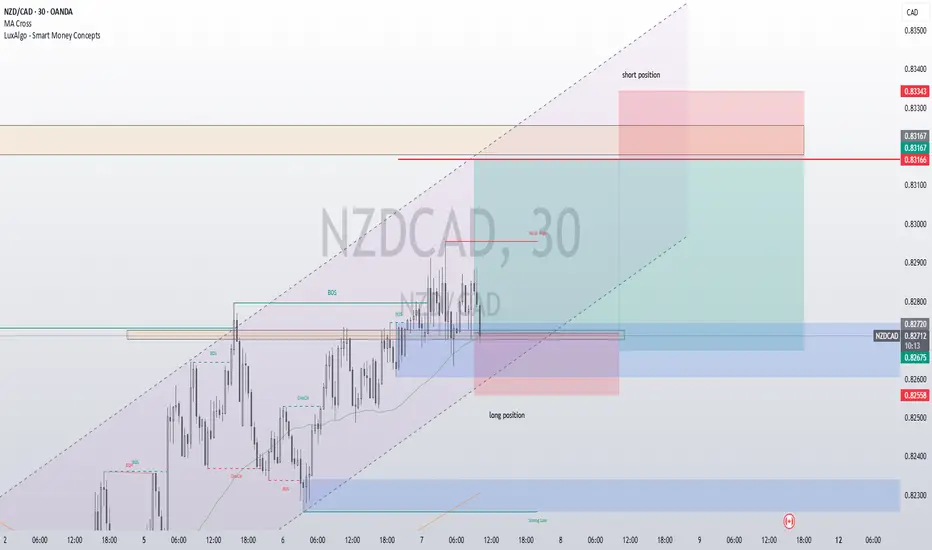
NZDCAD – Range Play, Resistance RetestNZDCAD – Consolidation Within Neutral Range as Market Eyes Fed Developments
The NZDCAD currency pair is currently exhibiting strength within the confines of a well-defined neutral trading range. This stabilization is largely underpinned by the recent corrective pullback in the U.S. dollar, which has provided short-term support for the New Zealand dollar. However, questions remain about the sustainability of this momentum, especially with significant macroeconomic events looming on the horizon — most notably, the Federal Open Market Committee (FOMC) meeting and the subsequent speech by Federal Reserve Chair Jerome Powell.
At present, NZDCAD is trading within a localized range, and price action is gravitating toward the key liquidity zone around the 0.8317 level. This area has become a focal point for market participants, as it represents a notable level of interest where prior price reactions have occurred. The pullback in the U.S. dollar has temporarily shifted sentiment in favor of the NZD, but this may prove short-lived depending on upcoming policy signals from the Federal Reserve.
From a technical standpoint, the currency pair is constrained between strong resistance at 0.83175 and a cluster of support levels located at 0.82644, 0.8235, and 0.8225. The proximity of these levels reinforces the neutral bias and increases the likelihood of short-term whipsaws or potential false breakouts. Traders should exercise caution in positioning aggressively within this zone, particularly ahead of fundamental catalysts that could swiftly reshape market dynamics.
Market sentiment is increasingly focused on the tone and direction of Fed policy. Should the FOMC or Chair Powell deliver signals that point toward a more hawkish policy trajectory — whether through immediate action or forward guidance — the U.S. dollar could regain strength rapidly. This would likely exert downward pressure on NZDCAD, potentially driving the pair back toward the lower bounds of its trading range or beyond.
Conversely, any dovish surprises or indications of policy patience could extend the current reprieve for the NZD, enabling a continued challenge of the upper resistance area. However, given prevailing expectations for a firm stance by the Fed amid ongoing inflationary concerns, the market is pricing in a scenario where dollar strength could reassert itself — possibly leading to a reversal in NZDCAD’s recent strength.
In conclusion, while NZDCAD remains technically range-bound for now, the landscape is ripe for volatility. The confluence of resistance near 0.8317 and heightened anticipation around Fed-related news points to a critical juncture for this pair. Traders should monitor price action closely, remain aware of potential false breakouts, and align short-term strategies with the broader macro narrative that will emerge following the FOMC decision and Powell’s speech.
GbpAud now the “buyers” are within!Good day traders, we back with GBPAUD but before I go into it. Last week I took loss because I was buying GBPAUD but I lately found out I was way too early and my narrative has not changed at all.
1D- Daily TF we have a bearish structure and we know that once price shifts structure we want price to retest Atleast till the 0.705 of the OTE fib level to later continue to the Sellside liquidity.
4H- On this respective TF we are also in a bearish structure but I believe not for long because on the lower TF the shift higher has materialised, giving confirmation that we can start positioning ourselves for the up movement.
1H- ICT has a entry model(F.PFVG), on the hourly we saw prices giving back all of yesterday’s gains till it reach that level of first presented FVG and that’s what we gonna use as the level of interest.

USD is Bearish, SO BUY EUR, GBP, AUD, NZD CHF & JPY!In this video, we will update Saturday's forecasts mid-week, and look for valid setup for the rest of the week ahead. The following FX markets will be analyzed:
USD Index
EURUSD
GBPUSD
AUDUSD
NZDUSD
USDCAD
USDCHF
USDJPY
Enjoy!
May profits be upon you.
Leave any questions or comments in the comment section.
I appreciate any feedback from my viewers!
Like and/or subscribe if you want more accurate analysis.
Thank you so much!
Disclaimer:
I do not provide personal investment advice and I am not a qualified licensed investment advisor.
All information found here, including any ideas, opinions, views, predictions, forecasts, commentaries, suggestions, expressed or implied herein, are for informational, entertainment or educational purposes only and should not be construed as personal investment advice. While the information provided is believed to be accurate, it may include errors or inaccuracies.
I will not and cannot be held liable for any actions you take as a result of anything you read here.
Conduct your own due diligence, or consult a licensed financial advisor or broker before making any and all investment decisions. Any investments, trades, speculations, or decisions made on the basis of any information found on this channel, expressed or implied herein, are committed at your own risk, financial or other wise. In this video, we will update the forecasts for the following FX markets:

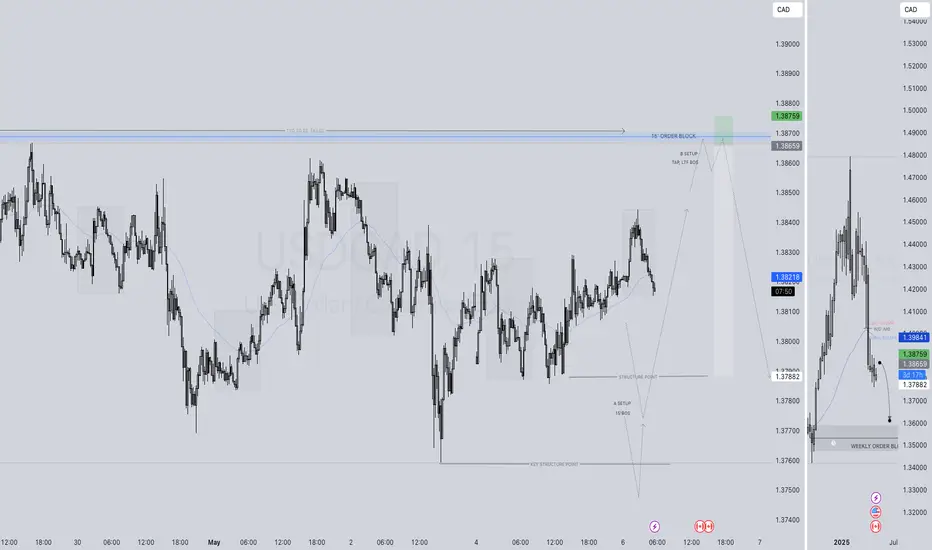
Usdcad PWL?!Good day traders, we back with USDCAD on the 4h TF. Well for this setup I am looking for price to take out out previous week low, previous week we had a candle stick pattern recognition after we saw price move lower but failing to close lower told a different story that price is not yet ready to start moving higher which honestly speaking was my bias last week. For the rest of the day I believe we can expect lower prices to close the day.
USDCAD SHORT FORECAST Q2 W19 D6 Y25USDCAD SHORT FORECAST Q2 W19 D6 Y25
Professional Risk Managers👋
Welcome back to another FRGNT chart update📈
Diving into some Forex setups using predominantly higher time frame order blocks alongside confirmation breaks of structure.
Let’s see what price action is telling us today!
💡Here are some trade confluences📝
✅Intraday breaks of structure
✅Tokyo ranges to be filled
✅15' order block identified
✅ inconclusive regarding 15' mitigated, therefore 5' order block identified after potential 15' mitigation
🔑 Remember, to participate in trading comes always with a degree of risk, therefore as professional risk managers it remains vital that we stick to our risk management plan as well as our trading strategies.
📈The rest, we leave to the balance of probabilities.
💡Fail to plan. Plan to fail.
🏆It has always been that simple.
❤️Good luck with your trading journey, I shall see you at the very top.
🎯Trade consistent, FRGNT X
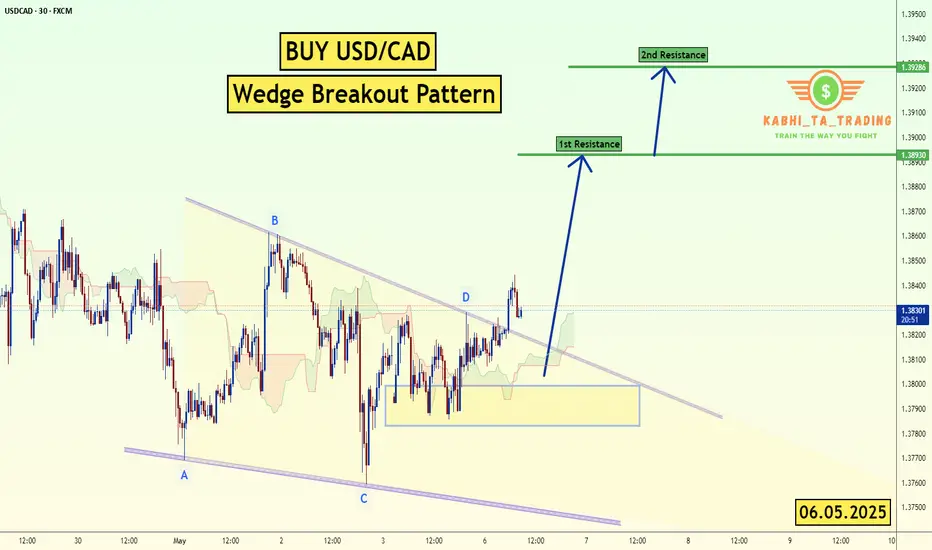
USD/CAD - Wedge Breakout (06.05.2025)The USD/CAD pair on the M30 timeframe presents a Potential Buying Opportunity due to a recent Formation of a Wedge Breakout Pattern. This suggests a shift in momentum towards the upside and a higher likelihood of further advances in the coming hours.
Possible Long Trade:
Entry: Consider Entering A Long Position around Trendline Of The Pattern.
Target Levels:
1st Resistance – 1.3893
2nd Resistance – 1.3928
🎁 Please hit the like button and
🎁 Leave a comment to support for My Post !
Your likes and comments are incredibly motivating and will encourage me to share more analysis with you.
Best Regards, KABHI_TA_TRADING
Thank you.
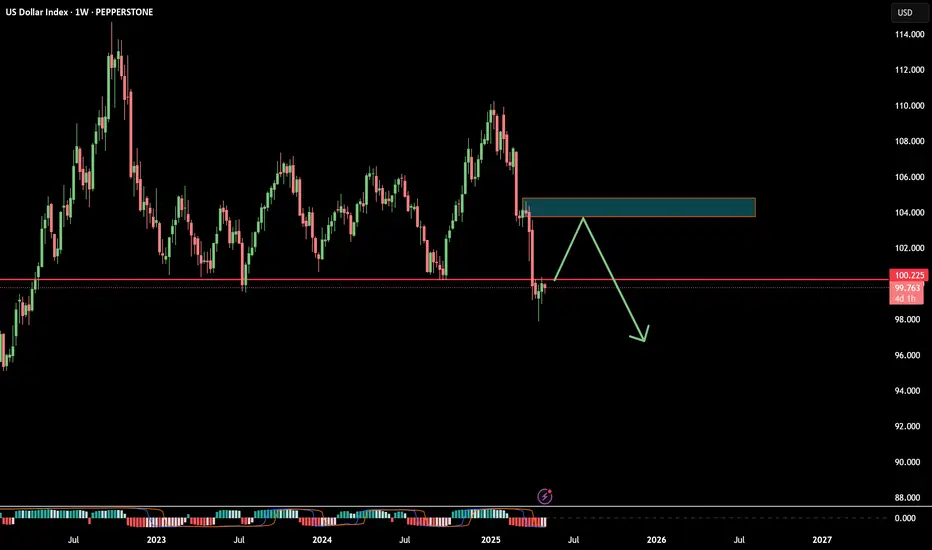
Dollar Bounce to 103 Incoming or Straight to 96?Will the Dollar Keep Tumbling, or Are We About to Bounce Back to 103 in May?
Checking out the monthly charts, April finally delivered a close under that critical 100 level, breaking a floor that held firm for years:
Zooming into the weekly chart, we’ve retraced back to test the 100 level from below. It’s now acting as resistance—so, is another big drop coming?
Long term, my bias is clear: the dollar looks set to keep sliding lower after breaking the crucial 100 mark. But if we flip to the daily charts, we can clearly see signs of a short-term bounce brewing. It looks like price might want to squeeze back inside the range, aiming for that juicy sell zone around the 103 mark—the very origin of the leg down that initially broke 100:
This 103 area is a prime spot for short-term bulls, and an even better opportunity to start loading up on shorts for a move down towards the Monthly buy zone around 96.
Personally, I won’t trade USDX directly to the upside—I'll instead use this analysis to play setups on pairs like EURUSD and AUDUSD, as they're approaching key resistance areas right now.
My game plan: wait patiently for price to reach around 103, then start hunting for sell signals. But first, we’ll need a solid daily close back above 100, something I think we could see happen this week.
Don’t forget—we’ve got the Fed’s interest rate decision coming up, which might trigger some volatility. We could easily rally up to 103 ahead of the decision and then see a sell-off afterward. Of course, if the Fed throws us a curveball, the dollar might never get back above 100, and just continue dropping straight away.
Right now, the 100 level is crucial—so watch closely.
What’s your take? Drop your thoughts below! 😊
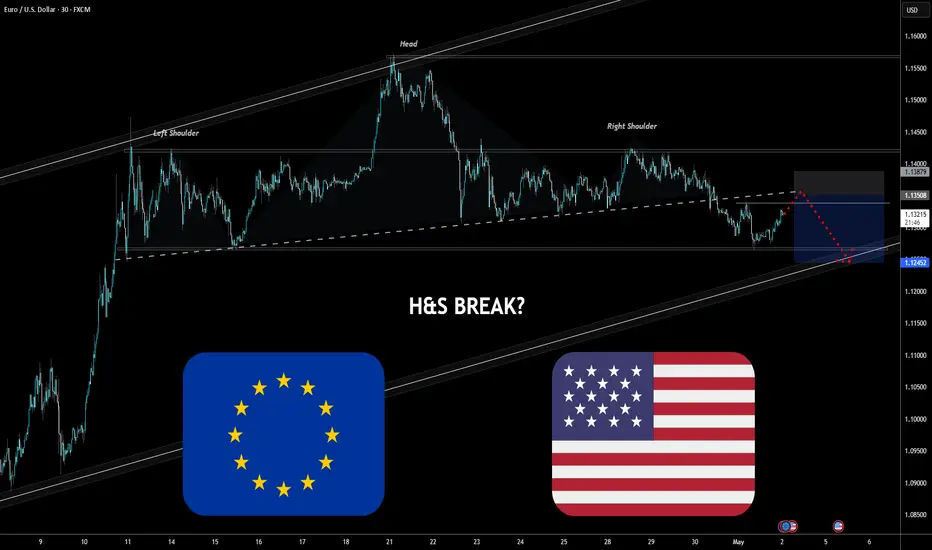
EURUSD | Head‑&‑Shoulders on the Brink – Bears Eye 1.1250📉 Trade Thesis
A textbook Head‑and‑Shoulders has completed on the 30‑min EURUSD chart. Price is now testing the rising neckline drawn from mid‑April swing lows. A clean close and retest beneath that trendline opens room toward the next demand shelf and the lower boundary of the broader ascending channel.
🎯 Execution Plan
Entry: wait for a decisive candle close below the neckline, then look to short on a minor pull‑back into that broken support.
Stop: just above the right‑shoulder high to keep risk tight.
Target: the measured‑move objective sits near the channel median/support cluster highlighted on the chart; scale out as price approaches that zone.
🧩 Confluence Factors
Momentum loss: RSI made a lower peak on the “head” versus the prior thrust, signalling fading upside energy.
Event risk: upcoming NFP/ISM releases may fuel USD volatility, providing the catalyst for a break.
Structure: the right shoulder’s supply shelf has capped every rally since late April, reinforcing bearish pressure.
⚠️ Risk Management
Macro data can produce whipsaws—size positions accordingly and stick to the plan. Move stops to breakeven once price pushes convincingly away from the neckline.
For educational purposes only. Trade your own strategy & manage risk.
btc on bullish#BTCUSD price have been declined and now forming to reverse above 95915 for sell retrace.
Above 94463 holds a strong bullish which will reach 95915, stop loss at 93725.
Below 93725 holds another bearish confirmation which will drop 93k-92500.
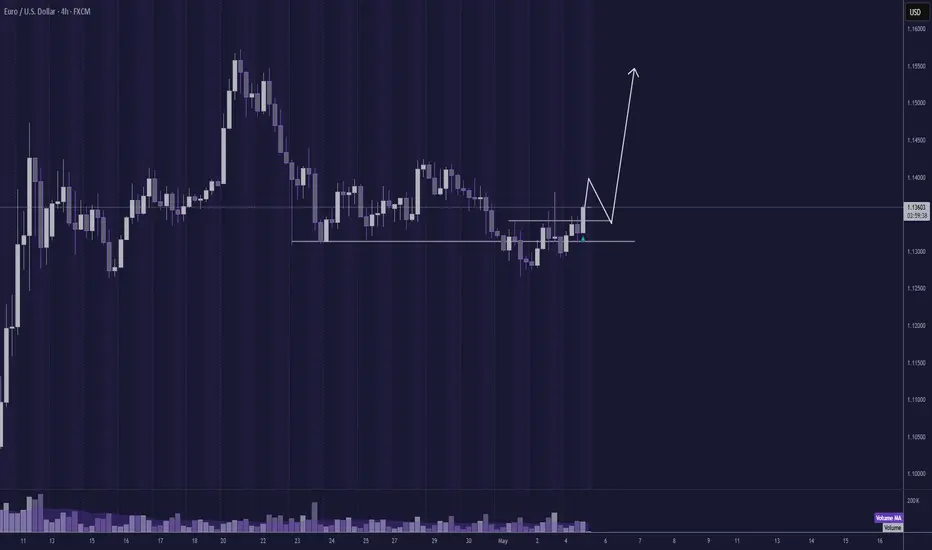
EURUSD directional bias: BuyPrice has closed above a key 4h resistance level. Based on the higher timeframe direction, I am expecting price to continue upwards to the recent high (1.5568).
Please be aware that we have a USD Interest Rate release on Wednesday which could cause a lot of volatility in the market. Keep this in mind if you decide to trade this direction.
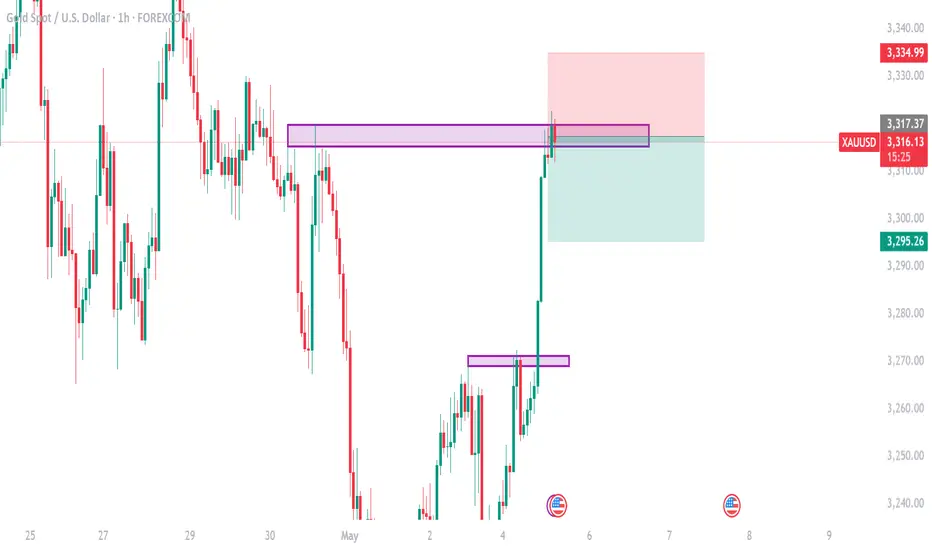
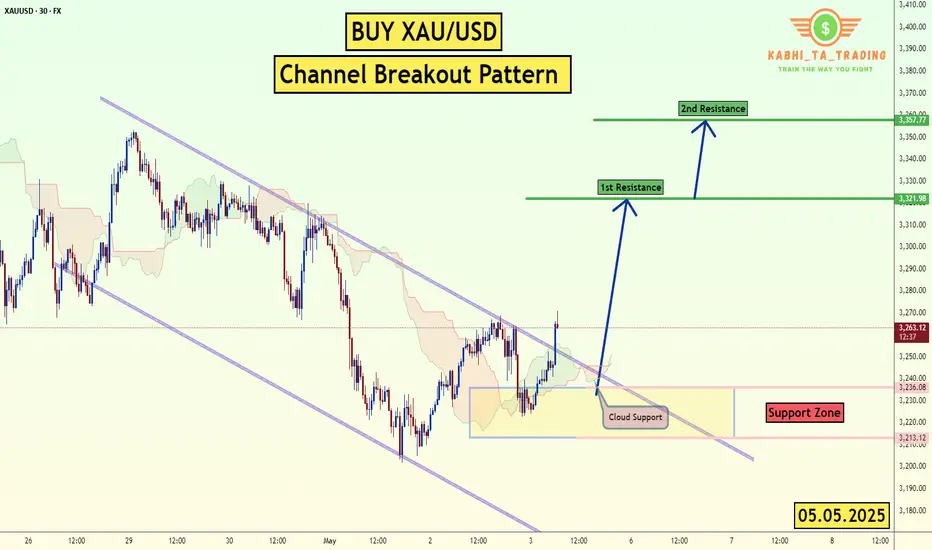
XAU/USD - Channel Breakout (05.05.2025)The XAU/USD pair on the M30 timeframe presents a Potential Buying Opportunity due to a recent Formation of a Channel Breakout Pattern. This suggests a shift in momentum towards the upside and a higher likelihood of further advances in the coming hours.
Possible Long Trade:
Entry: Consider Entering A Long Position around Trendline Of The Pattern.
Target Levels:
1st Resistance – 3321
2nd Resistance – 3357
🎁 Please hit the like button and
🎁 Leave a comment to support for My Post !
Your likes and comments are incredibly motivating and will encourage me to share more analysis with you.
Best Regards, KABHI_TA_TRADING
Thank you.
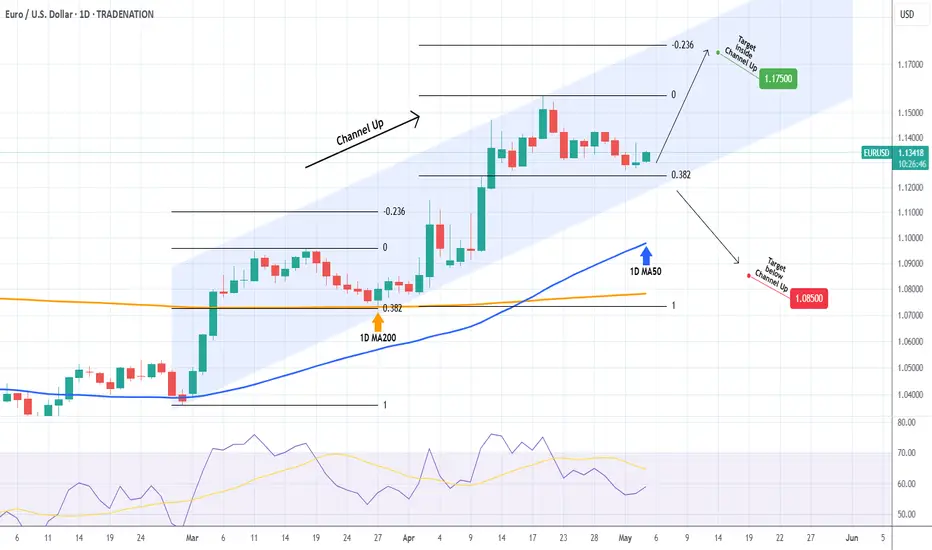
EURUSD Channel Up favors buying but keep an eye on this.The EURUSD pair has been trading within a Channel Up pattern since the February 28 Low and its current Bearish Leg almost reached the 0.382 Fibonacci retracement level. That is where the previous Bearish Leg made a Higher Low (March 27) and rebounded.
This keeps for now the bullish trend intact and it will remain so for as long as the price remains within the Channel Up. The short-term Target is the -0.236 Fib extension at 1.17500. If on the other hand it breaks below the Channel Up, be ready to take the small loss and sell towards the 1D MA200 (orange trend-line) at 1.08500, which is the level that supported the market on that previous March 27 Low.
-------------------------------------------------------------------------------
** Please LIKE 👍, FOLLOW ✅, SHARE 🙌 and COMMENT ✍ if you enjoy this idea! Also share your ideas and charts in the comments section below! This is best way to keep it relevant, support us, keep the content here free and allow the idea to reach as many people as possible. **
-------------------------------------------------------------------------------
Disclosure: I am part of Trade Nation's Influencer program and receive a monthly fee for using their TradingView charts in my analysis.
💸💸💸💸💸💸
👇 👇 👇 👇 👇 👇
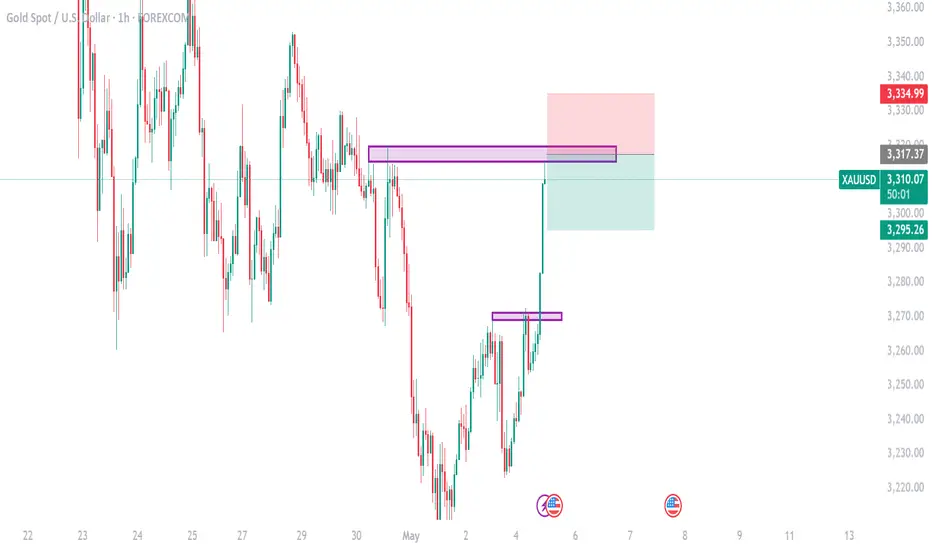
XAUUSD on sell#XAUUSD price have breakout 3300 and more which is now at 3315, we expect rejection between the upper rectangle.
Sell at 3315-3317, stop loss at 3335, take profit at 3295-3280.
If H1 makes a closure above 3330 or more then bullish next target is at 3400.
what is fair value gap ? what is fair value gap ?
-This Analysis is based on educational purposes using the concepts of Smart Money and Liquidity Sweep area
- We create two fair Value gaps in which market will act on that
first one is between 3247 to 3260 area expecting move down from that point and touched 3192 to 3165 which is a strong liquidity zone
