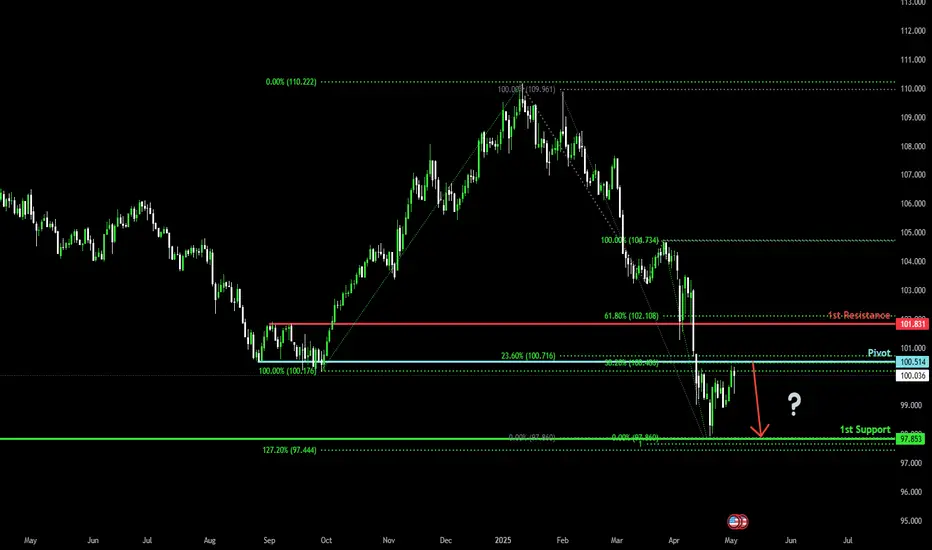
Bearish reversal?US Dollar Index (DXY) is rising towards the pivot and could reverse to the 1st support.
Pivot: 100.51
1st Support: 97.85
1st Resistance: 101.83
Risk Warning:
Trading Forex and CFDs carries a high level of risk to your capital and you should only trade with money you can afford to lose. Trading Forex and CFDs may not be suitable for all investors, so please ensure that you fully understand the risks involved and seek independent advice if necessary.
Disclaimer:
The above opinions given constitute general market commentary, and do not constitute the opinion or advice of IC Markets or any form of personal or investment advice.
Any opinions, news, research, analyses, prices, other information, or links to third-party sites contained on this website are provided on an "as-is" basis, are intended only to be informative, is not an advice nor a recommendation, nor research, or a record of our trading prices, or an offer of, or solicitation for a transaction in any financial instrument and thus should not be treated as such. The information provided does not involve any specific investment objectives, financial situation and needs of any specific person who may receive it. Please be aware, that past performance is not a reliable indicator of future performance and/or results. Past Performance or Forward-looking scenarios based upon the reasonable beliefs of the third-party provider are not a guarantee of future performance. Actual results may differ materially from those anticipated in forward-looking or past performance statements. IC Markets makes no representation or warranty and assumes no liability as to the accuracy or completeness of the information provided, nor any loss arising from any investment based on a recommendation, forecast or any information supplied by any third-party.
DJ FXCM Index
Gold Market Outlook – Upcoming FED Decision & Trading StrategyAs we head into the upcoming week, all eyes are on the Federal Reserve's interest rate decision, which is a major catalyst for gold. This event could significantly influence gold’s direction — either fueling the ongoing bullish trend or triggering a pullback.
🔎 Current Technical Outlook:
Gold is currently showing strong bullish momentum across higher timeframes.
Liquidity targets remain above, with key zones likely to be breached via wicks or trendline taps.
Given the uncertainty around the news and macro factors, we’ll execute trades only on confirmed setups from lower timeframe's confirmation.
📌 Trade Plan:
Open 50% of the position at $3160,
an inevitable level which is a critical level backed by technical confluence.
Enter remaining positions based on lower timeframe confirmation.
📝 Supporting Fundamentals:
COT (Commitment of Traders) Report indicates an increase in net long positions on gold.
$3160 is highly probable — we anticipate price to tap this zone.
The U.S. has significantly increased gold imports, reflecting strategic accumulation.
Smart money has taken partial profits, but large bullish positions are still being held.
Expectation: A sweep of major liquidity levels, followed by a continuation of the bullish trend.
Stay sharp and disciplined. Wait for confirmation before adding full exposure.

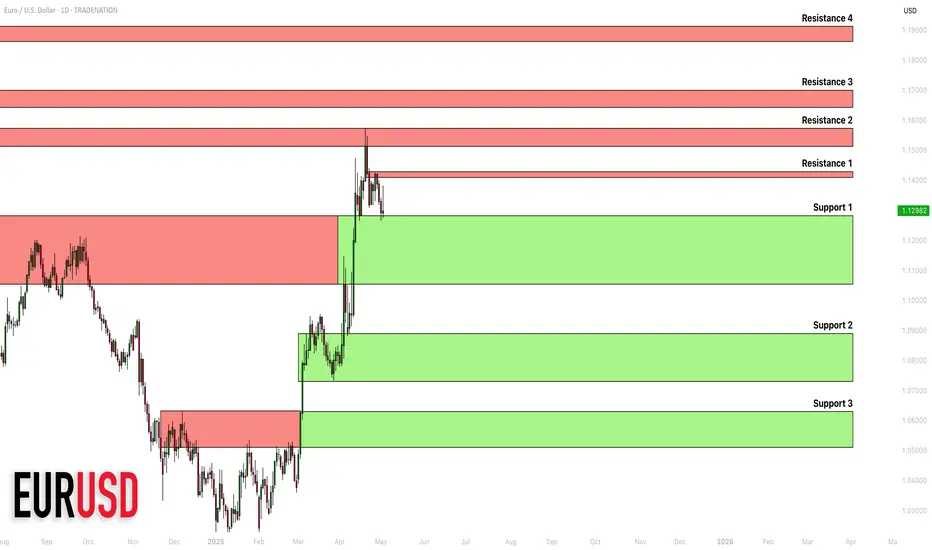
EURUSD: Detailed Support & Resistance Analysis 🇪🇺🇺🇸
Here is my latest structure analysis
and important supports & resistances on EURUSD
for next week.
Consider these structures for pullback/breakout trading.
❤️Please, support my work with like, thank you!❤️
I am part of Trade Nation's Influencer program and receive a monthly fee for using their TradingView charts in my analysis.
Technical Analysis for FX,Indices and many More!(5May-9May2025)Hello fellow traders , my regular and new friends!
Which pairs or instruments should we keep a look out for?
For me I am looking at :
GbpAud and probably EurAud for shorts
BTC likely to continue upwards move
Majors to turn lower against USD
Precious metals like copper and silver to bear more, Gold too.
This coming week is packed with interest rate decision, how?What to do?
Do check out my recorded video for more insights!
Do Like and Boost if you have learnt something and enjoyed the content, thank you!
-- Get the right tools and an experienced Guide, you WILL navigate your way out of this "Dangerous Jungle"! --

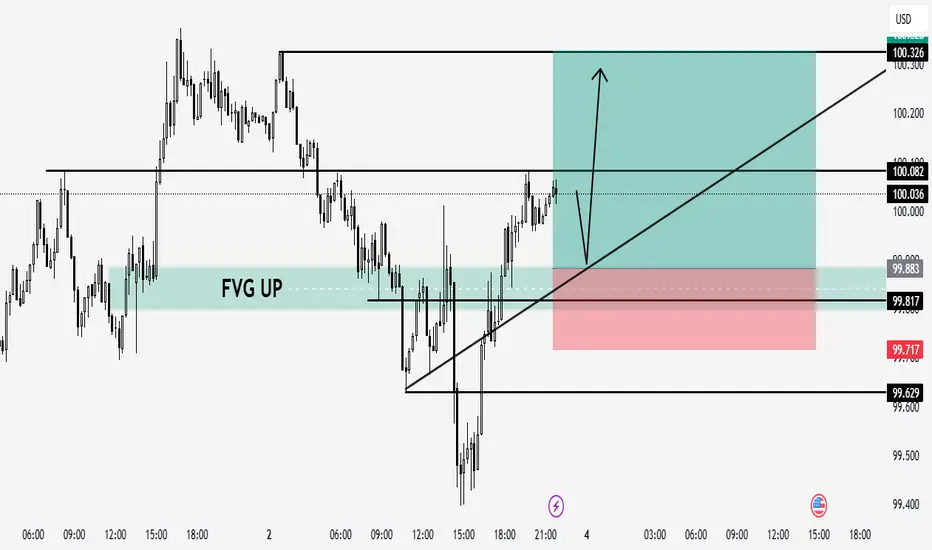
DXY (US Dollar Index) – Bullish Setup📊 DXY (US Dollar Index) – Bullish Setup from FVG & Trendline Confluence
Price tapped into a well-defined Fair Value Gap (FVG UP) aligning with bullish trendline support. I'm anticipating a small retracement toward the 99.88–99.81 area before continuation upward.
📍 Entry Zone: 99.88 – 99.81 (FVG + Trendline)
🛑 Stop Loss: 99.71
🎯 Target (TP): 100.32
📐 RR: Approx. 1:3
Confluences:
Bullish market structure
FVG filled & respected
Ascending trendline support
Liquidity taken below previous lows
🔔 Watching for bullish reaction after the minor pullback for confirmation.
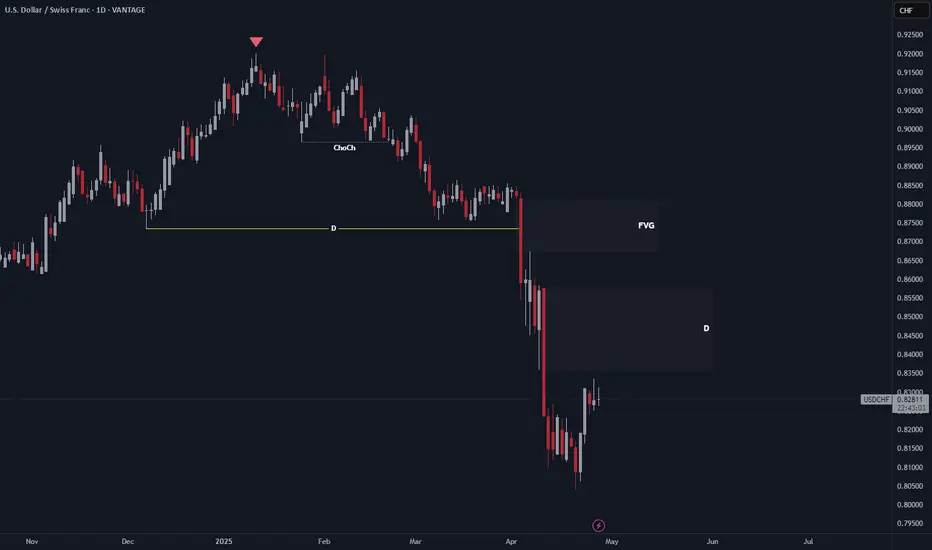
USD/CHF: Bearish ForecastPrice is likely to retrace into the 0.83593 – 0.85750 demand zone or push higher into the FVG (0.8700 – 0.8800) before facing rejection. As long as price holds below these zones, the downtrend should continue, targeting new lows below 0.8100.
Bearish momentum remains intact unless price breaks above the FVG.
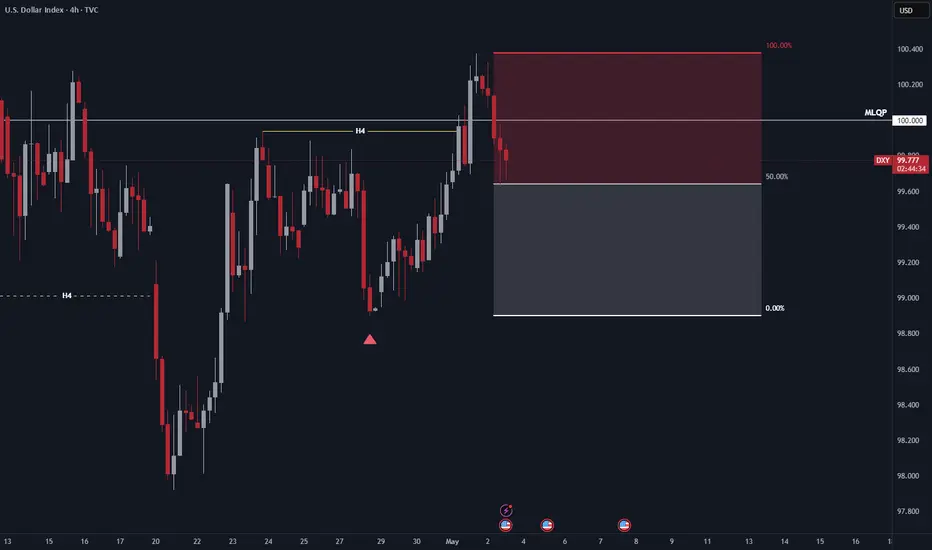
NFP Analysis: More Bullish Order Flow?The Dollar has broken structure to the upside and is now pulling back into equilibrium. From this discounted level, I'm looking to capitalise on any valid bullish setups, as break-of-structure moves often lead to continuation towards previous highs.
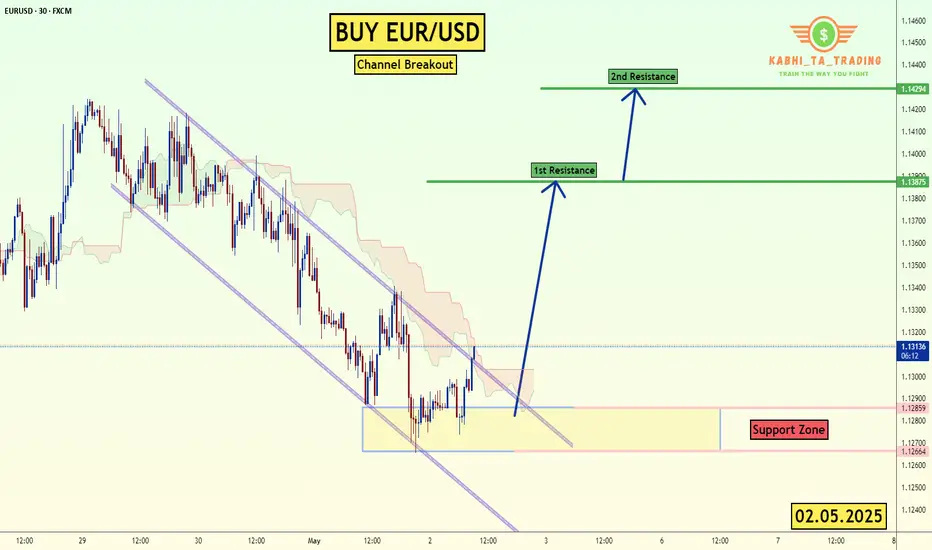
EUR/USD - Channel Breakout (02.05.2025) FX:EURUSD The EUR/USD pair on the M30 timeframe presents a Potential Buying Opportunity due to a recent Formation of a Breakout Pattern. This suggests a shift in momentum towards the upside and a higher likelihood of further advances in the coming hours.
Possible Long Trade:
Entry: Consider Entering A Long Position around Trendline Of The Pattern.
Target Levels:
1st Resistance – 1.1387
2nd Resistance – 1.1430
🎁 Please hit the like button and
🎁 Leave a comment to support for My Post !
Your likes and comments are incredibly motivating and will encourage me to share more analysis with you.
TVC:DXY
Best Regards, KABHI_TA_TRADING
Thank you.
USDJPY: Bounce on the 17 month Support starting massive rally.USDJPY is neutral on its 1D technical outlook (RSI = 50.306, MACD = -0.870, ADX = 40.251) but is on a massive bounce on the S1 Zone, which has been holding since December 25th 2023. That Low last week also approached the 1W MA200. The LH trendline is the Resistance level of this pattern (Descending Triangle) and since the last one hit the 0.786 Fibonacci, we expect this one to hit the 0.618 Fib (TP = 153.500).
## If you like our free content follow our profile to get more daily ideas. ##
## Comments and likes are greatly appreciated. ##

NFP is out. Market reaction - 2025.05.02The NFP number came out higher than the forecast, but lower than the previous (even the revised one). The initial reaction was in favour of DXY, but it has gone quiet very quickly. Maybe because of the fact that the market is preparing for some action on 7th of May, when the Fed announces interest rates.
Let's dig in...
MARKETSCOM:DOLLARINDEX
FX_IDC:AUDUSD
FX_IDC:USDJPY
Let us know what you think in the comments below.
Thank you.
77.3% of retail investor accounts lose money when trading CFDs with this provider. You should consider whether you understand how CFDs work and whether you can afford to take the high risk of losing your money. Past performance is not necessarily indicative of future results. The value of investments may fall as well as rise and the investor may not get back the amount initially invested. This content is not intended for nor applicable to residents of the UK. Cryptocurrency CFDs and spread bets are restricted in the UK for all retail clients.

gold on sell#XAUUSD have corrected back above 3267 which formation have decline from there.
Now the expected entry to sell is at 3267 which have broken now we expect the H1 to close between the rectangle to have a clear bearish range. Stop loss at 3278 target 3236
Bullish can overtake by fundamental news.

USD Is Bullish Short Term. Short The Majors! This is the FOREX outlook for the week of April 28 - May 2nd.
In this video, we will analyze the following FX markets:
USD Index
EUR
GBP
AUD
NZD
CAD, USDCAD
CHF, USDCHF
JPY, USDJPY
The USD Index is heading up towards a bearish FVG. The EURUSD, GBPUSD, and the other Major pairs will be pulled down by this price action .... until the USD hits it's POI. Then things will get interesting!
Take advantage of the USD push higher!
Remember, NFP is Friday! Be careful of wonky price action on Thursday and Friday.
Enjoy!
May profits be upon you.
Leave any questions or comments in the comment section.
I appreciate any feedback from my viewers!
Like and/or subscribe if you want more accurate analysis.
Thank you so much!
Disclaimer:
I do not provide personal investment advice and I am not a qualified licensed investment advisor.
All information found here, including any ideas, opinions, views, predictions, forecasts, commentaries, suggestions, expressed or implied herein, are for informational, entertainment or educational purposes only and should not be construed as personal investment advice. While the information provided is believed to be accurate, it may include errors or inaccuracies.
I will not and cannot be held liable for any actions you take as a result of anything you read here.
Conduct your own due diligence, or consult a licensed financial advisor or broker before making any and all investment decisions. Any investments, trades, speculations, or decisions made on the basis of any information found on this channel, expressed or implied herein, are committed at your own risk, financial or otherwise.

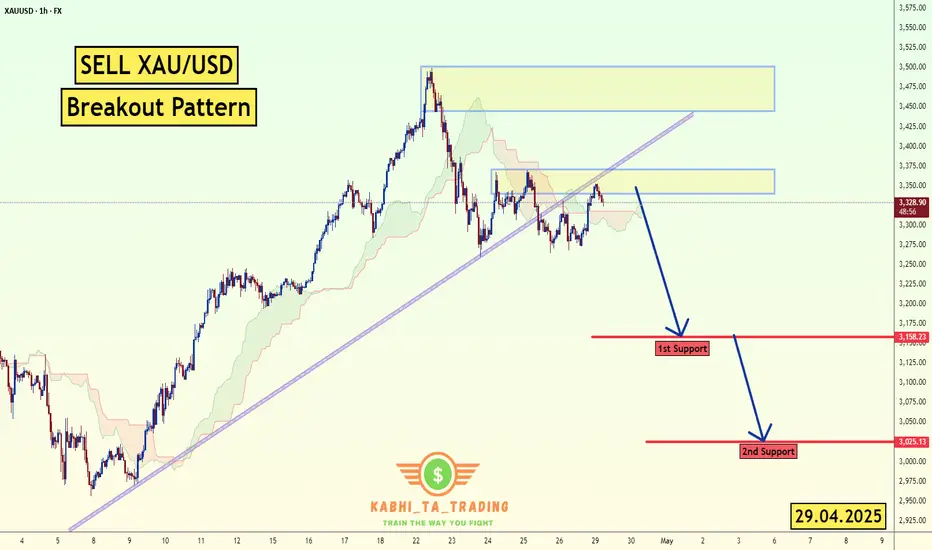
XAU/USD (Gold) H1 Breakout (29.04.2025)The XAU/USD Pair on the H1 timeframe presents a Potential Selling Opportunity due to a recent Formation of a Breakout Pattern. This suggests a shift in momentum towards the downside in the coming hours.
Possible Short Trade:
Entry: Consider Entering A Short Position around Trendline Of The Pattern.
Target Levels:
1st Support – 3158
2nd Support – 3025
🎁 Please hit the like button and
🎁 Leave a comment to support for My Post !
Your likes and comments are incredibly motivating and will encourage me to share more analysis with you.
Best Regards, KABHI_TA_TRADING
Thank you.
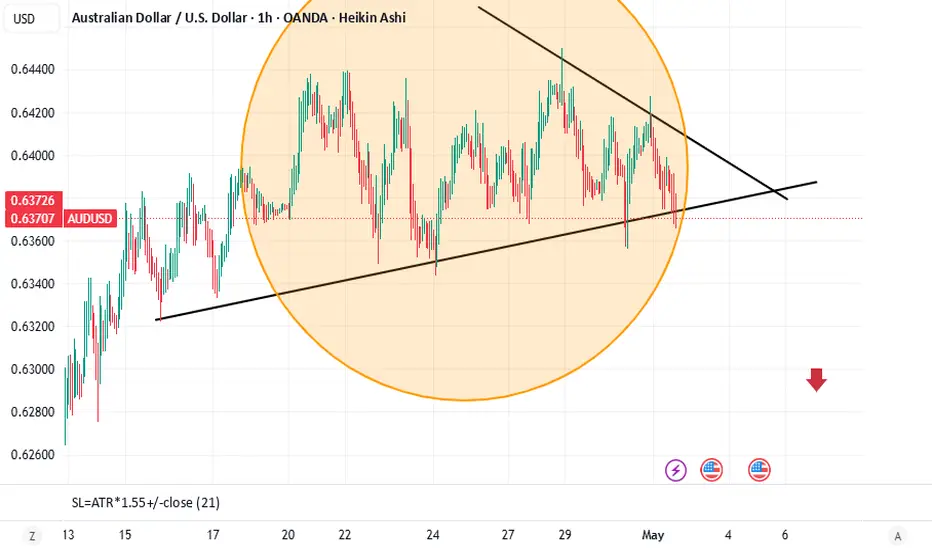
AUDUSD SELL (USD NFP NEWS FRDAY TOMORROW)As the chart looks its building resistance with many wicks, we can most likely see AUDUSD will drop tomorrow as Non-Farm Payroll from USD. It does not seem it will push up as I thought to expect to break the resistance, but still keep a good watch on it.
Take Profit: 0.634 or below
gold on bearish reverse#XAUUSD price have now dropped below 3203 below, which have now formed a new pattern on sell.
Reverse at 3214 will continue bearish till 3183, stop loss at 3228.
Bullish can reconfirm below 3190 which holds multiple decline there.

DXY ReturnOne half of an inverse head and shoulders formed on the 1D chart. Pattern could complete on talks of tariffs calming. Ukraine mineral agreement will be good for USD long term.

XAU/USD - Bearish Flag Pattern (25.04.2025)The XAU/USD Pair on the M30 timeframe presents a Potential Selling Opportunity due to a recent Formation of a Bearish Flag Pattern. This suggests a shift in momentum towards the downside in the coming hours.
Possible Short Trade:
Entry: Consider Entering A Short Position around Trendline Of The Pattern.
Target Levels:
1st Support – 3232
2nd Support – 3188
🎁 Please hit the like button and
🎁 Leave a comment to support for My Post !
Your likes and comments are incredibly motivating and will encourage me to share more analysis with you.
Best Regards, KABHI_TA_TRADING
Thank you.

DXY Forecast: More Bearish OrderflowThis week, I anticipate further downside movement on the DXY, with price potentially reaching a key area of interest—a bullish order block. While the reaction at this level remains uncertain, my current bias remains bearish unless a break of structure to the upside signals a continuation of the bullish trend.

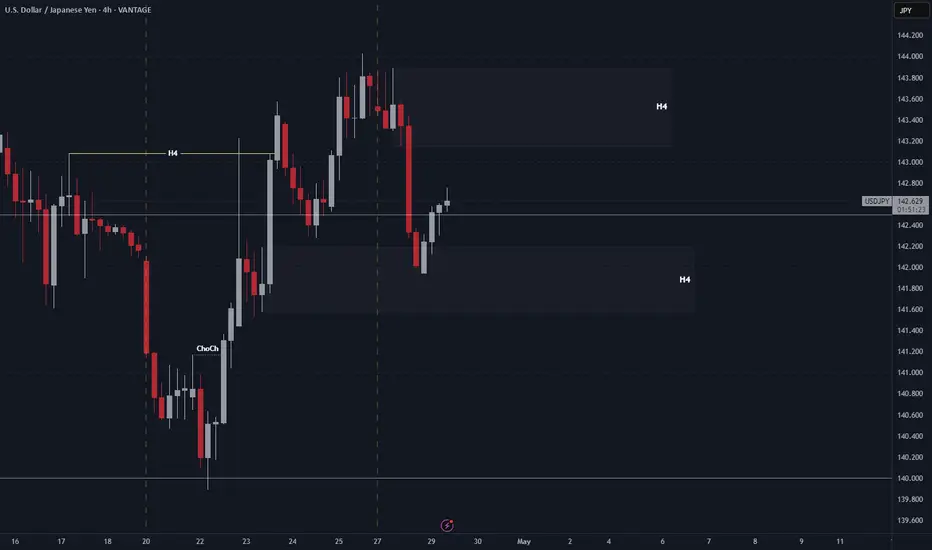
USDJPY Bearish Forecast, More Bearish Order FlowAfter the recent change of character from Monday, UJ continued lower and broke the H1 structure. As we all know, whenever you get a break of structure, expect a pullback. On the H4 there is a nice bearish OB which serves as a nice point of interest for price to rally back towards, be mindful this OB is big so we don't know what to expect once price reaches it.
For now this is how I see the dollar heading towards.
USDCHF: More Bearish Order FlowSimilar to USDJPY , USDCHF has exhibited a change of character, initiating a bearish order flow for the week. Price has reached a key point of interest where a potential continuation to the downside could occur. The DXY is reflecting similar behaviour, supporting the bearish outlook.
An entry position has been established, and now it is a matter of monitoring the trade and allowing the market to develop accordingly.

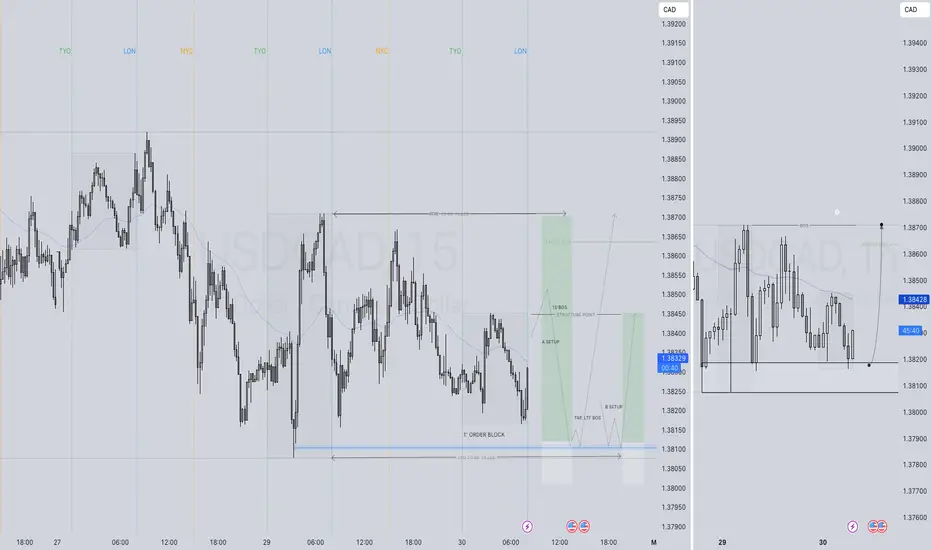
USDCAD LONG FORECAST Q2 W18 D30 Y25 USDCAD LONG FORECAST Q2 W18 D30 Y25
Professional Risk Managers👋
Welcome back to another FRGNT chart update📈
Diving into some Forex setups using predominantly higher time frame order blocks alongside confirmation breaks of structure.
Let’s see what price action is telling us today!
💡Here are some trade confluences📝
✅Intraday bullish breaks of structure
✅Tokyo ranges to be filled
✅Daily low rejection
✅1' order block identified
🔑 Remember, to participate in trading comes always with a degree of risk, therefore as professional risk managers it remains vital that we stick to our risk management plan as well as our trading strategies.
📈The rest, we leave to the balance of probabilities.
💡Fail to plan. Plan to fail.
🏆It has always been that simple.
❤️Good luck with your trading journey, I shall see you at the very top.
🎯Trade consistent, FRGNT X
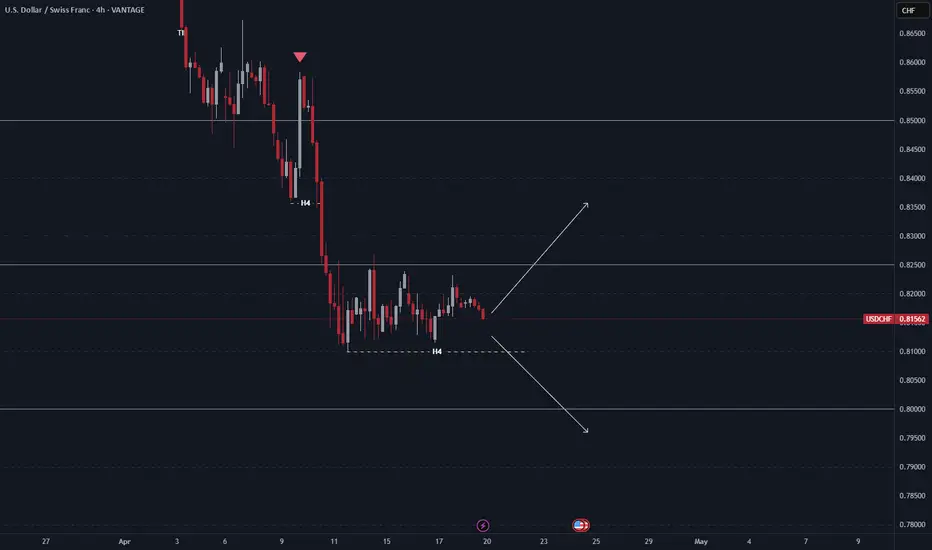
Market Analysis: USD/CHF – 4H ChartThe USD/CHF pair is exhibiting a **clear bearish trend** on the 4-hour chart, with price currently consolidating around the **0.81500** level after a sharp decline. This consolidation is forming a **range-bound structure**, with support near the recent H4 low and resistance around the **0.82500** zone.
Key Observations:
Bearish momentum remains dominant, evidenced by lower highs and lower lows.
Price is currently trading just above a well-tested H4 support level.
There are two probable outcomes from this consolidation zone:
Potential Scenarios:
1. Bullish Breakout:
A rejection from the H4 support could see price push back towards the **0.82500** level.
A breakout beyond this resistance could lead to further recovery towards **0.83500** or higher.
2. **Bearish Continuation**:
A break below the H4 support zone would confirm further downside momentum.
This could lead price towards the next key support around **0.80000**, with potential extension to the **0.78500** region.
Conclusion:
USD/CHF is currently at a decision point within a broader bearish structure. Traders should watch for a breakout from the current range to confirm the next directional move, with **0.82500** and **0.80000** acting as critical inflection zones.
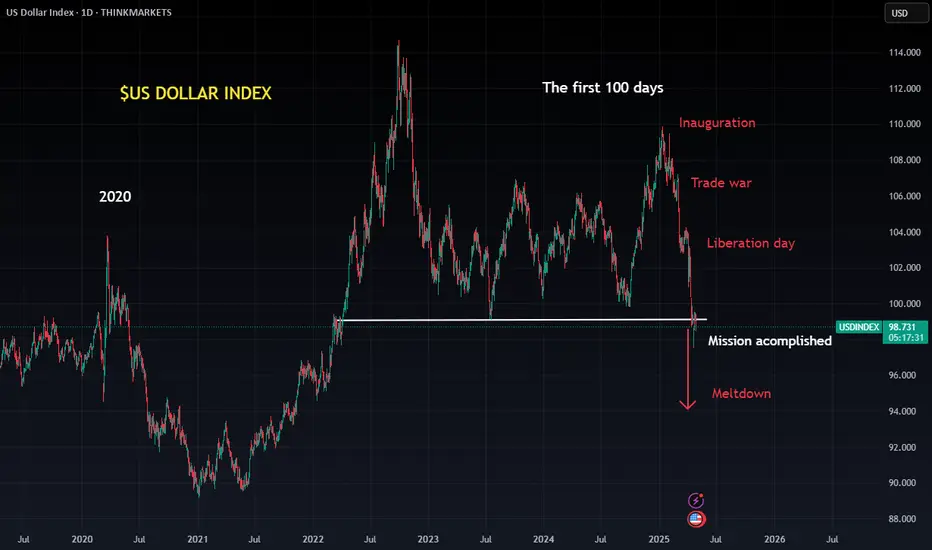
$USD Breaks Down – “Mission Accomplished” or Just Getting📉 The US Dollar Index ( AMEX:USD / TVC:DXY / $USINDEX) has officially broken beneath the multi-year support zone from 2020, right as Trump prepares to declare "Mission Accomplished".
From Inauguration to Liberation Day, and now the final stage: Meltdown.
🧭 Key Events Marked:
🟥 Inauguration
🟥 Trade War
🟥 Liberation Day
🟩 Mission Accomplished
🔻 Meltdown incoming?
📊 The breakdown aligns with a sharp spike in Nasdaq down volume (see chart). This isn't just a currency move — it's a market-wide stress signal.
Watch closely:
TVC:DXY below 99 = structural weakness.
Risk-on assets may melt up temporarily, but volatility could snap back fast.
Global currency pairs ( FX:EURUSD , FX:USDJPY , FX:GBPUSD ) are all on alert.