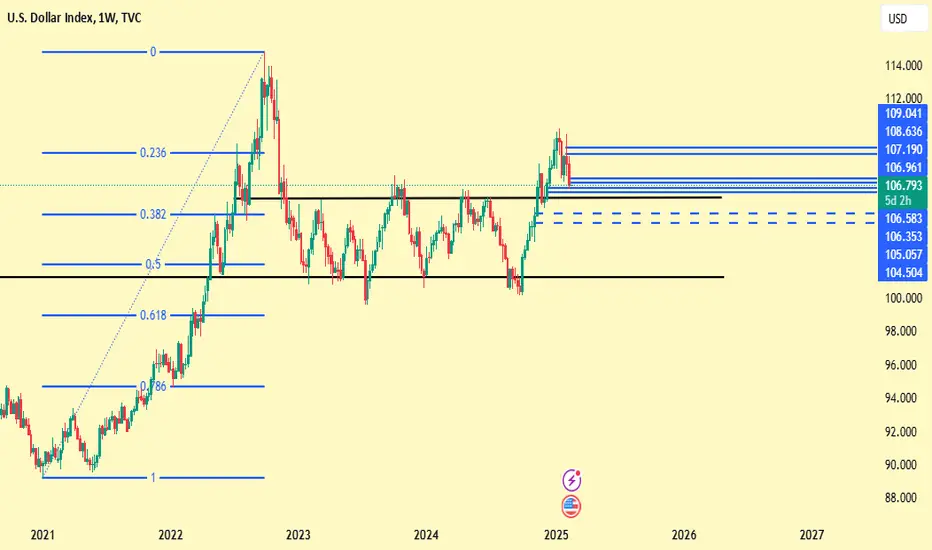
DXY Weekly Chart: "The Bull-trap Breakout"The US Dollar Index is currently positioned at the top of its trading range, which has been in play since 2023 on the weekly timeframe. This presents a solid bearish setup, as the index is likely to reverse and trade back into the range.
This trade idea has been in play since September of 2024 when we were still trading at the BOTTOM of the rang e
DJ FXCM Index
I see an upward movement in this game from the green zone.We have finished the downtrend and are starting a bullish position. I expect a return to the green zone in the post.
The divergence in volume is so high that we will definitely reach the green zone.
For the uptrend, we also have 3 ceilings at the beginning of the trend, which is very good for a return to the top.
tp3.5%
sl1.2%

EURUSD: Support & Resistance Analysis For Next Week 🇪🇺🇺🇸
Here is my latest structure analysis:
important supports and resistances for EURUSD for next week.
Consider these structures for pullback/breakout trading.
❤️Please, support my work with like, thank you!❤️

USDCAD Bearish scenarioWe can clearly see the consolidation on weekly chart.
Past 2 weeks we realy show selling presure.
That for me is confirmation that we will go down more.
The play is long term 1-2 yeras but can't beas easy as that.
So, trade safe!

Weekly FOREX Forecast Feb 17-21This is an outlook for the week of Feb 17-21st.
In this video, we will analyze the following FX markets:
USD Index
EURUSD
GBPUSD
AUDUSD
NZDUSD
CAD, USDCAD
CHF, USDCHF
JPY, USDJPY
The USD Index ran the previous weekly low Friday, capping off another bearish week. With the USD weakening on mixed fundamental news, its currency counterparts are taking advantage of the opportunity to outperform the USD.
Look for the majors to potentially move higher vs the USD this week.
Be mindful there is a lot of red folder news items coming up for the week ahead, to include FOMC on Wednesday.
Enjoy!
May profits be upon you.
Leave any questions or comments in the comment section.
I appreciate any feedback from my viewers!
Like and/or subscribe if you want more accurate analysis.
Thank you so much!
Disclaimer:
I do not provide personal investment advice and I am not a qualified licensed investment advisor.
All information found here, including any ideas, opinions, views, predictions, forecasts, commentaries, suggestions, expressed or implied herein, are for informational, entertainment or educational purposes only and should not be construed as personal investment advice. While the information provided is believed to be accurate, it may include errors or inaccuracies.
I will not and cannot be held liable for any actions you take as a result of anything you read here.
Conduct your own due diligence, or consult a licensed financial advisor or broker before making any and all investment decisions. Any investments, trades, speculations, or decisions made on the basis of any information found on this channel, expressed or implied herein, are committed at your own risk, financial or otherwise.

DEVIATON INJIt looks like we have a deviation below the demand zone and the $13.8 support, which could present a buying opportunity.
I’m waiting to see if the price finds support around $14.4.
If the price drops below $14 and stays there for an extended period, I’ll reassess the trade, as we could see another leg down toward the $8-$11 zone, where stronger support is likely.
For now, the weekly oscillators look decent—Stoch RSI is close to a bullish cross, and RSI has found support at 40.

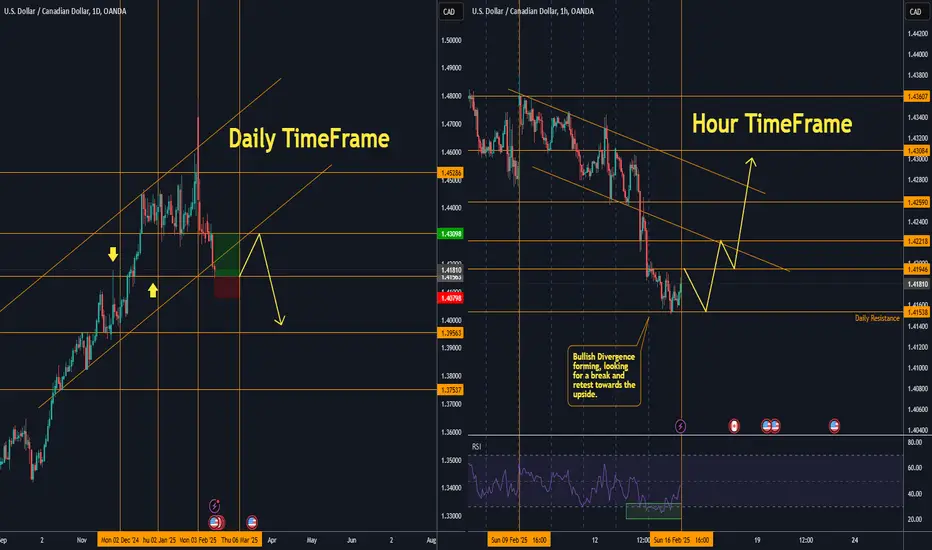
USDCAD 2/17 - 2/21Looking towards the left side on the daily timeframe we can see that price has bounced off of a major level of resistance. Zooming into the smaller timeframe on the right side (hour) we can see that price has started to slow down/forming bullish divergence. Could possibly be a nice catch towards the upside.
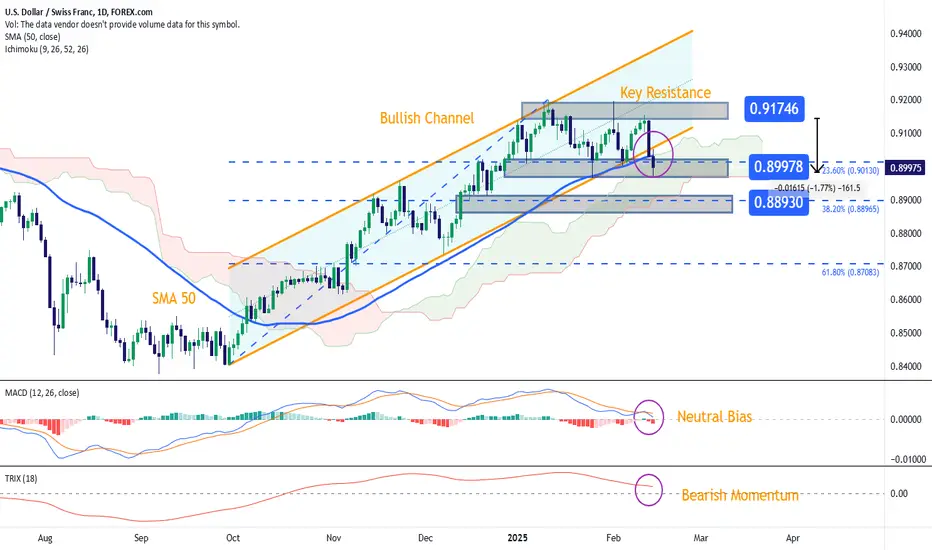
USD/CHF Prepares to Break Key Upward ChannelUSD/CHF has dropped more than 1.7% over the past two trading sessions as the U.S. dollar continues to weaken. So far, selling pressure on the U.S. currency remains strong, following disappointing retail sales data, which showed a -0.9% decline compared to the expected -0.2%. This has fueled concerns about a potential economic slowdown in the U.S.
Meanwhile, the Swiss franc, known as a safe-haven asset , has benefited from mixed economic data and the reciprocal tariffs policy announced by the Trump administration. This has kept demand for the franc stable and reinforced a strong bearish bias on USD/CHF.
Breakout of the Upward Channel
Since September 2024, the pair had maintained a solid upward channel, reaching a high of 0.92013. However, selling pressure has intensified, pushing price action below the lower boundary of the channel, which aligns with the 50-period simple moving average (SMA).
If pressure continues to build, the uptrend that has held for months could fade, giving way to a stronger downtrend—especially if price breaks the support zone where it is currently struggling.
MACD Indicator
The MACD line and the signal line both show a strong downward slope, approaching the neutral 0 level. The MACD histogram has also been consolidating near this level, indicating that the moving average trend is turning neutral.
As long as the histogram remains close to zero, it will be difficult for a new trend to emerge in the short term.
TRIX Indicator
The TRIX indicator supports the bearish scenario, as it has started declining sharply and is now approaching the 0 neutral line.
If the TRIX crosses below zero, it would confirm bearish dominance, reinforcing the selling momentum in USD/CHF.
Key Levels to Watch:
0.91746 – Resistance:
A critical level for bullish movements, marking a potential recovery zone for the previous upward channel.
If price rebounds to this level, it could invalidate the bearish trend and restore short-term buying momentum.
0.89978 – Key Support:
The current support level aligns with recent lows from previous sessions, the Ichimoku Cloud barrier zone, and the 23.6% Fibonacci retracement level, highlighting its significance as a key barrier for sellers.
A break below this level would accelerate bearish momentum, confirming the end of the previous uptrend.
0.88930 – Major Support:
A long-term support level, corresponding to neutral price zones from November 2024 and the 38.2% Fibonacci retracement level. If the bearish move extends to this point, it could signal the formation of a more significant downtrend in USD/CHF on the daily chart.
By Julian Pineda, CFA – Market Analyst
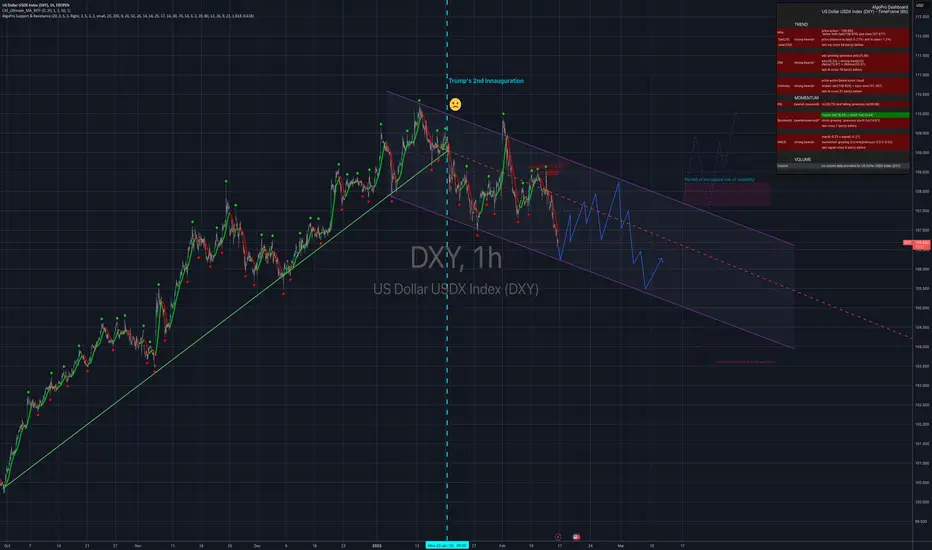
[4H] DXY - Mid-Term Analysis Under Donald TrumpThe U.S. dollar experienced heightened volatility on the day of Donald Trump’s hypothetical inauguration for a second term as president, reflecting market uncertainty around his policy agenda. Below is an analysis of potential drivers for the dollar’s trajectory, incorporating short-term dynamics and longer-term risks:
---
1. Tariffs, Inflation, and the Fed’s Response
A renewed push for reciprocal—and potentially universal (due to practicality)—tariffs could disrupt global trade flows, raising import costs for U.S. businesses and consumers. Coupled with an already tight labor market, these pressures could accelerate inflation. Elevated input costs (e.g., raw materials, manufactured goods) might manifest in key metrics like the Consumer Price Index (CPI) as early as Q2 2024 (March-May), particularly if supply chains face renewed bottlenecks.
In this scenario, the Federal Reserve —which remains staunchly data-dependent—could respond with rate hikes to anchor inflation expectations. Higher interest rates would likely bolster the dollar’s appeal in the near term, attracting foreign capital seeking yield advantages in U.S. Treasuries or other dollar-denominated assets. Markets may price in this hawkish pivot ahead of official Fed action, amplifying short-term dollar strength.
---
2. Safe-Haven Demand Amid Geopolitical Risks
Trump’s aggressive trade rhetoric (e.g., targeting China, the EU, or emerging markets) risks sparking retaliatory measures, reviving fears of a global trade war. Heightened geopolitical uncertainty could drive investors toward traditional safe-haven assets, including the U.S. dollar and Treasury bonds. This dynamic would likely support the DXY (Dollar Index) in the short term, particularly if equity markets react negatively to protectionist policies.
---
3. Long-Term Risks: Economic Slowdown and Eroded Confidence
While tariffs and inflation may initially buoy the dollar, their prolonged implementation could backfire. Sticky or increased inflation combined with higher borrowing costs (from Fed hikes) might dampen consumer spending, corporate investment, and GDP growth. Simultaneously, trade barriers could shrink export opportunities for U.S. industries, exacerbating economic headwinds.
Over a multi-year horizon, these factors could undermine confidence in the dollar’s stability, especially if deficits widen or growth stagnates ( stagflation risks ). Markets are forward-looking, however, and may begin discounting these risks earlier—potentially as soon as late 2024—if trade tensions escalate or growth indicators falter.
---
Conclusion: Volatility as the Only Certainty
The dollar’s path will hinge on the speed and scale of policy implementation, the Fed’s reaction function, and global market sentiment. While short-term strength is plausible due to rate hike expectations and safe-haven flows, structural risks loom on the horizon. Trump’s unpredictable policymaking style adds layers of uncertainty, suggesting the dollar could face a turbulent, news-driven cycle. Investors should brace for whipsaw moves in the DXY, with tactical opportunities in the near term countered by longer-term macroeconomic vulnerabilities.
Key Watchpoints: CPI prints (Q2 2024), Fed meeting language, trade negotiation timelines, and global central bank responses to U.S. protectionism.
---
This analysis balances immediate catalysts with structural shifts, acknowledging the dollar’s role as both a haven and a victim of its own policy successes.
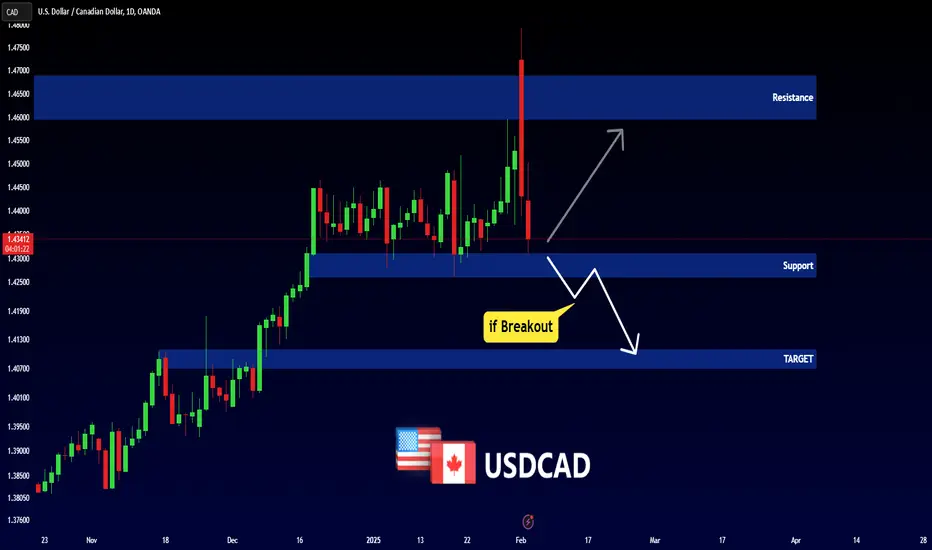
USDCAD - BEARISH SCENARIOHello Traders !
The USDCAD failed to break the resistance level (1.45957 - 1.46900).
Currently, The price is trading in the support level (1.43100 - 1.42610).
So, Let's expect the bearish scenario :
if the market breaks the support level and closes below that,
We will see a huge bearish move📉
__________
TARGET: 1.41100🎯
Hot Inflation & What to Watch Next - 14/02/2514th of February 2025
•XRP and BNB leading, as Bitcoin trades flat in the last seven days.
•Headline inflation metrics in the US land above expectations.
•Impactful data point to watch heading into the end of February.
---
A big week of headlines and events, particularly out of the US, have netted very little change in Bitcoin’s price.
Bitcoin is down 0.1% at the time of writing in the last seven-days, while altcoins such as XRP and BNB are showing double-digit gains.
Bitcoin has struggled to make new year-to-date highs in the current state of global conditions. In contrast, global indices in the UK (FTSE100) and China (CSI300) have continued to make new year-to-date highs
Mixed Messages & Above Expected Results
Fed Chair Jerome Powell mentioned earlier this week at a senate banking enquiry that the current state of monetary policy does not require easing conditions, as the economy remains strong and the 2% target for inflation is key.
However, he has referenced that unexpected moves in the labour market or a significant cooling of inflation could change the committee’s mind.
“If the labor market were to weaken unexpectedly or inflation were to fall more quickly than anticipated, we can ease policy accordingly.”
On this point, headline metrics for inflation land above expectations this week.
On Tuesday, Consumer Price Index (CPI) landed above expectations at 3.0%, rising 0.1% from the previous month.
Overnight the Producers Price Index (PPI) landed above expectations at 3.5% year-on-year. This figure remains unchanged from the previous month and represents the inflation burden on producers in the US.
Key data to come
On the last day of February the US Personal Consumption Expenditures (PCE) data will provide further clarity towards the state of monetary policy heading into next month.
PCE is the leading indicator used by the policy committee to measure inflation.
Fear and greed currently reads 40 – neutral.
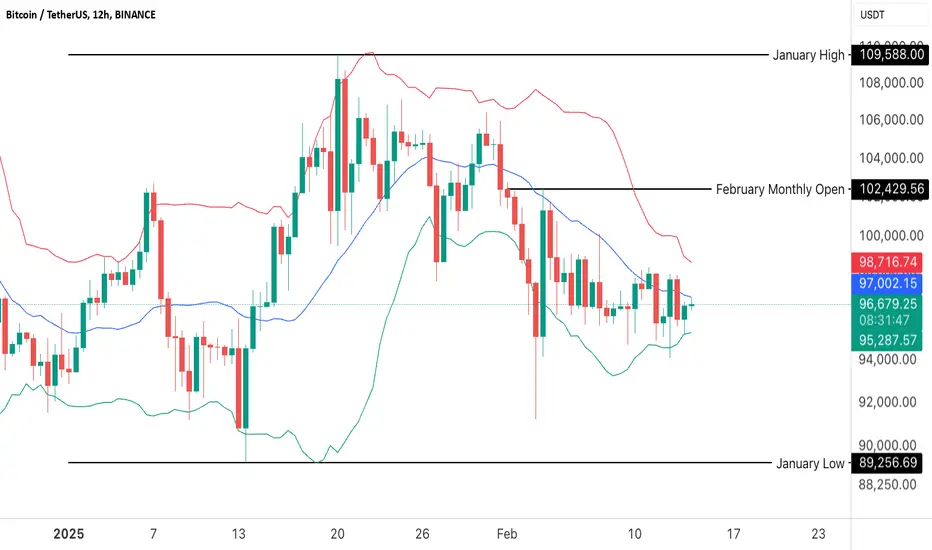
Bitcoin Analysis
The price of Bitcoin is currently trading within the January high and low range, and on the Bollinger band we are entering a period where the upper and bottom channel is compressing.
Bullish Scenario
In the coming days, price may see a sharp move higher as the Bollinger Bands tighten. If bulls regain control and reclaim the monthly open, they could push toward last month’s high.
Bearish Scenario
We could also with this compression in the Bollinger Bands, see volatility moving price to the downside. This may result in prices heading towards the January low.
DISCLAIMER: The information is for general information purposes only. It is not intended as legal, financial or investment advice and should not be construed or relied on as such. Before making any commitment of a legal or financial nature you should seek advice from a qualified and registered legal practitioner or financial or investment adviser. No material contained within this website should be construed or relied upon as providing recommendations in relation to any legal or financial product.
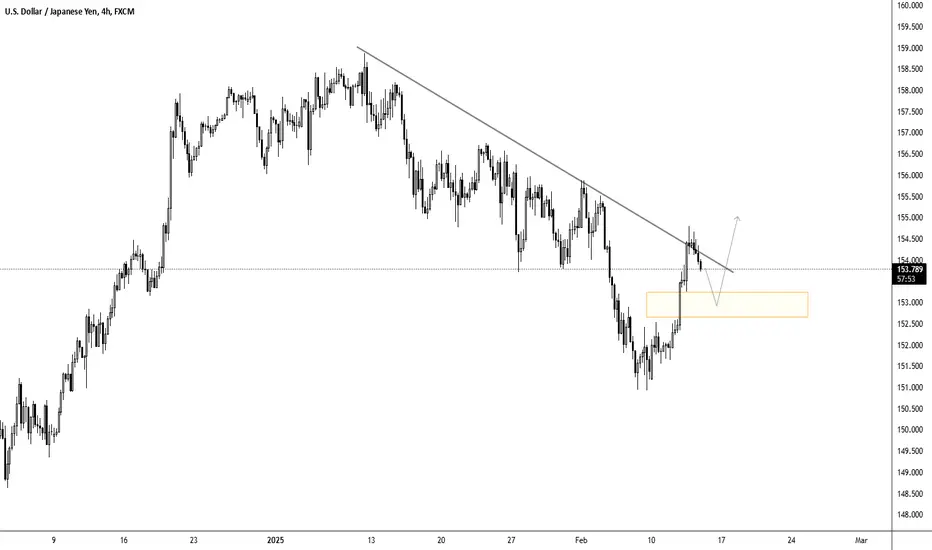
USDJPY - Trendline reached, watching the FVGThe price has recently reached and reacted to a significant descending trendline that has been acting as resistance since mid-January 2025. The current interaction with this trendline around 154.00 is particularly noteworthy as it coincides with a short-term pullback.
Below the current price action, there's a Fair Value Gap (FVG) marked by the orange box approximately at the 153.00 level. This FVG represents an inefficiency in price that often tends to get filled. Should the price pull back to this zone, it could present an interesting long opportunity for traders for several reasons:
1) The FVG zone could act as support, as these areas often attract price action
2) The pullback would allow for a better risk-reward ratio for potential longs
3) The recent upward momentum from the early February lows suggests underlying strength
For traders considering long positions, the FVG zone would be the key area to watch for potential entries.
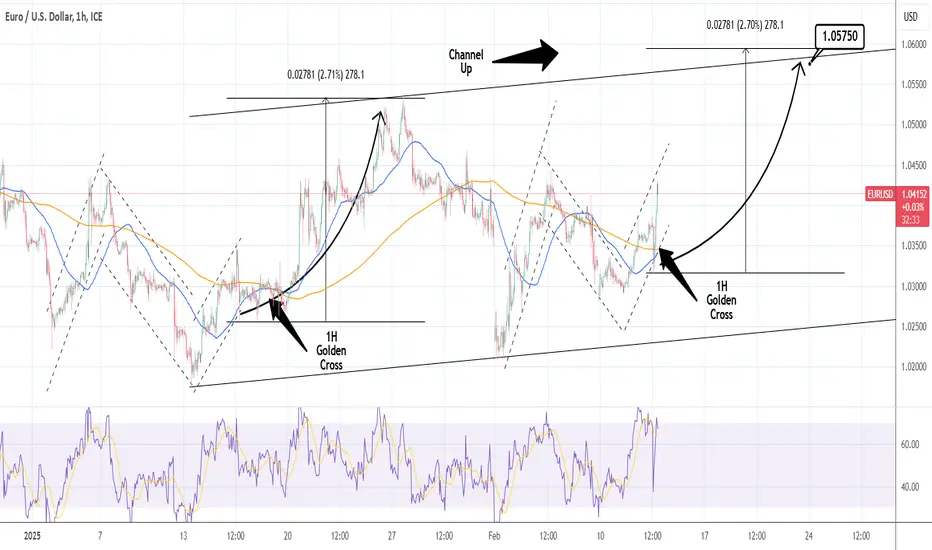
EURUSD: Channel Up aiming at 1.05750EURUSD is neutral on its 1D technical outlook (RSI = 53.912, MACD = -0.001, ADX = 23.143) as it has been ranging inside a Channel Up for the past month. The pair is now forming a Golden Cross on the 1H timeframe and based on the last one formed on the previous bullish wave (Jan 17th), it should now rise to a new HH. We expect a symmetric +2.70% rise on that move (TP = 1.05750).
## If you like our free content follow our profile to get more daily ideas. ##
## Comments and likes are greatly appreciated. ##
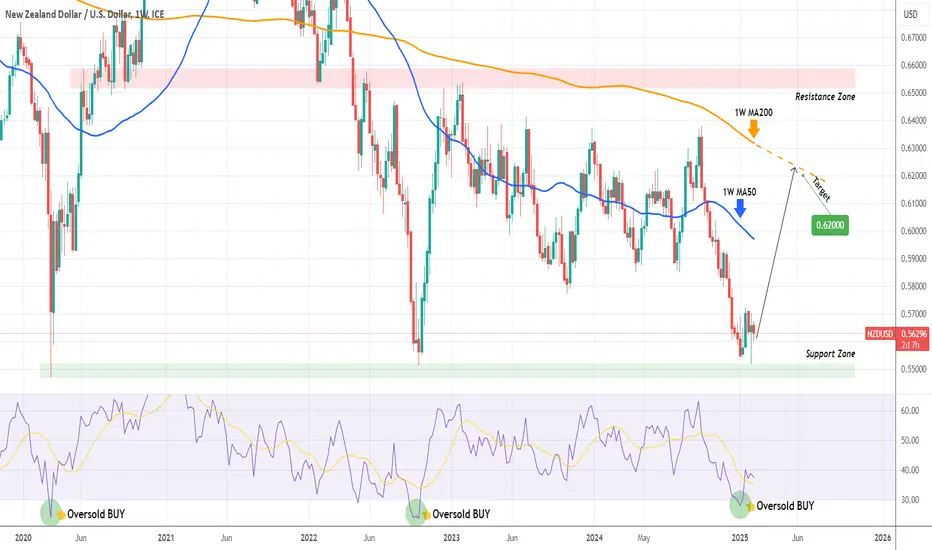
NZDUSD preparing massive rebound on the 5-year Support Zone.The NZDUSD pair rebounded last week exactly at the top of the 5-year Support Zone. This is the 3rd time in total and first since October 10 2022.
As you can see, both previous times that this Support Zone was touched, the price reacted with an immediate rebound and skyrocketed to the long-term Resistance Zone (0.65150 - 0.65850). Also on both those bottoms, the 1W RSI broke below the 30.00 oversold barrier and rebounded.
This time, we have the 1W MA200 (orange trend-line) to consider as the first long-term Resistance, so our Target is just below a potential extension of it at 0.6200.
-------------------------------------------------------------------------------
** Please LIKE 👍, FOLLOW ✅, SHARE 🙌 and COMMENT ✍ if you enjoy this idea! Also share your ideas and charts in the comments section below! This is best way to keep it relevant, support us, keep the content here free and allow the idea to reach as many people as possible. **
-------------------------------------------------------------------------------
💸💸💸💸💸💸
👇 👇 👇 👇 👇 👇
price on sideways#XAUUSD price have been declining between 2894-2887, now possible sideways is overtaking because the candlestick movement is repeating. Now we await for double breakout above 2909 for bullish, TP 2940-2950,SL 2900. Below 2881 have bearish but its won't last long, Tp 2876-2870,Sl 2886. Below those zone have bullish retracment.

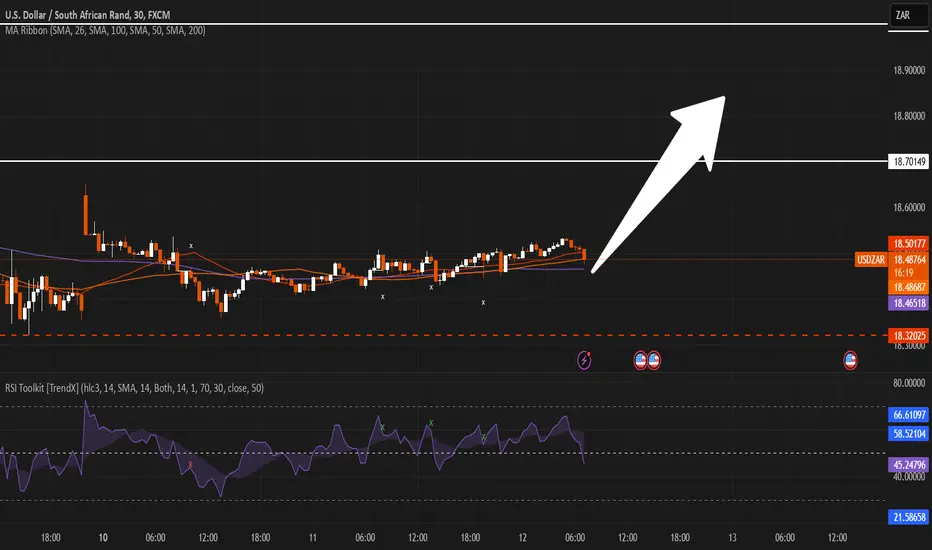
USD/ZAR may rise to 18.70149 - 19.00103Preference
Long positions above 18.32025 with targets at 18.70149 and 19.00103 in extension.
EUR/CAD Bullish Momentum Rising Channel Points to 1.5000 Target EUR/CAD is trading at approximately 1.4800. Your target price of 1.5000 indicates an anticipated upward movement of 200 pips, aligning with a bullish outlook within the context of a rising channel pattern.
Technical analysis on the daily chart suggests a bullish bias, as EUR/CAD continues to trade within an ascending channel pattern. This pattern is characterized by higher highs and higher lows, indicating sustained upward momentum. The pair is approaching the upper boundary of this channel, suggesting potential for further gains toward your target price.
On the 4-hour timeframe, EUR/CAD is trading within a rising channel as it approaches a confluence area. This consolidation pattern increases the likelihood of a bearish outcome, as traders can wait for the break and retest of the trendline support of the channel pattern to confirm a bearish entry.
In summary, the EUR/CAD pair is exhibiting bullish momentum within a rising channel pattern, with technical indicators supporting a potential move toward the 1.5000 target. Traders should monitor key support and resistance levels, as well as fundamental factors influencing the Euro and Canadian Dollar, to make informed trading decisions.

NVIDIA The Next long Too Take I cover NVIDIA Range and where I perceive us to gravitate too from the current level . Watch This Before You Buy Nvidia

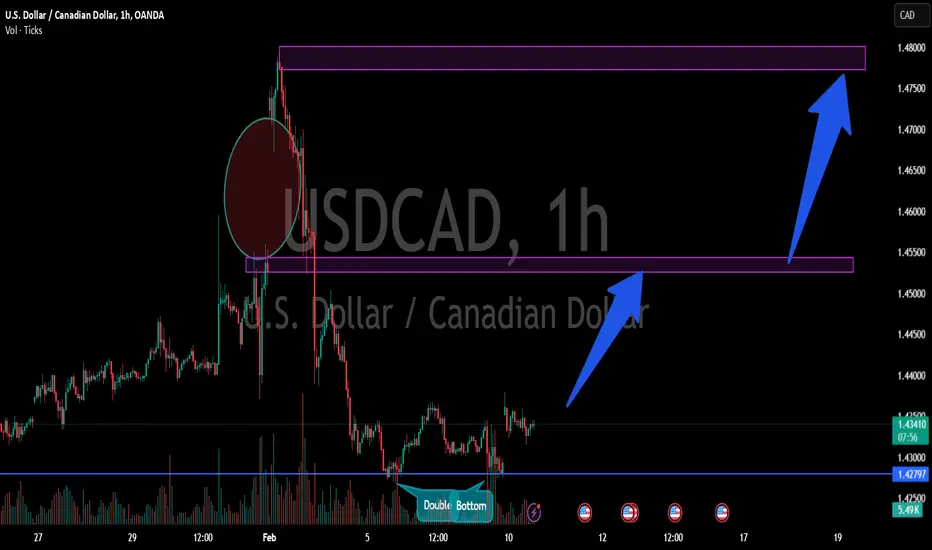
USDCAD on 1h time frame . Testing historical Resistance levelsUSDCAD 1H Analysis – February 10, 2025
📈 Potential Bullish Reversal
The chart shows a double bottom formation near 1.4280, which is a strong bullish reversal pattern.
Price has bounced from this level, suggesting a possible upward move.
📊 Key Resistance Zones to Watch:
1.4550 - 1.4570 → First key resistance (previous support turned resistance).
1.4780 - 1.4800 → Major resistance area where price previously rejected strongly.
🔍 Trading Outlook:
A break above 1.4350 could confirm the bullish momentum.
If price clears 1.4550, the next target would be 1.4800.
A rejection from resistance zones could lead to another decline.
📌 Conclusion: USDCAD is forming a potential bullish structure, but confirmation of a breakout above 1.4550 is needed before expecting further upside. 🚀
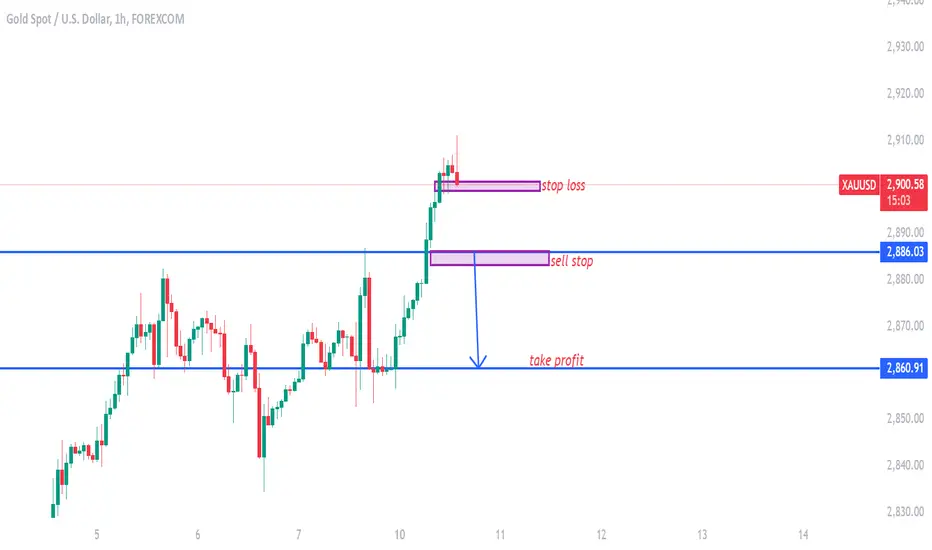
gold on sell#XAUUSD the price have reached new high, now possible reverse will occur below the today lows, sell stop at 2886, take profit 2860, stop loss at 2900. The bullish will continue if the reverse reach first but if multiple breakout occurs below then bearish correction awaits.
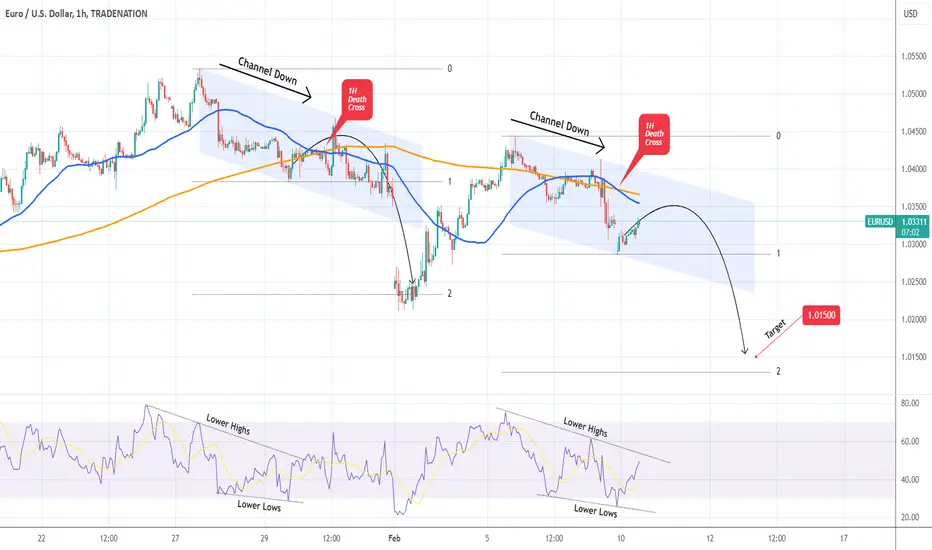
EURUSD 1H Death Cross waiting for the perfect Sell.The EURUSD pair completed a 1H Death Cross on today's opening, the first such formation since January 30. Given that we are currently within a Channel Down pattern similar to January's Death Cross, we expect the current formation to follow the trend of the former.
After a short-term rebound above the 1H MA200 (orange trend-line), the previous Channel Down declined aggressively to the 2.0 Fibonacci extension. This gives us a new bearish target at 1.01500.
-------------------------------------------------------------------------------
** Please LIKE 👍, FOLLOW ✅, SHARE 🙌 and COMMENT ✍ if you enjoy this idea! Also share your ideas and charts in the comments section below! This is best way to keep it relevant, support us, keep the content here free and allow the idea to reach as many people as possible. **
-------------------------------------------------------------------------------
Disclosure: I am part of Trade Nation's Influencer program and receive a monthly fee for using their TradingView charts in my analysis.
💸💸💸💸💸💸
👇 👇 👇 👇 👇 👇
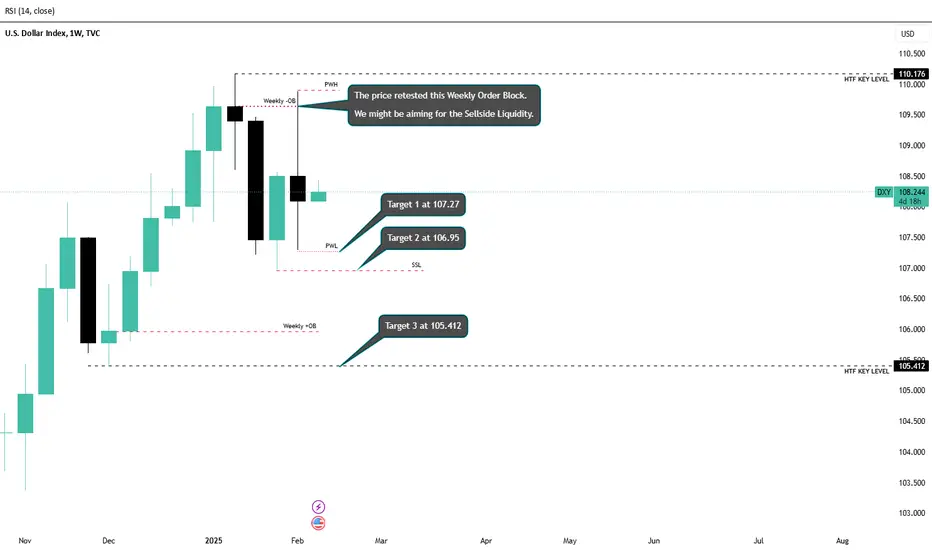
DXY Weekly BiasMy bias for this index is bearish considering that we retested and confirmed the Weekly Bearish Order Block at 109.65.
I do anticipate that the index might be attracted towards Sellside Liquidity at 107.27, 106.95 ,and 105.4.
Our daily setup will further give us the best entry and stop loss.
JPY | USDJPY Weekly FOREX Forecast: Feb 10-14thThis forecast is for the upcoming week, Feb 10-14th.
The Yen has been week for an extended amount of time, underperforming against the USD. But the tide is changing over the last 6 weeks. As the USD is reacting to a HTF selling zone over the this period of time, the Yen has been getting stronger. The potential is there for the YEN to start retracing to the upside.
Enjoy!
May profits be upon you.
Leave any questions or comments in the comment section.
I appreciate any feedback from my viewers!
Like and/or subscribe if you want more accurate analysis.
Thank you so much!
Disclaimer:
I do not provide personal investment advice and I am not a qualified licensed investment advisor.
All information found here, including any ideas, opinions, views, predictions, forecasts, commentaries, suggestions, expressed or implied herein, are for informational, entertainment or educational purposes only and should not be construed as personal investment advice. While the information provided is believed to be accurate, it may include errors or inaccuracies.
I will not and cannot be held liable for any actions you take as a result of anything you read here.
Conduct your own due diligence, or consult a licensed financial advisor or broker before making any and all investment decisions. Any investments, trades, speculations, or decisions made on the basis of any information found on this channel, expressed or implied herein, are committed at your own risk, financial or otherwise.
