AUDUSD Q3 | D21 | W30 | Y25📊AUDUSD Q3 | D21 | W30 | Y25
Daily Forecast 🔍📅
Here’s a short diagnosis of the current chart setup 🧠📈
Higher time frame order blocks have been identified — these are our patient points of interest 🎯🧭.
It’s crucial to wait for a confirmed break of structure 🧱✅ before forming a directional bias.
This keeps us disciplined and aligned with what price action is truly telling us.
📈 Risk Management Protocols
🔑 Core principles:
Max 1% risk per trade
Only execute at pre-identified levels
Use alerts, not emotion
Stick to your RR plan — minimum 1:2
🧠 You’re not paid for how many trades you take, you’re paid for how well you manage risk.
🧠 Weekly FRGNT Insight
"Trade what the market gives, not what your ego wants."
Stay mechanical. Stay focused. Let the probabilities work.
FRGNT 📊
DJ FXCM Index
Bearish drop off 50% Fibonacci resistance?The US Dollar Index (DXY) is rising towards the pivot which acts as a pullback resistance and could drop to the 1st support.
Pivot: 99..15
1st Support: 96.54
1st Resistance: 100.57
Risk Warning:
Trading Forex and CFDs carries a high level of risk to your capital and you should only trade with money you can afford to lose. Trading Forex and CFDs may not be suitable for all investors, so please ensure that you fully understand the risks involved and seek independent advice if necessary.
Disclaimer:
The above opinions given constitute general market commentary, and do not constitute the opinion or advice of IC Markets or any form of personal or investment advice.
Any opinions, news, research, analyses, prices, other information, or links to third-party sites contained on this website are provided on an "as-is" basis, are intended only to be informative, is not an advice nor a recommendation, nor research, or a record of our trading prices, or an offer of, or solicitation for a transaction in any financial instrument and thus should not be treated as such. The information provided does not involve any specific investment objectives, financial situation and needs of any specific person who may receive it. Please be aware, that past performance is not a reliable indicator of future performance and/or results. Past Performance or Forward-looking scenarios based upon the reasonable beliefs of the third-party provider are not a guarantee of future performance. Actual results may differ materially from those anticipated in forward-looking or past performance statements. IC Markets makes no representation or warranty and assumes no liability as to the accuracy or completeness of the information provided, nor any loss arising from any investment based on a recommendation, forecast or any information supplied by any third-party.

DXY Eyes Breakout – Dollar Strength Gaining GroundThe U.S. Dollar Index (DXY) is testing its 50-day moving average on the daily chart, with bulls eyeing a potential breakout. A move above 98.75 could confirm a short-term trend reversal and open the path for further gains.
Stronger-than-expected U.S. economic data continues to support the greenback. Recent inflation prints, job market resilience, and solid retail spending have pushed back expectations for imminent Fed rate cuts. This shift in rate outlook provides fundamental support for the dollar.
In addition, strong U.S. corporate earnings are bolstering equity markets, attracting capital flows into U.S. assets and indirectly supporting dollar demand. Rising Treasury yields, especially on the short end, also offer more attractive returns for dollar-based investments.
Geopolitical uncertainties and trade tensions in Asia and Europe are prompting a rotation into the dollar as a safe-haven currency.
Meanwhile, some emerging market currencies are under pressure, increasing global demand for dollar liquidity.
Technically, a close above 98.75 could confirm bullish momentum, with 99.80 as the next upside target. As long as macro and risk dynamics lean in the dollar’s favor, DXY may continue its rebound from recent lows.
USD Is Still Bullish! Wait For Buys!Welcome back to the Weekly Forex Forecast for the week of July 21-25th.
In this video, we will analyze the following FX market:
USD
The DXY has run bullish last week, up into an area of Supply, where the momentum hesitates now. Next week may pull back a bit... before continuing higher to the buy side liquidity.
Look out for the short term pullback to the W +FVG for a high probability move higher!
Enjoy!
May profits be upon you.
Leave any questions or comments in the comment section.
I appreciate any feedback from my viewers!
Like and/or subscribe if you want more accurate analysis.
Thank you so much!
Disclaimer:
I do not provide personal investment advice and I am not a qualified licensed investment advisor.
All information found here, including any ideas, opinions, views, predictions, forecasts, commentaries, suggestions, expressed or implied herein, are for informational, entertainment or educational purposes only and should not be construed as personal investment advice. While the information provided is believed to be accurate, it may include errors or inaccuracies.
I will not and cannot be held liable for any actions you take as a result of anything you read here.
Conduct your own due diligence, or consult a licensed financial advisor or broker before making any and all investment decisions. Any investments, trades, speculations, or decisions made on the basis of any information found on this channel, expressed or implied herein, are committed at your own risk, financial or otherwise.

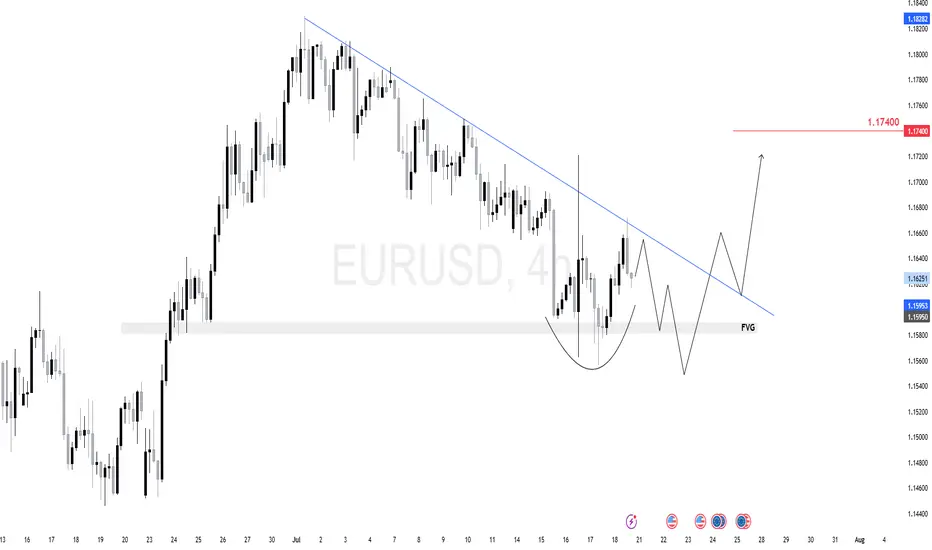
$EU (EURUSD) 4HEURUSD is forming a potential inverse head-and-shoulders just above a 4H fair value gap (FVG).
We expect one more dip toward the 1.1580–1.1595 zone to complete the right shoulder and tap demand.
From there, a breakout above the descending trendline can target 1.1740 next.
The key here is watching the reaction after the FVG test — if buyers step in strong, we ride it up.
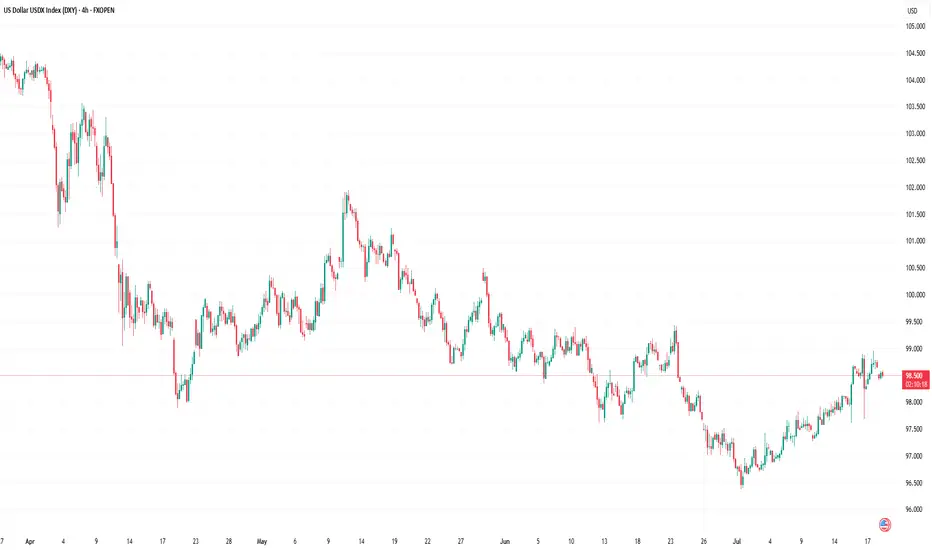
US Dollar Index (DXY) Chart AnalysisUS Dollar Index (DXY) Chart Analysis
The addition of the US Dollar Index (DXY) to FXOpen’s suite of instruments offers traders potential opportunities. This financial instrument:
→ serves as a measure of the overall strength of the US dollar;
→ is not tied to a single currency pair but reflects the value of the USD against a basket of six major global currencies, including the EUR, JPY, and GBP;
→ allows traders to capitalise on price fluctuations in the currency market;
→ is used in more advanced strategies for hedging risks in portfolios sensitive to sharp movements in the US dollar.
In today’s environment of heightened volatility, this instrument becomes particularly valuable. The active stance of US President Donald Trump — through the implementation of trade tariffs, sanctions, and unpredictable geopolitical rhetoric — gives traders even more reason to closely monitor the DXY chart.
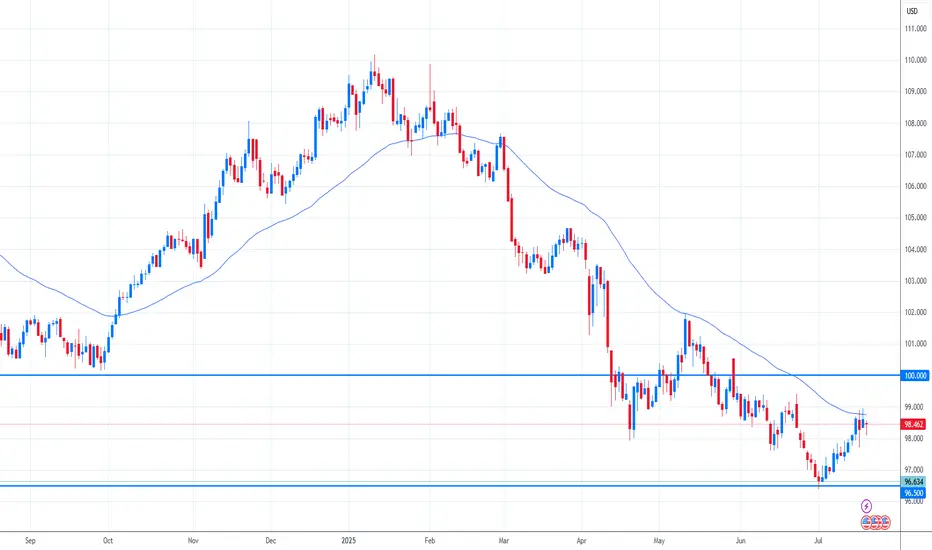
Technical Analysis of the DXY Chart
Moving averages show that the US Dollar Index displayed a predominantly bearish trend during the first half of 2025.
However, the picture shifted in July: the index began rising steadily (already up approximately +1.9% since the beginning of the month), highlighted by the blue ascending trend channel.
This suggests that the DXY may have found support following a prolonged decline, and a shift in market sentiment could be underway: after a bearish phase, a period of consolidation may follow. If this scenario plays out, we could see DXY oscillating between the 97.65 and 99.30 levels – both of which show signs of acting as support and resistance (as indicated by the arrows).
This article represents the opinion of the Companies operating under the FXOpen brand only. It is not to be construed as an offer, solicitation, or recommendation with respect to products and services provided by the Companies operating under the FXOpen brand, nor is it to be considered financial advice.
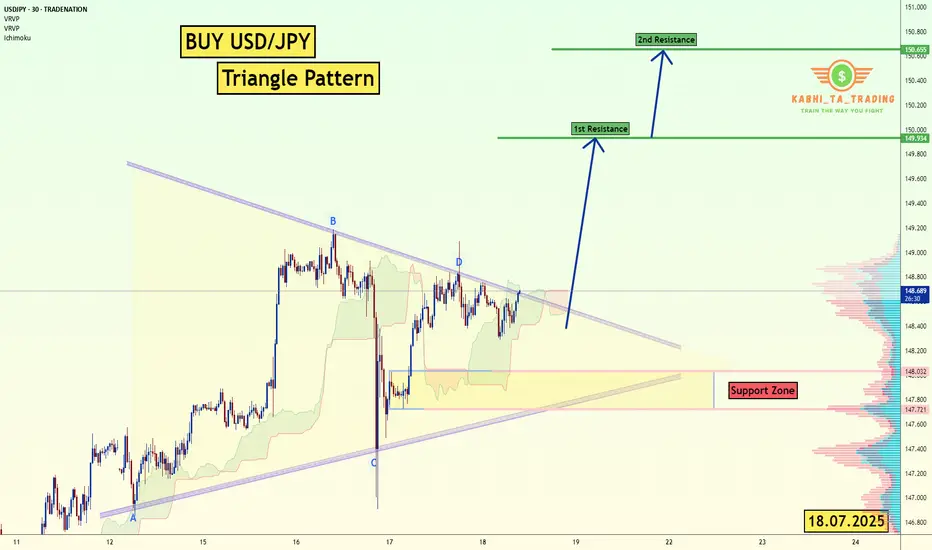
USD/JPY - Triangle Pattern (18.07.2025)The USD/JPY pair on the M30 timeframe presents a Potential Buying Opportunity due to a recent Formation of a Triangle Pattern. This suggests a shift in momentum towards the upside and a higher likelihood of further advances in the coming hours.
Possible Long Trade:
Entry: Consider Entering A Long Position around Trendline Of The Pattern.
Target Levels:
1st Resistance – 149.93
2nd Resistance – 150.65
🎁 Please hit the like button and
🎁 Leave a comment to support for My Post !
Your likes and comments are incredibly motivating and will encourage me to share more analysis with you.
Best Regards, KABHI_TA_TRADING
Thank you.
Disclosure: I am part of Trade Nation's Influencer program and receive a monthly fee for using their TradingView charts in my analysis.
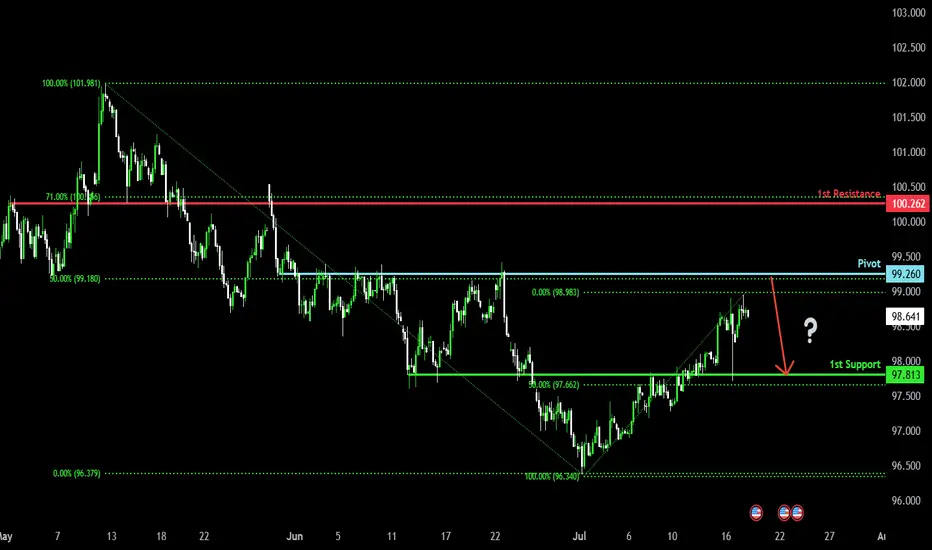
Bearish reversal?US Dollar Index (DXY) is rising towards the pivot and could reverse to the 1st support which acts as an overlap support.
Pivot: 99.26
1st Support: 97.81
1st Resistance: 100.26
Risk Warning:
Trading Forex and CFDs carries a high level of risk to your capital and you should only trade with money you can afford to lose. Trading Forex and CFDs may not be suitable for all investors, so please ensure that you fully understand the risks involved and seek independent advice if necessary.
Disclaimer:
The above opinions given constitute general market commentary, and do not constitute the opinion or advice of IC Markets or any form of personal or investment advice.
Any opinions, news, research, analyses, prices, other information, or links to third-party sites contained on this website are provided on an "as-is" basis, are intended only to be informative, is not an advice nor a recommendation, nor research, or a record of our trading prices, or an offer of, or solicitation for a transaction in any financial instrument and thus should not be treated as such. The information provided does not involve any specific investment objectives, financial situation and needs of any specific person who may receive it. Please be aware, that past performance is not a reliable indicator of future performance and/or results. Past Performance or Forward-looking scenarios based upon the reasonable beliefs of the third-party provider are not a guarantee of future performance. Actual results may differ materially from those anticipated in forward-looking or past performance statements. IC Markets makes no representation or warranty and assumes no liability as to the accuracy or completeness of the information provided, nor any loss arising from any investment based on a recommendation, forecast or any information supplied by any third-party.
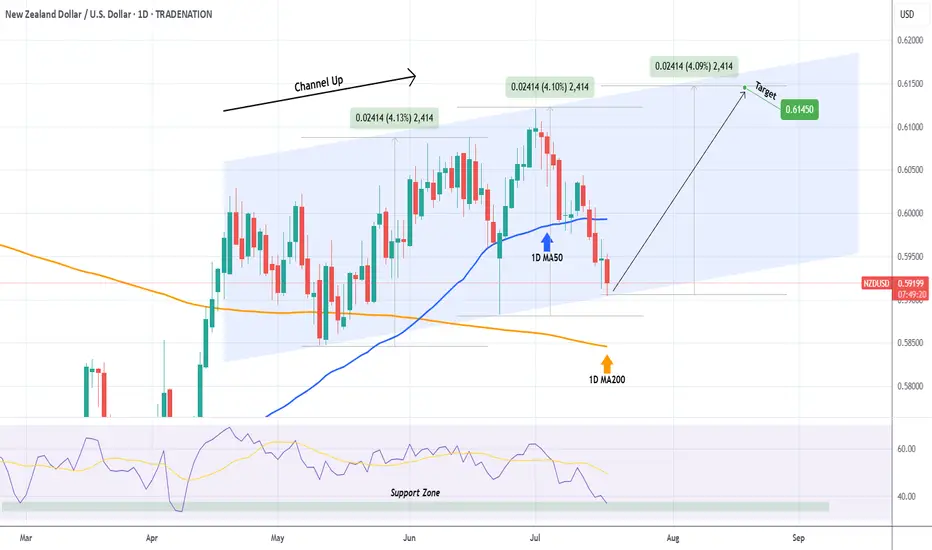
NZDUSD Excellent buy opportunity on the Channel Up bottom.Last time we looked at the NDUSD pair (May 27, see chart below), we gave a buy signal that in a few days hit our 0.60900 Target:
This time the price is trading exactly at the bottom of a 3-month Channel Up, with the 1D RSI entering its Support Zone. The true Support might be a little lower on the 1D MA200 (orange trend-line) and as long as it holds, the trend will remain bullish, but this is the first strong buy signal of the chart.
Our Target is 0.61450, which will be a +4.10% rise, exactly the same as both previous Bullish Legs.
-------------------------------------------------------------------------------
** Please LIKE 👍, FOLLOW ✅, SHARE 🙌 and COMMENT ✍ if you enjoy this idea! Also share your ideas and charts in the comments section below! This is best way to keep it relevant, support us, keep the content here free and allow the idea to reach as many people as possible. **
-------------------------------------------------------------------------------
Disclosure: I am part of Trade Nation's Influencer program and receive a monthly fee for using their TradingView charts in my analysis.
💸💸💸💸💸💸
👇 👇 👇 👇 👇 👇
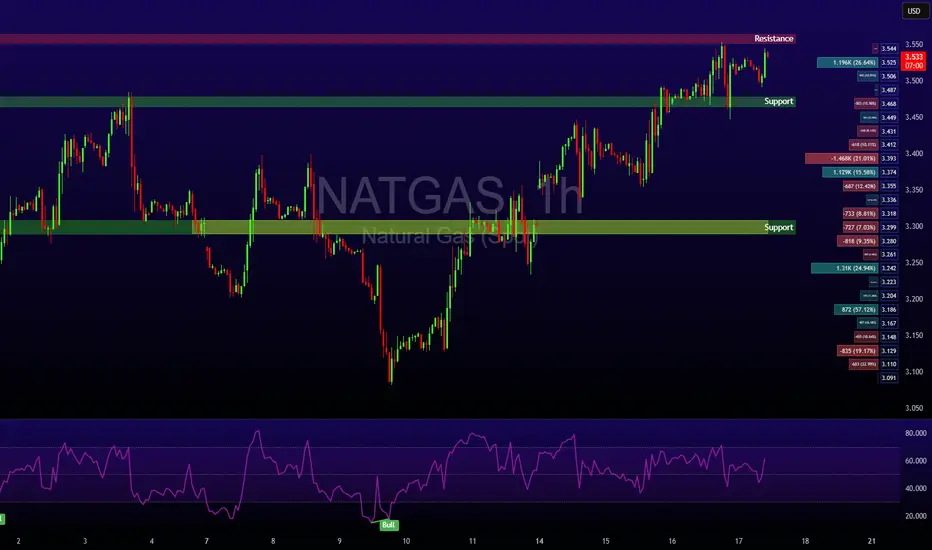
Heatwave Fuels Breakout as Fundamentals AlignNatural Gas has reclaimed the spotlight with a sharp move above $3.56, breaking through a key resistance level as a heatwave grips large parts of the United States. With above-average temperatures forecast to persist into late July, demand for cooling remains elevated, significantly boosting power consumption across the board.
Supply remains tight despite elevated production levels. Liquefied Natural Gas (LNG) feedgas volumes are rising as export demand holds strong, keeping domestic stockpiles in check. While some temporary relief in demand could arrive next week, the broader outlook remains bullish. Weather models suggest persistent heat, and traders are increasingly positioning for sustained tightness in the balance of supply and demand.
Technical Setup:
• Key level breached: $3.48 (100-day EMA) decisively broken
• Current price zone: Approaching $3.57, the next major pivot
• Momentum: If bulls secure a weekly close above $3.57, the market could enter a longer-term uptrend with $3.65 and $3.80 in sight.
Takeaway: Natural gas traders should monitor weather patterns and storage data closely. Sustained heat could keep the rally intact, but short-term pullbacks may offer entry points for trend-followers.
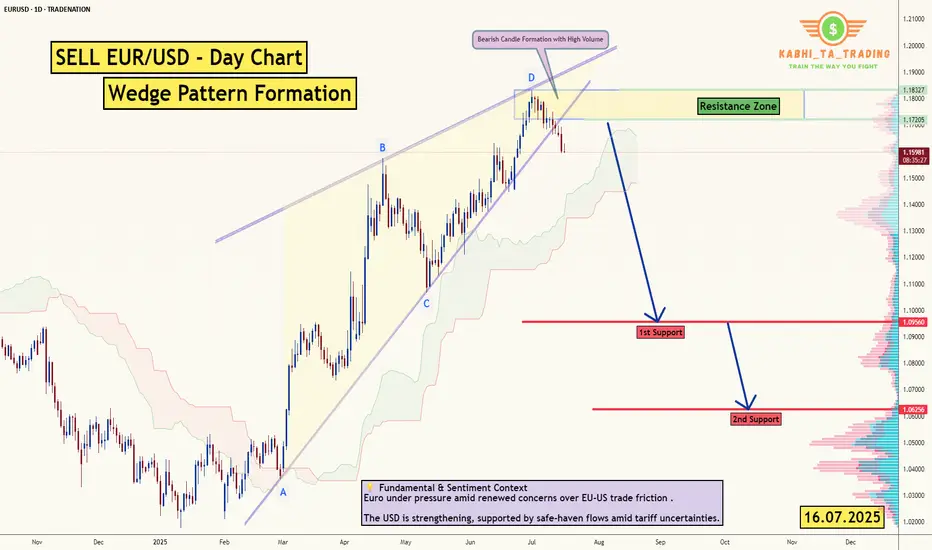
EUR/USD - Daily Chart (Wedge Breakout) (16.07.2025) The EUR/USD Pair on the D1 timeframe presents a Potential Selling Opportunity due to a recent Formation of a Wedge Pattern. This suggests a shift in momentum towards the downside in the coming Days.
Possible Short Trade:
Entry: Consider Entering A Short Position around Trendline Of The Pattern.
Target Levels:
1st Support – 1.0956
2nd Support – 1.0625
💡 Fundamental & Sentiment Context
Euro under pressure amid renewed concerns over EU‑US trade friction .
The USD is strengthening, supported by safe‑haven flows amid tariff uncertainties.
🎁 Please hit the like button and
🎁 Leave a comment to support for My Post !
Your likes and comments are incredibly motivating and will encourage me to share more analysis with you.
Best Regards, KABHI_TA_TRADING
Thank you.
Disclosure: I am part of Trade Nation's Influencer program and receive a monthly fee for using their TradingView charts in my analysis.
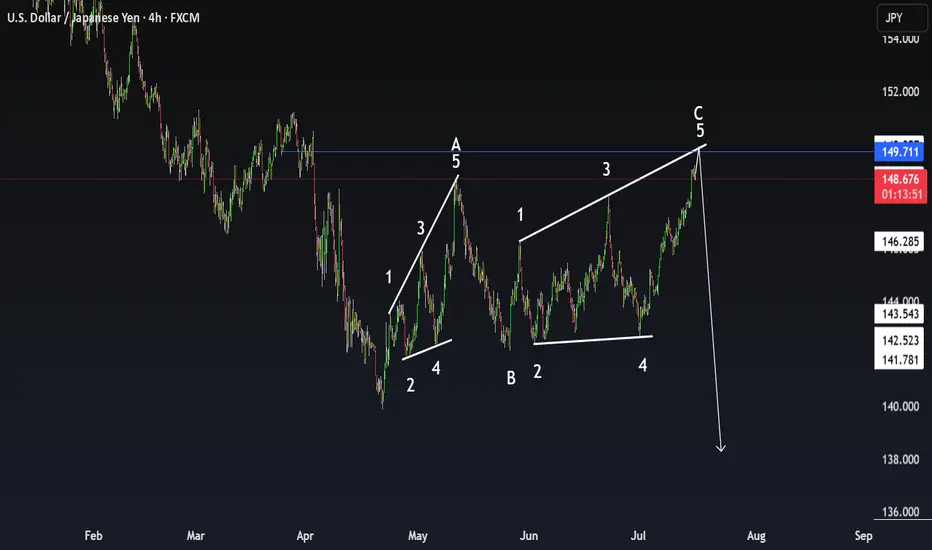
USDJPY Expanding Diagonal – Final Wave 5 at 149.71?FX:USDJPY FX_IDC:USDJPY
USD/JPY – 4H Chart – Elliott Wave Analysis
📅 July 16, 2025 | By: Trwin
🧠 Pattern Highlighted: Expanding Ending Diagonal (Wave C)
The current move from wave B to C appears to form a classic expanding ending diagonal, suggesting trend exhaustion near the key resistance zone of 149.71.
🔎 Key Features:
🔹 All 5 waves are structured as zigzags – a textbook ending diagonal.
🔹 Wave 3 > Wave 1, and Wave 5 > Wave 3 → confirms expanding structure
🔹 Wave 2 & 4 retraced deeper than typical impulses (common in diagonals)
🔹 Wedges are diverging, forming an expanding wedge.
🔹 Price is nearing a throw-over, hinting at final exhaustion.
💬 What do you think? Will USDJPY reverse hard from this expanding wedge or break higher into a blow-off top?
⚠️ Disclaimer:
This analysis is for educational purposes only and does not constitute financial advice. Trading carries risk, and past performance is not indicative of future results. Always do your own research and consult with a licensed financial advisor before making any trading decisions.
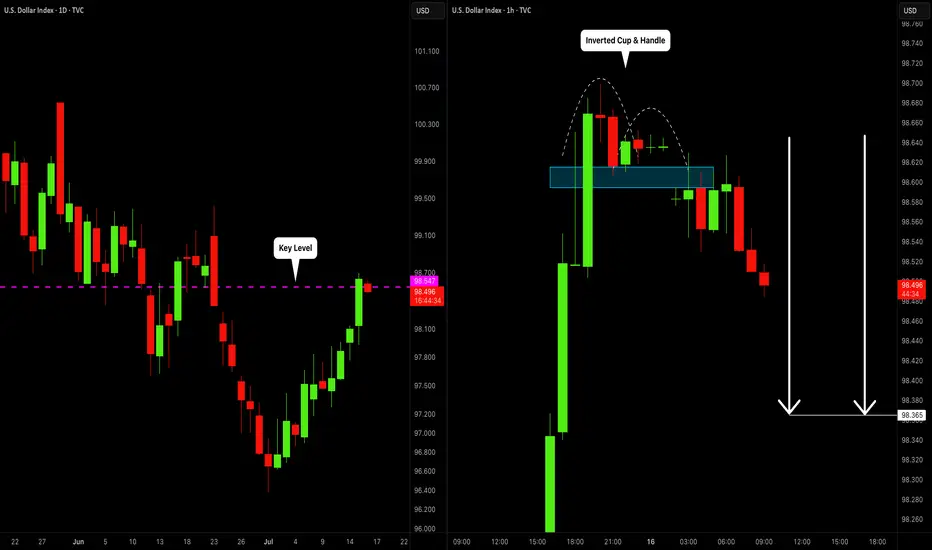
DOLLAR INDEX (DXY): Bearish Move From Key Level
I think that Dollar Index may drop from a key daily horizontal resistance level.
As a confirmation, I spotted an inverted cup & handle pattern on an hourly time frame
and a bearish violation of its neckline.
The market will most likely continue falling at least to 98.36
❤️Please, support my work with like, thank you!❤️
US30Y Bullish ideaThis is a potential idea of the 30 year bond yield potentially having movement to the upside. We have already reached into a daily volume imbalance and weekly volume imbalance. We also have a monthly order block that is acting as support combined with our volume imbalance levels. We also have relative strength with the US30Y against the US10Y and US5Y. Could be a potential idea to look for bullish ideas with the the fact that we are in a potential point were we could have a Quarterly shift.
*Targeting
A move to the upside were we have buyside liquidity and the 4H fair value gap.

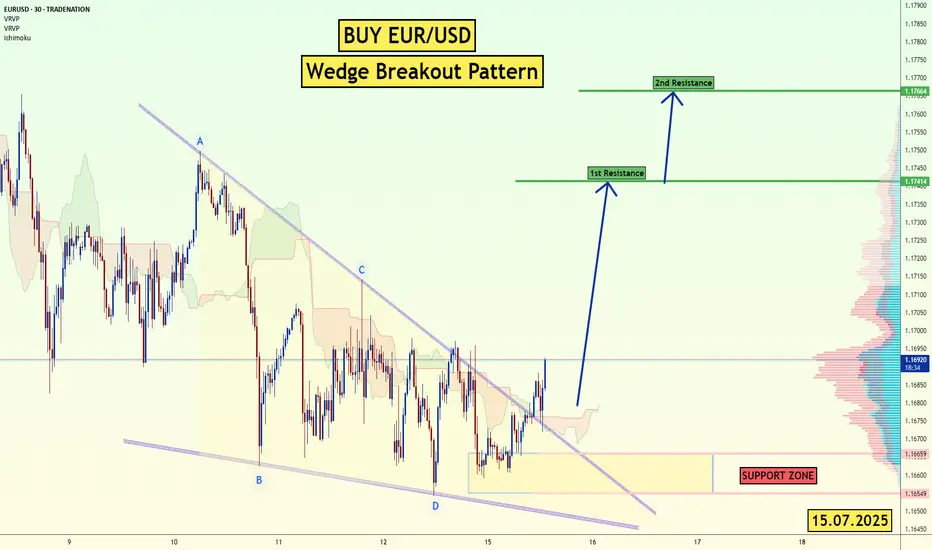
EUR/USD - Wedge Breakout (CPI- Today) 15.07.2025 The EUR/USD pair on the M30 timeframe presents a Potential Buying Opportunity due to a recent Formation of a Wedge Breakout Pattern. This suggests a shift in momentum towards the upside and a higher likelihood of further advances in the coming hours.
Possible Long Trade:
Entry: Consider Entering A Long Position around Trendline Of The Pattern.
Target Levels:
1st Resistance – 1.1741
2nd Resistance – 1.1766
🎁 Please hit the like button and
🎁 Leave a comment to support for My Post !
Your likes and comments are incredibly motivating and will encourage me to share more analysis with you.
Best Regards, KABHI_TA_TRADING
Thank you.
Disclosure: I am part of Trade Nation's Influencer program and receive a monthly fee for using their TradingView charts in my analysis.
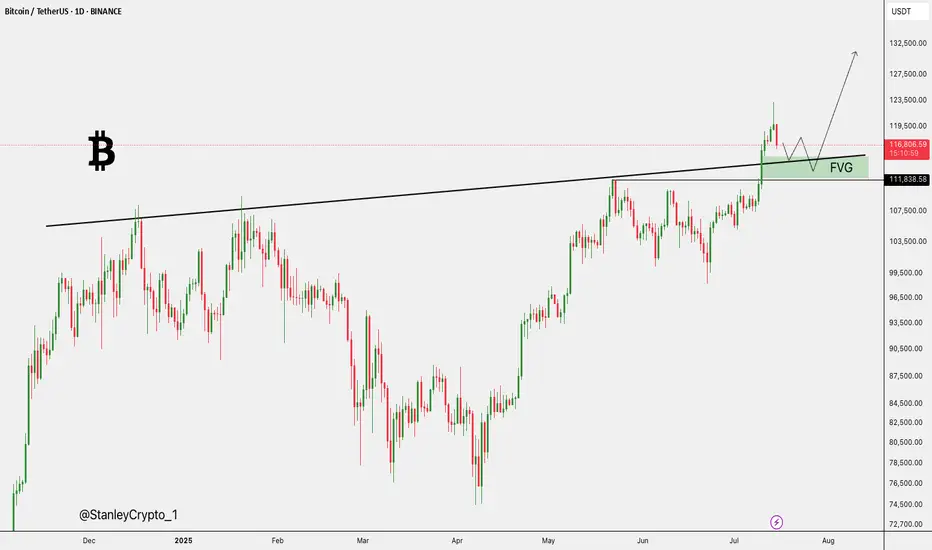
$BTC All Eyes on the FVG Zone. CRYPTOCAP:BTC broke out above key resistance and is now retesting the FVG zone near $112K–$115K.
Holding this level could trigger a fresh rally toward $127K–$132K.
DYRO, NFA
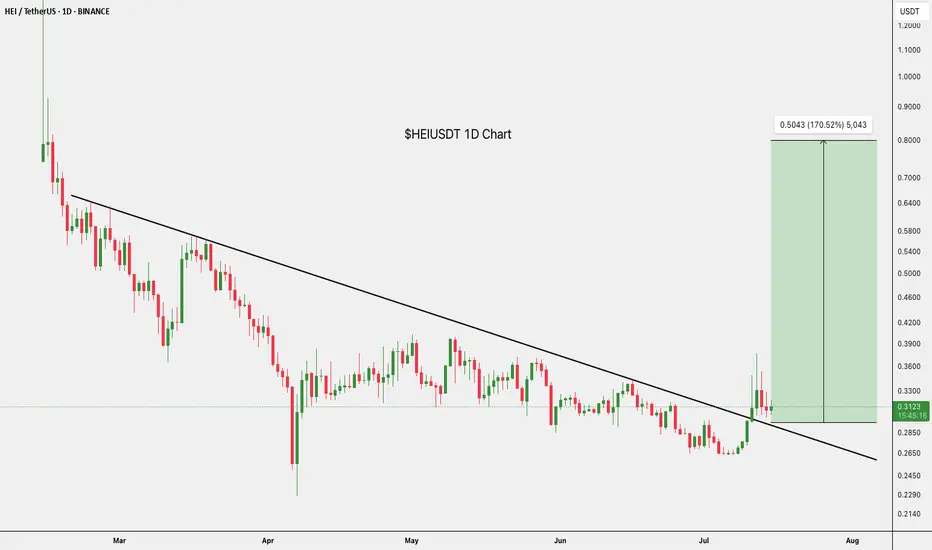
$HEIUSDT Bullish Setup.$HEI/USDT has broken out of a long-term downtrend on the daily chart.
After a successful retest, it’s showing bullish momentum with a potential 170% upside toward the $0.8000 zone.
DYOR, NFA
$NOT Trade Setup 4H Chart. GETTEX:NOT Trade Setup (4H)
- Long Entry: CMP
- Stop Loss: 0.001965
- TP1: 0.002272, TP2: 0.002453, TP3: 0.002675
Retest of trendline support.
Low leverage.
DYOR. NFA.

USD weakness has potential shorts on USDCHFUSD continues to show overall weakness ahead of CPI figures later today
Retests of the breakdown area on USDCHF at 0.8033-0.8048 can act as resistance on any retests
Stops should be above 0.8058
Targets can be back towards 0.7990

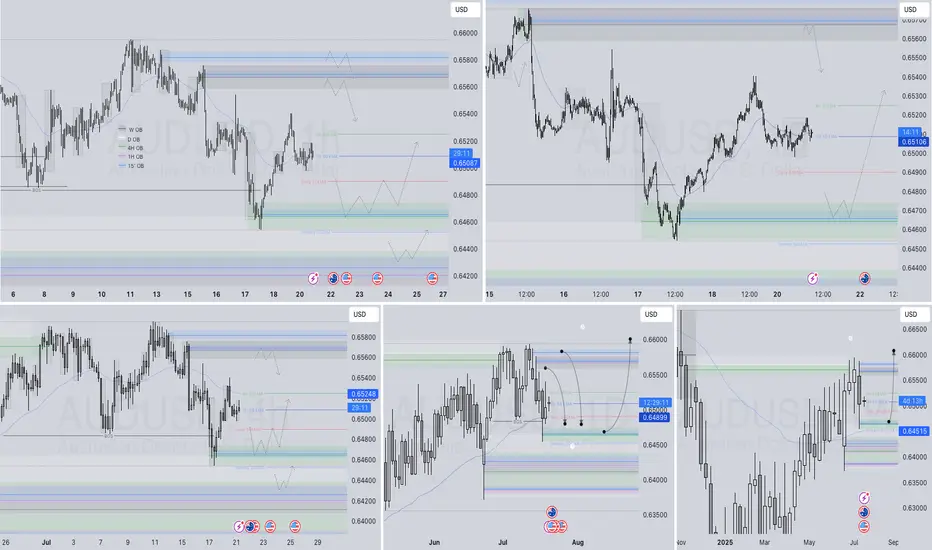
Market Watch UPDATES! FOREX Major PairsWelcome to the Market Watch Updates for Monday, July 14th.
In this video, we will give the forecast updates for the following markets:
USD Index, EURUSD, GBPUSD, AUDUSD, NZDUSD, USDCAD, USDCHF and USDJPY.
Enjoy!
May profits be upon you.
Leave any questions or comments in the comment section.
I appreciate any feedback from my viewers!
Like and/or subscribe if you want more accurate analysis.
Thank you so much!
Disclaimer:
I do not provide personal investment advice and I am not a qualified licensed investment advisor.
All information found here, including any ideas, opinions, views, predictions, forecasts, commentaries, suggestions, expressed or implied herein, are for informational, entertainment or educational purposes only and should not be construed as personal investment advice. While the information provided is believed to be accurate, it may include errors or inaccuracies.
I will not and cannot be held liable for any actions you take as a result of anything you read here.
Conduct your own due diligence, or consult a licensed financial advisor or broker before making any and all investment decisions. Any investments, trades, speculations, or decisions made on the basis of any information found on this channel, expressed or implied herein, are committed at your own risk, financial or otherwise.

Potential bullish rise?US Dollar Index (DXY) has reacted off the pivot and could rise to the 50% Fibonacci resistance.
Pivot: 97.81
1st Support: 97.19
1st Resistance: 99.25
Risk Warning:
Trading Forex and CFDs carries a high level of risk to your capital and you should only trade with money you can afford to lose. Trading Forex and CFDs may not be suitable for all investors, so please ensure that you fully understand the risks involved and seek independent advice if necessary.
Disclaimer:
The above opinions given constitute general market commentary, and do not constitute the opinion or advice of IC Markets or any form of personal or investment advice.
Any opinions, news, research, analyses, prices, other information, or links to third-party sites contained on this website are provided on an "as-is" basis, are intended only to be informative, is not an advice nor a recommendation, nor research, or a record of our trading prices, or an offer of, or solicitation for a transaction in any financial instrument and thus should not be treated as such. The information provided does not involve any specific investment objectives, financial situation and needs of any specific person who may receive it. Please be aware, that past performance is not a reliable indicator of future performance and/or results. Past Performance or Forward-looking scenarios based upon the reasonable beliefs of the third-party provider are not a guarantee of future performance. Actual results may differ materially from those anticipated in forward-looking or past performance statements. IC Markets makes no representation or warranty and assumes no liability as to the accuracy or completeness of the information provided, nor any loss arising from any investment based on a recommendation, forecast or any information supplied by any third-party.

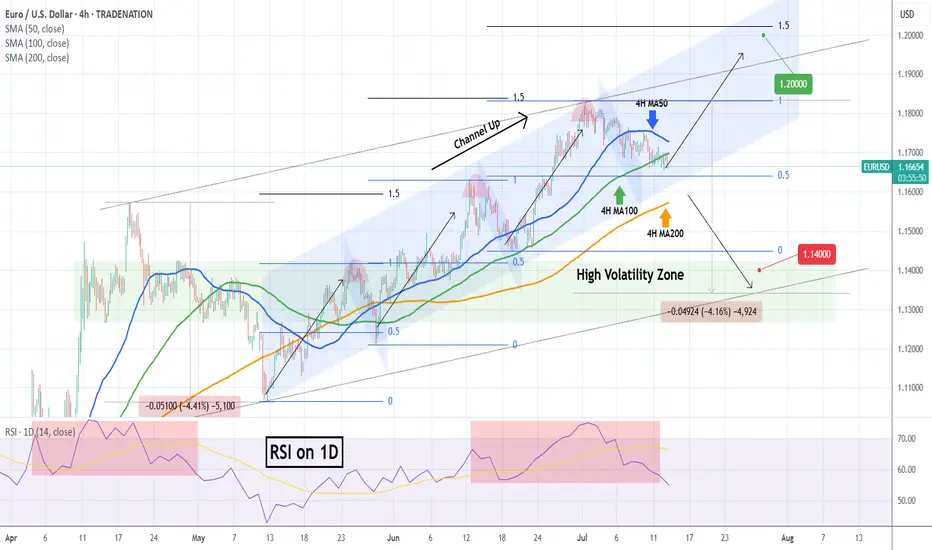
EURUSD The 4H MA200 distinguishes bullish from bearish.The EURUSD pair has been trading within a (blue) 2-month Channel Up since the May 12 Low and it just broke below its 4H MA100 (green trend-line). The previous two Bearish Legs of this pattern bottomed (made a Higher Low) on or just above the 0.5 Fibonacci retracement level.
As a result, the price is very close to the most optimal buy level of this pattern and as long as it holds, we expect to start the new Bullish Leg and target the 1.5 Fibonacci extension (1.20000 our Target just below), which is in line with the previous two Bullish Legs.
If however the 4H MA200 (orange trend-line) breaks, we will take the loss on that long and go short as technically the price should seek the bottom of the (dotted) wider Channel Up. Our Target on that occasion will be 1.14000, right at the top of the High Volatility Zone.
-------------------------------------------------------------------------------
** Please LIKE 👍, FOLLOW ✅, SHARE 🙌 and COMMENT ✍ if you enjoy this idea! Also share your ideas and charts in the comments section below! This is best way to keep it relevant, support us, keep the content here free and allow the idea to reach as many people as possible. **
-------------------------------------------------------------------------------
Disclosure: I am part of Trade Nation's Influencer program and receive a monthly fee for using their TradingView charts in my analysis.
💸💸💸💸💸💸
👇 👇 👇 👇 👇 👇
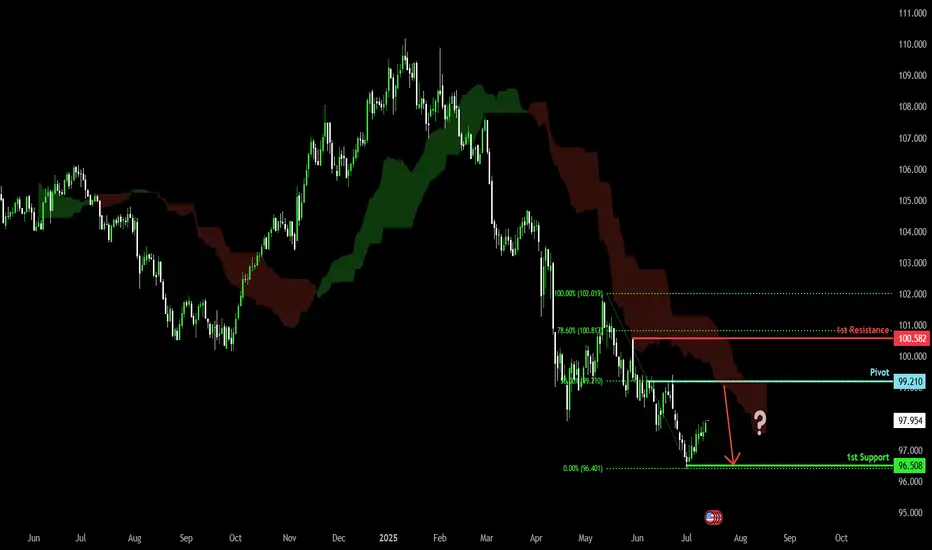
Bearish continuation?US Dollar Index (DXY) is risng towards the pivot which is a pullback resistance and could drop to the 1st support.
Pivot: 99.21
1st Support: 96.50
1st Resistance: 100.58
Risk Warning:
Trading Forex and CFDs carries a high level of risk to your capital and you should only trade with money you can afford to lose. Trading Forex and CFDs may not be suitable for all investors, so please ensure that you fully understand the risks involved and seek independent advice if necessary.
Disclaimer:
The above opinions given constitute general market commentary, and do not constitute the opinion or advice of IC Markets or any form of personal or investment advice.
Any opinions, news, research, analyses, prices, other information, or links to third-party sites contained on this website are provided on an "as-is" basis, are intended only to be informative, is not an advice nor a recommendation, nor research, or a record of our trading prices, or an offer of, or solicitation for a transaction in any financial instrument and thus should not be treated as such. The information provided does not involve any specific investment objectives, financial situation and needs of any specific person who may receive it. Please be aware, that past performance is not a reliable indicator of future performance and/or results. Past Performance or Forward-looking scenarios based upon the reasonable beliefs of the third-party provider are not a guarantee of future performance. Actual results may differ materially from those anticipated in forward-looking or past performance statements. IC Markets makes no representation or warranty and assumes no liability as to the accuracy or completeness of the information provided, nor any loss arising from any investment based on a recommendation, forecast or any information supplied by any third-party.