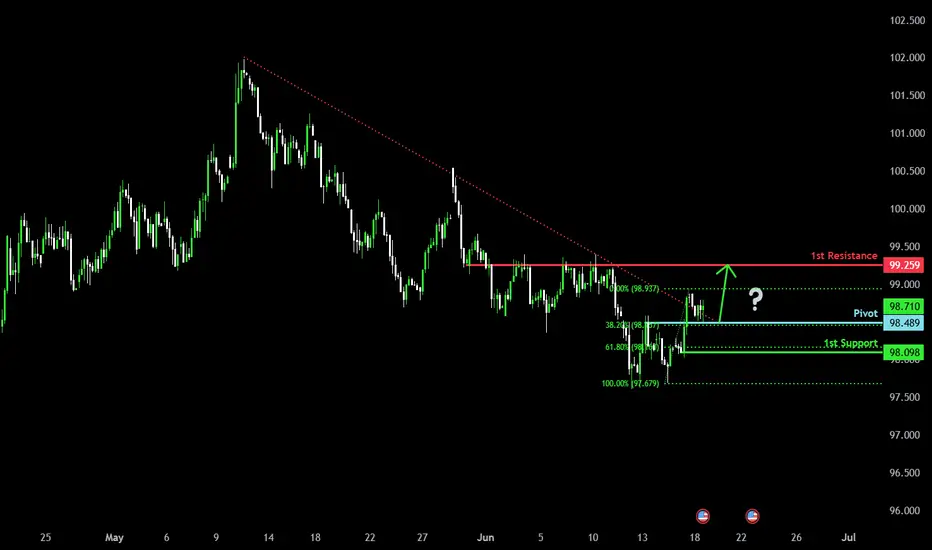
Bullish bounce?US Dollar Index (DXY) is reacting off the pivot and could rise to the 1st resistance.
Pivot: 98.48
1st Support: 98.09
1st Resistance: 99.25
Risk Warning:
Trading Forex and CFDs carries a high level of risk to your capital and you should only trade with money you can afford to lose. Trading Forex and CFDs may not be suitable for all investors, so please ensure that you fully understand the risks involved and seek independent advice if necessary.
Disclaimer:
The above opinions given constitute general market commentary, and do not constitute the opinion or advice of IC Markets or any form of personal or investment advice.
Any opinions, news, research, analyses, prices, other information, or links to third-party sites contained on this website are provided on an "as-is" basis, are intended only to be informative, is not an advice nor a recommendation, nor research, or a record of our trading prices, or an offer of, or solicitation for a transaction in any financial instrument and thus should not be treated as such. The information provided does not involve any specific investment objectives, financial situation and needs of any specific person who may receive it. Please be aware, that past performance is not a reliable indicator of future performance and/or results. Past Performance or Forward-looking scenarios based upon the reasonable beliefs of the third-party provider are not a guarantee of future performance. Actual results may differ materially from those anticipated in forward-looking or past performance statements. IC Markets makes no representation or warranty and assumes no liability as to the accuracy or completeness of the information provided, nor any loss arising from any investment based on a recommendation, forecast or any information supplied by any third-party.
DJ FXCM Index
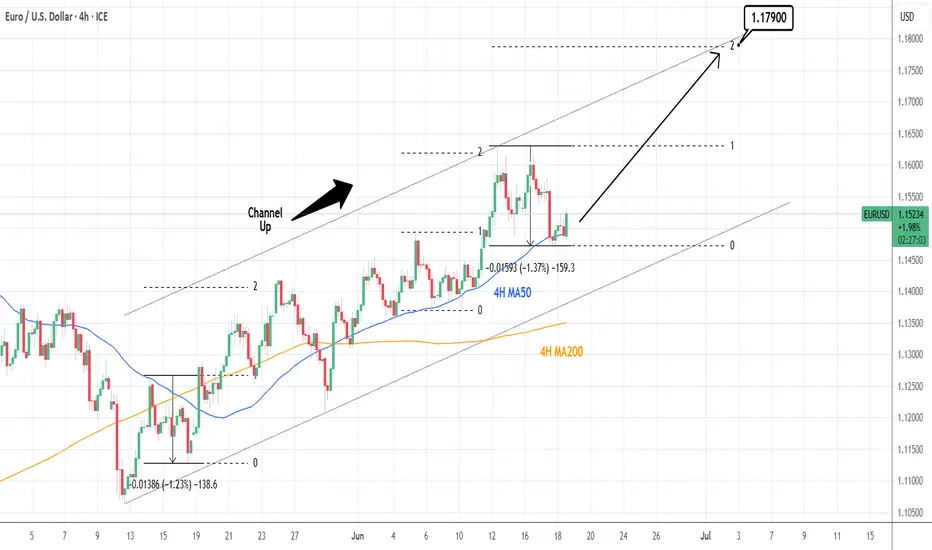
EURUSD: 4H MA50 may start aggressive rally to 1.17900.EURUSD is bullish on its 1D technical outlook (RSI = 58.513, MACD = 0.005, ADX = 36.044), trading inside a Channel Up for the past 5 weeks. Yesterday it made contact with its 4H MA50, which is the most common level of support inside this pattern. Based on that, we find highly probable for the pair to start the new bullish wave. A HH on the 2.0 Fibonacci extension has been a common feature of this Channel Up, hence we are turning bullish here with TP = 1.17900.
## If you like our free content follow our profile to get more daily ideas. ##
## Comments and likes are greatly appreciated. ##
DXY June 18 2025We believe that Trump's tariffs and the downward trend in U.S. interest rates will continue to put pressure on the dollar, leading to further depreciation.
Monthly Target: 95.445-101.977

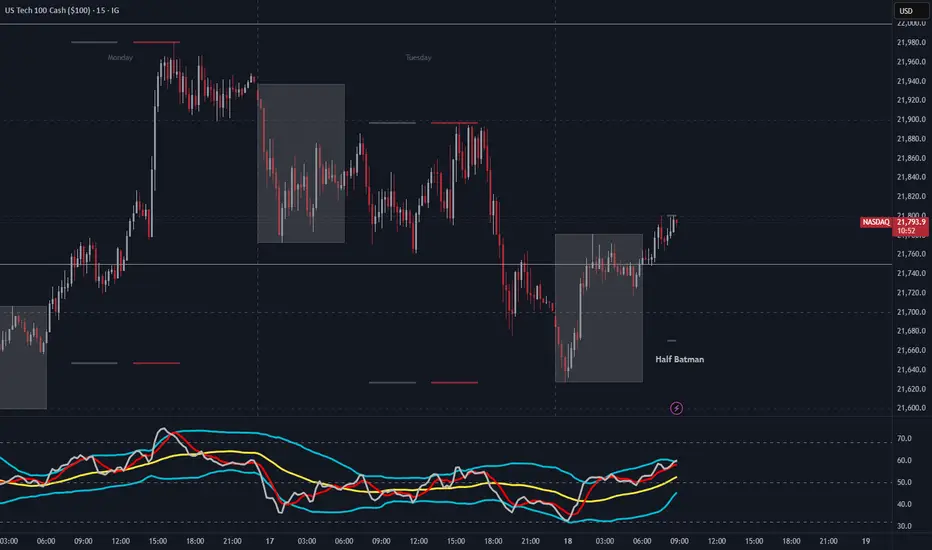
NAS100 (US100) Mid Week Reversal - Bullish Order FlowA Half Batman presents itself during the Asian session and seems to be ready for LDN opening. This Peak Formation could be seen as the reset, to turn NAS100 bullish and ready to break the structure high.
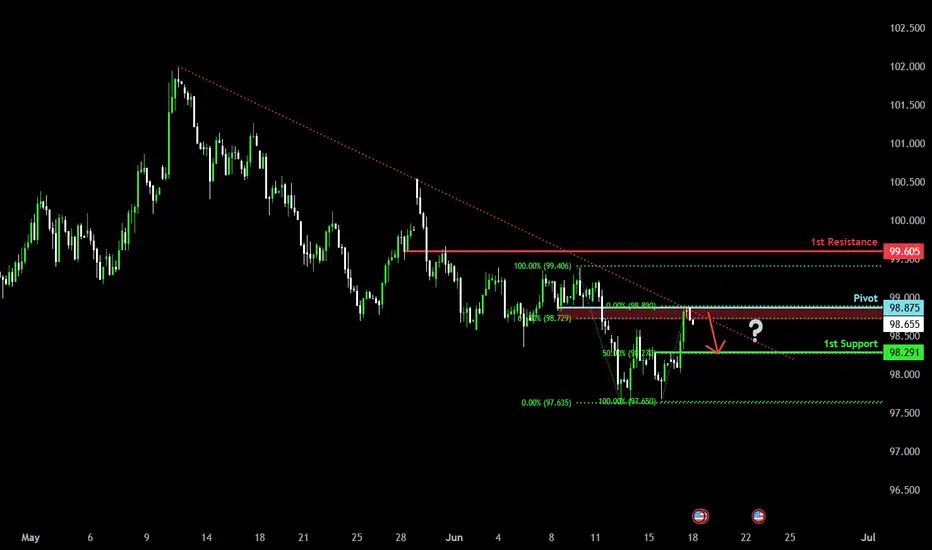
Bearish reversal?US Dollar Index (DXY) has reacted off the pivot and could drop to the 1st support.
Pivot: 98.89
1st Support: 98.29
1st Resistance: 99.60
Risk Warning:
Trading Forex and CFDs carries a high level of risk to your capital and you should only trade with money you can afford to lose. Trading Forex and CFDs may not be suitable for all investors, so please ensure that you fully understand the risks involved and seek independent advice if necessary.
Disclaimer:
The above opinions given constitute general market commentary, and do not constitute the opinion or advice of IC Markets or any form of personal or investment advice.
Any opinions, news, research, analyses, prices, other information, or links to third-party sites contained on this website are provided on an "as-is" basis, are intended only to be informative, is not an advice nor a recommendation, nor research, or a record of our trading prices, or an offer of, or solicitation for a transaction in any financial instrument and thus should not be treated as such. The information provided does not involve any specific investment objectives, financial situation and needs of any specific person who may receive it. Please be aware, that past performance is not a reliable indicator of future performance and/or results. Past Performance or Forward-looking scenarios based upon the reasonable beliefs of the third-party provider are not a guarantee of future performance. Actual results may differ materially from those anticipated in forward-looking or past performance statements. IC Markets makes no representation or warranty and assumes no liability as to the accuracy or completeness of the information provided, nor any loss arising from any investment based on a recommendation, forecast or any information supplied by any third-party.
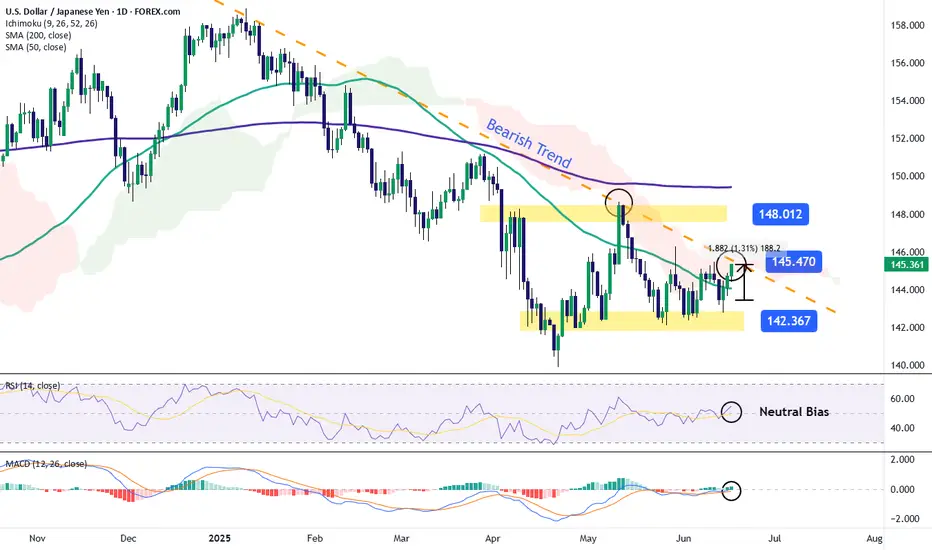
USD/JPY: Yen Continues to Lose Ground Against the U.S. DollarOver the past three trading sessions, USD/JPY has risen by more than 1%, favoring the U.S. dollar, as the yen continues to weaken steadily. The bullish bias has persisted, supported by a rebound in dollar strength. The DXY index, which measures the dollar's performance against other major currencies, has been climbing in the short term and is once again approaching the 100-point mark, signaling growing confidence in the dollar’s movements. If this dollar strength persists, buying pressure in USD/JPY may become increasingly dominant.
Consistent Downtrend
Since early January of this year, USD/JPY has been consolidating consistent downward movements, shaping a solid bearish trend that has lasted through recent months. Currently, price action is once again testing a resistance zone, aligned with the downtrend line, but buying momentum has not been strong enough to break through. As a result, the dominant trend remains bearish, unless a significant bullish breakout manages to disrupt the pattern.
Neutrality in Indicators
At the moment, the RSI line is oscillating near the 50 level, while the MACD histogram remains close to the zero line. These patterns suggest a state of equilibrium between buying and selling pressure, which has led to a series of neutral movements. As long as both indicators remain in this range, it reflects a lack of dominance by either market force in the short term.
Key Levels to Watch:
145.470 – Short-Term Barrier: A level where potential bearish corrections could emerge, especially as price remains near the downtrend line under conditions of neutrality.
148.012 – Major Resistance: This corresponds to the recent multi-month highs. Sustained buying above this level could threaten the prevailing bearish trend.
142.367 – Critical Support: A level aligned with the lowest prices of recent months, which has been repeatedly respected, increasing its strength in the short term. A breakdown here could trigger a renewed bearish bias, reinforcing the ongoing downward trend.
Written by Julian Pineda, CFA – Market Analyst
Follow him at: @julianpineda25
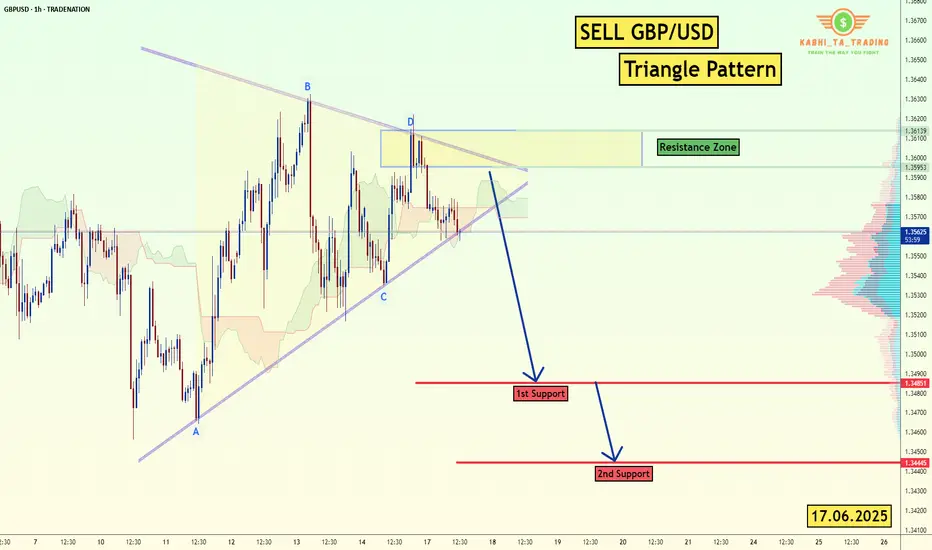
GBP/USD - H1-Triangle Breakout (17.06.2025)The GBP/USD Pair on the H1 timeframe presents a Potential Selling Opportunity due to a recent Formation of a Triangle Breakout Pattern. This suggests a shift in momentum towards the downside in the coming hours.
Possible Short Trade:
Entry: Consider Entering A Short Position around Trendline Of The Pattern.
Target Levels:
1st Support – 1.3485
2nd Support – 1.3444
🎁 Please hit the like button and
🎁 Leave a comment to support for My Post !
Your likes and comments are incredibly motivating and will encourage me to share more analysis with you.
Best Regards, KABHI_TA_TRADING
Thank you.
Disclosure: I am part of Trade Nation's Influencer program and receive a monthly fee for using their TradingView charts in my analysis.
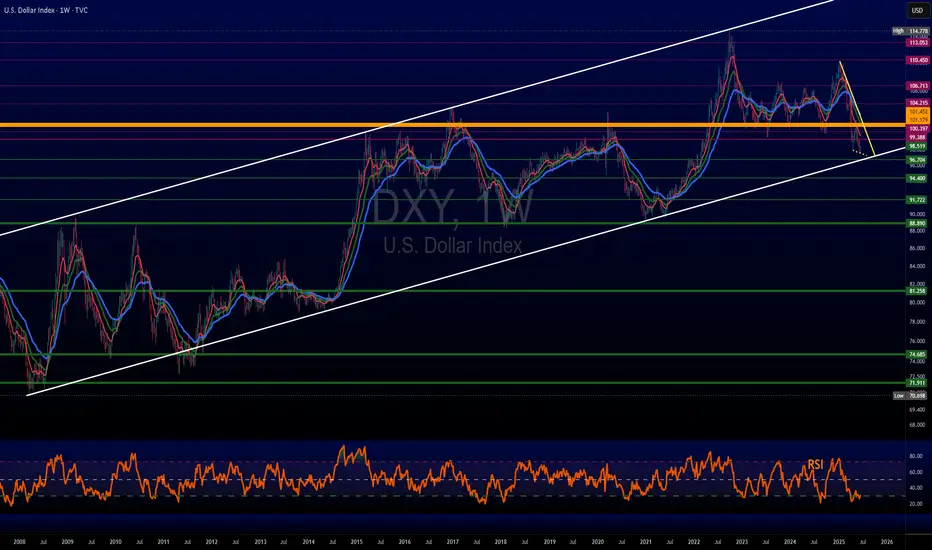
$DXY Dollar stays weak but is it bottommed?Have not many ANY trades based on the US Dollar. Have not been convinced in either way, yet.
TVC:DXY has been weaker lately but not by much. Well, at least compared to its previous low.
However, LONGER TERM we see it's biz as usual.
It is currently fairly oversold on the weekly chart & could be primed to change direction.
Is gold (XAUUSD) building up for a possible push higher?With the economic data sets, which we are getting and will be getting this week, all eyes on gold, and its possible move to the all-time high. Apart from this, the geopolitical tensions are also something that is fueling gold demand. But what are the technical saying? Let's take a look.
TVC:GOLD
FX_IDC:XAUUSD
Let us know what you think in the comments below.
Thank you.
77.3% of retail investor accounts lose money when trading CFDs with this provider. You should consider whether you understand how CFDs work and whether you can afford to take the high risk of losing your money. Past performance is not necessarily indicative of future results. The value of investments may fall as well as rise and the investor may not get back the amount initially invested. This content is not intended for nor applicable to residents of the UK. Cryptocurrency CFDs and spread bets are restricted in the UK for all retail clients.

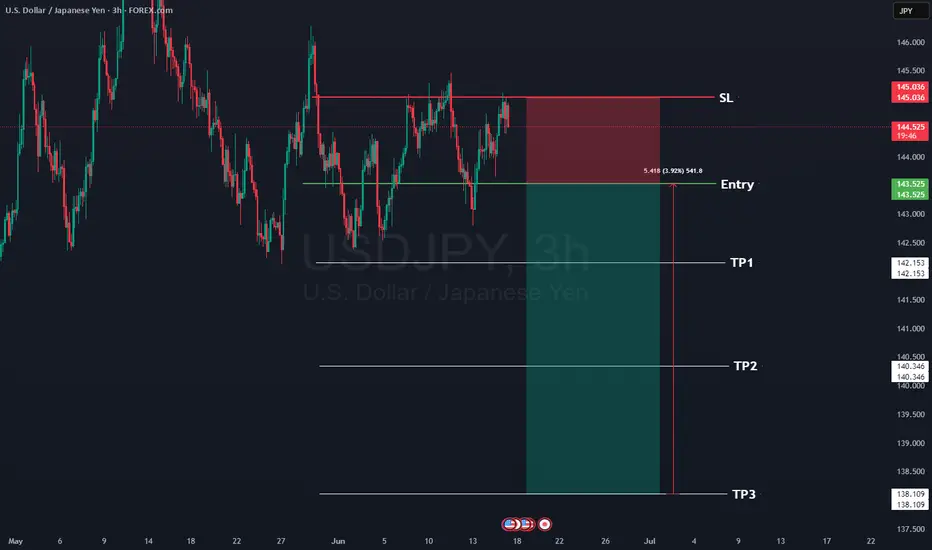
USDJPY Swing trade Signal for the Sell Once in a while we like to give a free signal. So here is one of the many trades we will have running for our subscribers.
Wait for the 1 hour candle to close below the Entry, and then a response to our entry, then you can sell.
Remember the rules, and remember your risk/reward
USDJPY Sell
🦇Entry: 143.525
⚠️Sl: 145.036
✔️TP1: 142.153
✔️TP2: 140.346
✔️TP3: 138.109
Happy trading. Any problems feel free to contact me, as over 10 years as a professional trader I can assure you there is no such thing as a stupid question.
Best,
Sarah
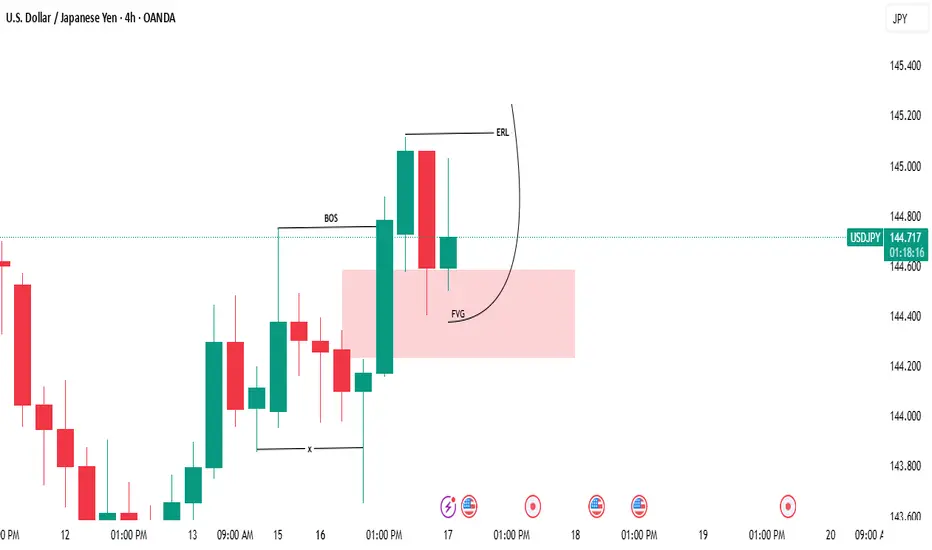
Traders, it's time to pay close attention! 🚨 USDJPY 4H Setup Alert – High-Probability Play Unfolding! 🚨
Traders, it's time to pay close attention! 🧠📊
The USDJPY pair has just perfectly tapped into a key bullish Fair Value Gap (FVG) on the 4-hour chart — a classic move in the smart money playbook. What’s more? We've just seen a clean sweep of internal range liquidity (IRL) — a textbook liquidity grab that signals potential accumulation by larger players. 💥💼
This is not just noise — it's a significant signal. The market structure is hinting at a possible shift in momentum, and bullish pressure is building. The trap has been set, the weak hands have been shaken out, and smart money may be preparing for a strong upward push. 📈🐂
🔮 What’s the next move?
All eyes are now on the external range liquidity (ERL) — a prime liquidity pool sitting above current price levels. If price accelerates toward it, this zone could act as the magnet and the catalyst for the next explosive move upward. 🚀
🔥 Key Points to Watch:
Bullish FVG reaction ✅
IRL liquidity swept ✅
Bullish market structure forming 🏗️
ERL liquidity resting overhead — potential target 🎯
Volume profile & order flow confirming accumulation? 👀
⚠️ Stay alert and don’t chase — let the setup come to you.
Smart money might already be stepping in, and if this momentum follows through, we could be witnessing the beginning of a strong leg up.
Mark your charts and monitor closely — opportunity is knocking. 📍🕵️♂️
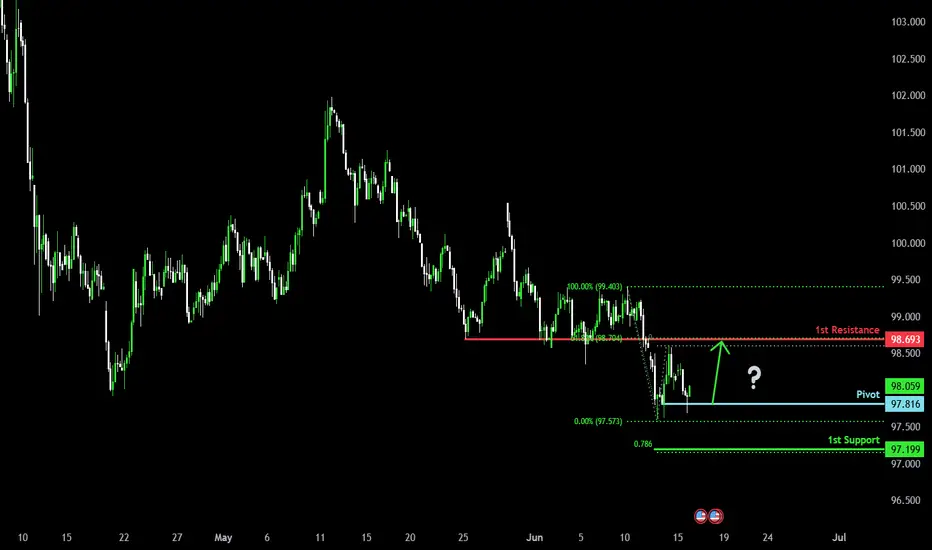
Bullish bounce?USD Dollar Index (DXY) has bounced off the pivot and could rise to the 1st resistance.
Pivot: 97.81
1st Support: 97.19
1st Resistance: 98.69
Risk Warning:
Trading Forex and CFDs carries a high level of risk to your capital and you should only trade with money you can afford to lose. Trading Forex and CFDs may not be suitable for all investors, so please ensure that you fully understand the risks involved and seek independent advice if necessary.
Disclaimer:
The above opinions given constitute general market commentary, and do not constitute the opinion or advice of IC Markets or any form of personal or investment advice.
Any opinions, news, research, analyses, prices, other information, or links to third-party sites contained on this website are provided on an "as-is" basis, are intended only to be informative, is not an advice nor a recommendation, nor research, or a record of our trading prices, or an offer of, or solicitation for a transaction in any financial instrument and thus should not be treated as such. The information provided does not involve any specific investment objectives, financial situation and needs of any specific person who may receive it. Please be aware, that past performance is not a reliable indicator of future performance and/or results. Past Performance or Forward-looking scenarios based upon the reasonable beliefs of the third-party provider are not a guarantee of future performance. Actual results may differ materially from those anticipated in forward-looking or past performance statements. IC Markets makes no representation or warranty and assumes no liability as to the accuracy or completeness of the information provided, nor any loss arising from any investment based on a recommendation, forecast or any information supplied by any third-party.
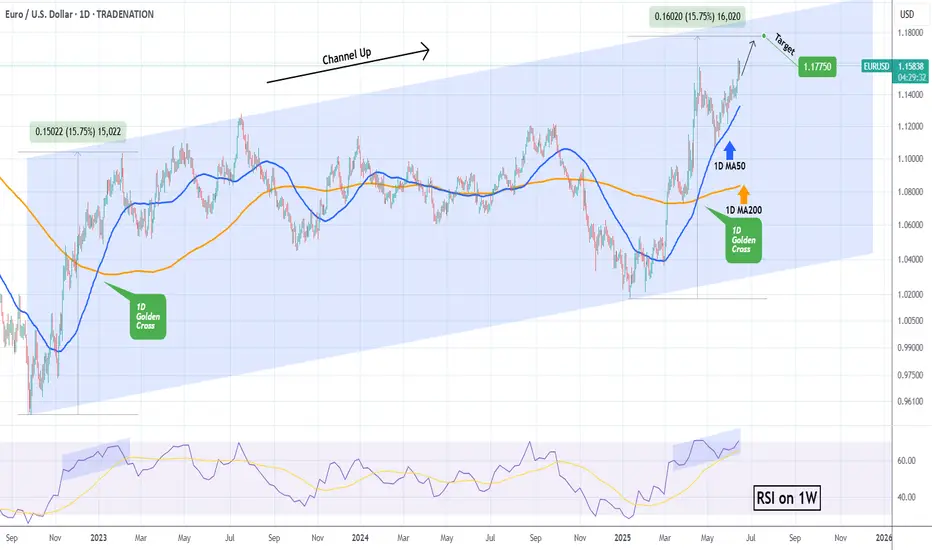
EURUSD Last push before correction.The EURUSD pair made a new High by breaking above the 1.15725 Resistance and is extending the rally since the January 13 2025 Low. That Low was the Higher Low of the multi-year Channel Up, so the current uptrend is technically its latest Bullish Leg.
The first Bullish Leg of that pattern peaked after a +15.75% rise. We expect a similar peak for the current rally, thus targeting 1.17750, before a new pull-back below the 1D MA50 (blue trend-line).
-------------------------------------------------------------------------------
** Please LIKE 👍, FOLLOW ✅, SHARE 🙌 and COMMENT ✍ if you enjoy this idea! Also share your ideas and charts in the comments section below! This is best way to keep it relevant, support us, keep the content here free and allow the idea to reach as many people as possible. **
-------------------------------------------------------------------------------
Disclosure: I am part of Trade Nation's Influencer program and receive a monthly fee for using their TradingView charts in my analysis.
💸💸💸💸💸💸
👇 👇 👇 👇 👇 👇
Quick take US indices and the Fed's interest rate decisionQuick look at what can we expect from the Fed's rate decision and press conference on Wednesday.
TVC:DJI
TVC:SPX
TVC:NDQ
Let us know what you think in the comments below.
Thank you.
77.3% of retail investor accounts lose money when trading CFDs with this provider. You should consider whether you understand how CFDs work and whether you can afford to take the high risk of losing your money. Past performance is not necessarily indicative of future results. The value of investments may fall as well as rise and the investor may not get back the amount initially invested. This content is not intended for nor applicable to residents of the UK. Cryptocurrency CFDs and spread bets are restricted in the UK for all retail clients.

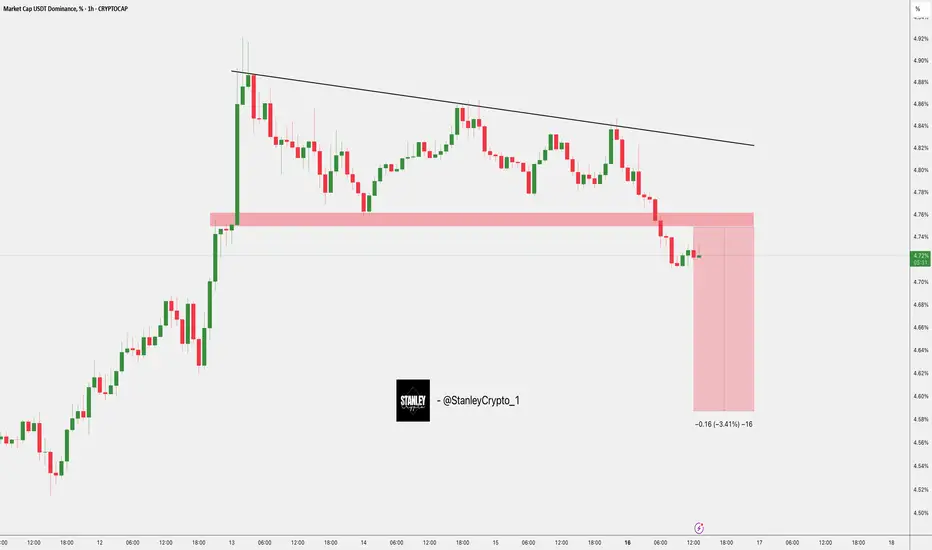
$USDT Dominance 3.41% DropCRYPTOCAP:USDT Dominance broke below key support and is now retesting it as resistance.
Rejection from this zone confirms bearish structure, with a projected 3.41% drop, signaling potential capital rotation into altcoins.
DYRO, NFA
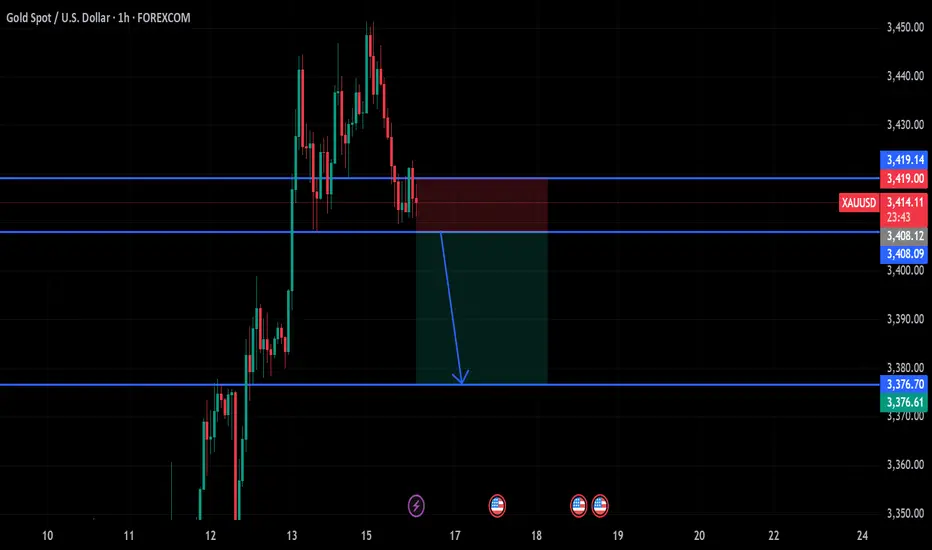
gold on sell reverse#XAUUSD multiple 2 times breakout below 3408 will drop the price till 3400-3376.
Price holds bearish reversal below 3408, target 3400-3376. SL 3419.
Bullish range and reverse is at 3403.6 price can reverse from here but if drop happens first below 3399 its invalid.
H1 closure above 3425 holds longer bullish.
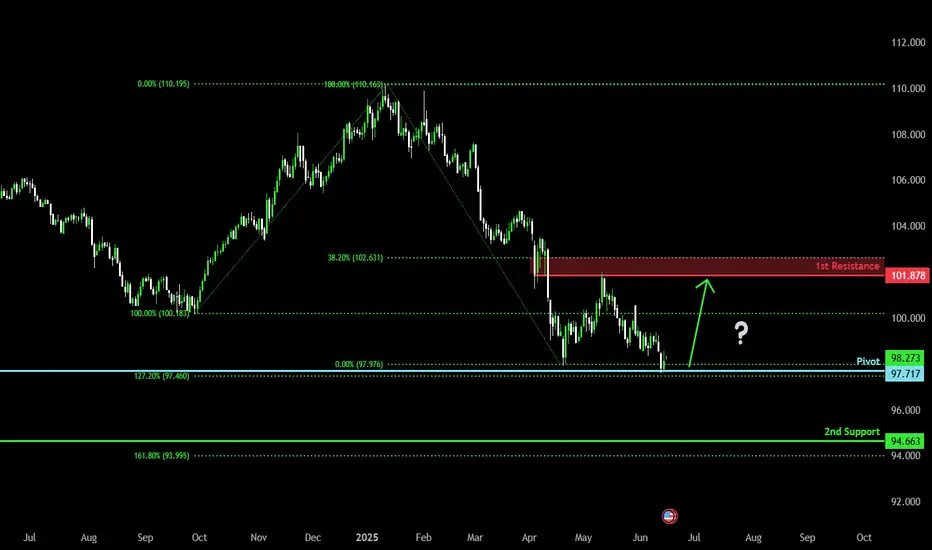
Could the DXY reverse from here?The price is reacting off the pivot and could rise to the 1st resistance which is an overlap resistance.
Pivot: 97.71
1st Support: 94.66
1st Resistance: 101.87
Risk Warning:
Trading Forex and CFDs carries a high level of risk to your capital and you should only trade with money you can afford to lose. Trading Forex and CFDs may not be suitable for all investors, so please ensure that you fully understand the risks involved and seek independent advice if necessary.
Disclaimer:
The above opinions given constitute general market commentary, and do not constitute the opinion or advice of IC Markets or any form of personal or investment advice.
Any opinions, news, research, analyses, prices, other information, or links to third-party sites contained on this website are provided on an "as-is" basis, are intended only to be informative, is not an advice nor a recommendation, nor research, or a record of our trading prices, or an offer of, or solicitation for a transaction in any financial instrument and thus should not be treated as such. The information provided does not involve any specific investment objectives, financial situation and needs of any specific person who may receive it. Please be aware, that past performance is not a reliable indicator of future performance and/or results. Past Performance or Forward-looking scenarios based upon the reasonable beliefs of the third-party provider are not a guarantee of future performance. Actual results may differ materially from those anticipated in forward-looking or past performance statements. IC Markets makes no representation or warranty and assumes no liability as to the accuracy or completeness of the information provided, nor any loss arising from any investment based on a recommendation, forecast or any information supplied by any third-party.
Weekly FOREX Forecast: When Missiles Fly, So Does The US Dollar This is the FOREX futures outlook for the week of Jun 16-20th.
In this video, we will analyze the following FX markets:
USD Index, EUR, GBP, AUD, NZD, CAD, CHF, and JPY.
Middle East tensions are high, missiles flying.... and so will the USD. Look for the USD to
out perform its counterparts during precarious period.
Enjoy!
May profits be upon you.
Leave any questions or comments in the comment section.
I appreciate any feedback from my viewers!
Like and/or subscribe if you want more accurate analysis.
Thank you so much!
Disclaimer:
I do not provide personal investment advice and I am not a qualified licensed investment advisor.
All information found here, including any ideas, opinions, views, predictions, forecasts, commentaries, suggestions, expressed or implied herein, are for informational, entertainment or educational purposes only and should not be construed as personal investment advice. While the information provided is believed to be accurate, it may include errors or inaccuracies.
I will not and cannot be held liable for any actions you take as a result of anything you read here.
Conduct your own due diligence, or consult a licensed financial advisor or broker before making any and all investment decisions. Any investments, trades, speculations, or decisions made on the basis of any information found on this channel, expressed or implied herein, are committed at your own risk, financial or otherwise.

USDJPY 1W tf forecast until August 2025 Current midterm bias is bullish. 150,64 and 142,78 are extreme levels to be respected by the price action. One more week of red week of sideways movement will actually form a reversal pattern followed by a strong upward spike. A powerful breakout to 148,27 is to be retested at 145,34 - healthy retest. July will show an organic growth topping at 149.66 in the beginning of August 2025

Weak Pullback, Bears in Control | Will the $100K Zone Hold? BTCUSD – Weak Pullback, Bears in Control | Will the $100K Zone Hold?
🌍 Macro & Fundamental Outlook
Bitcoin continues to face downside pressure after failing to hold above the key $108K resistance. Several macro factors are influencing sentiment:
📉 US bond yields are rising again, as markets expect the Fed to delay rate cuts. This adds pressure on risk assets like BTC.
🪙 Bitcoin Spot ETF inflows remain positive, but are currently not strong enough to counter short-term selling pressure.
💵 The DXY (US Dollar Index) is recovering, as investors flee to USD amid geopolitical volatility in the Middle East.
📊 Institutional liquidity is thinning across exchanges, adding to intraday volatility.
📉 Technical Analysis – H1 Chart
🔹 Trend Structure:
BTC is now firmly in a short-term downtrend, trading below the descending trendline and all key moving averages (EMA 34, 89, 200).
Rejection from every pullback suggests that sellers are still in control.
🔹 Key Price Zones:
Bearish FVG Resistance: 106,096 – 107,004
First Support Zone: 102,821
Major Support Zone: 101,539 → 100,419
A clean break below 100K could open the door to 98,000 and below
🔹 Momentum:
RSI is neutral, hovering around the mid-40s without strong divergence signals.
Selling volume is increasing but not yet explosive — indicating the market may be awaiting a macro catalyst.
🧠 Market Sentiment
Traders are currently in “wait-and-see” mode, eyeing the next round of macroeconomic data and potential Fed commentary.
Short-term profit-taking is dominant after last week’s sharp rally.
Overall sentiment: Bearish short-term – Neutral mid-term – Bullish long-term
🎯 Trade Setup Ideas
🔻 SELL if price retests FVG and gets rejected
Entry: 106,000 – 107,000
Stop-Loss: 107,500
Targets: 102,821 → 101,539 → 100,419
🔹 BUY if price reacts strongly from 100,419 – 101,500
Entry: 100,500 – 100,800
Stop-Loss: 99,800
Targets: 102,800 → 104,400 → 106,000
Preference is given to selling the rally in the short term. Buying should only be considered on confirmed reversal signals at key support.
✅ Conclusion
BTCUSD is currently in a corrective phase, with bears maintaining control. The key level to watch is the $100,419 support zone, which may determine whether Bitcoin maintains its medium-term bullish structure or breaks further. Discipline and confirmation are crucial in this volatile environment.
📌 Strategy Focus: Look to sell rallies toward resistance; buy only on confirmed bounce from strong support zones.

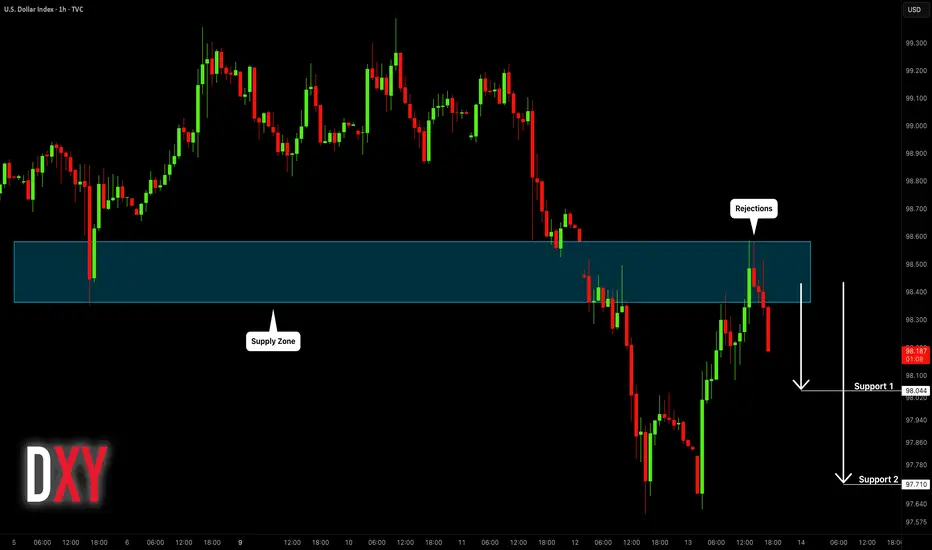
DOLLAR INDEX (DXY): Bearish Again?!
Dollar Index leaves clear bearish clues after a test
of a significant intraday/daily supply area.
I think that the market will continue falling at reach at least 98.04 level.
❤️Please, support my work with like, thank you!❤️
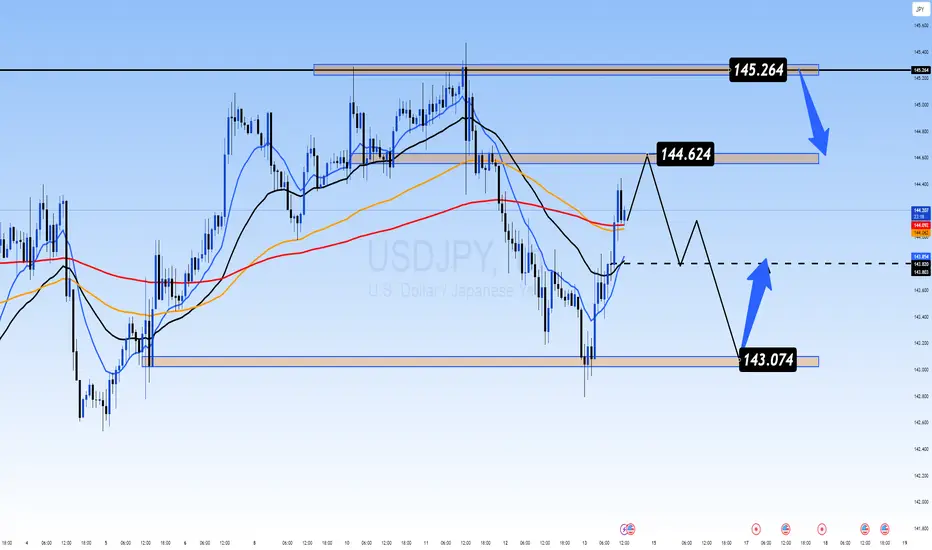
Dollar Momentum Fades | Can 143.07 Hold as Support?USDJPY – Dollar Momentum Fades | Can 143.07 Hold as Support?
🌍 Fundamental & Macro Outlook
USDJPY has faced strong downside pressure recently as risk-off sentiment boosts demand for the Japanese Yen, following escalating tensions between Israel and Iran.
The US Dollar Index (DXY) rallied on geopolitical concerns but is struggling to sustain momentum near the 98.30 resistance zone.
Despite the Bank of Japan's ultra-loose monetary policy, JPY is acting as a safe haven in current global risk conditions.
Traders are awaiting next week’s monetary policy decisions from both the Federal Reserve and the Bank of Japan. Both central banks are expected to keep rates unchanged, but forward guidance could spark major volatility.
According to UOB Group, the dollar's recovery potential is weakening, and further downside toward 142.20 is possible, unless price reclaims the 144.60–144.95 resistance zone.
📉 Technical Analysis – H1 Chart
🔸 Trend Structure
USDJPY remains in a mild downtrend, but price has bounced from the 143.074 key support zone.
A recovery towards 144.624 is in play, but that zone must be cleared for bullish continuation.
🔸 EMA Outlook
Price is currently testing the EMA 89 and 200 — a rejection from this area could trigger another move down.
EMA 13 & 34 are now acting as short-term dynamic support.
🔸 Key Price Zones
Resistance: 144.60 – 145.26
Support: 143.07 – 142.20
🧠 Market Sentiment
Risk aversion continues to dominate as geopolitical headlines drive sentiment.
The Yen is benefitting from capital protection flows despite Japan’s dovish stance.
Large funds may be starting to hedge by rotating into JPY from elevated USD levels.
🎯 Trading Scenarios for June 13
📌 Scenario 1 – Short Setup (Rejection at Resistance)
Entry: 144.60 – 144.90
Stop-Loss: 145.30
Take-Profit: 143.60 → 143.07 → 142.50
📌 Scenario 2 – Long Setup (Rebound from Support)
Entry: 143.10 – 143.20
Stop-Loss: 142.70
Take-Profit: 144.00 → 144.60
✅ Wait for confirmation at key levels — avoid trading in the middle of the range when volatility is headline-driven.
✅ Conclusion
USDJPY remains trapped between strong resistance at 145.26 and buying interest at 143.07. If risk sentiment persists, the Yen may continue to strengthen. However, central bank decisions next week (Fed & BoJ) will be the major catalysts for any medium-term breakout.
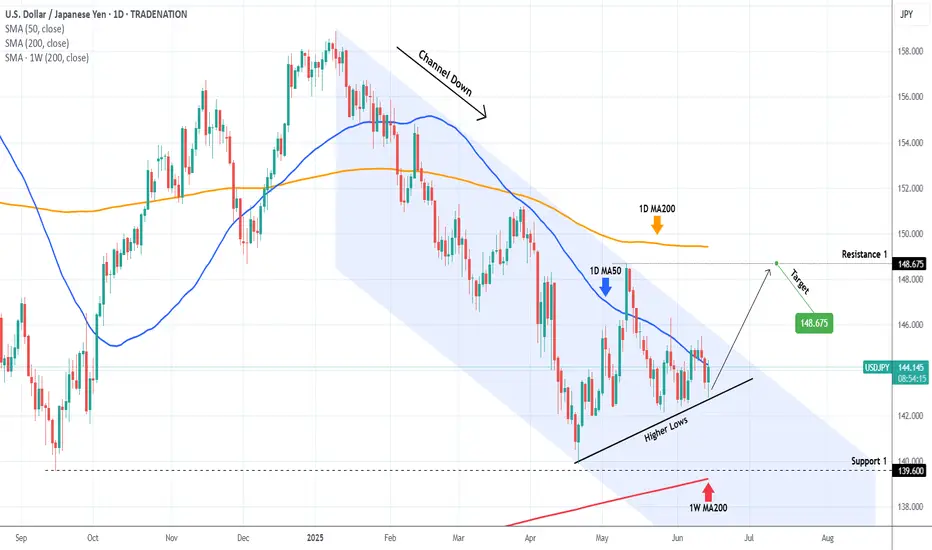
USDJPY Strong support formed. Excellent buy opportunity.The USDJPY pair is trading within a Channel Down since the start of the year but following the April 22 Low, it has been rising on Higher Lows. Today that trend-line was tested and again produced a rebound (so far).
Since the April 22 Low was very close to the 139.600 Support (from the September 16 2024 Low), there are higher probabilities that we will have a trend change to bullish, at least for the medium-term.
The natural Resistance now is the 1D MA200 (orange trend-line), so we will target just below it at 148.675 (Resistance 1).
-------------------------------------------------------------------------------
** Please LIKE 👍, FOLLOW ✅, SHARE 🙌 and COMMENT ✍ if you enjoy this idea! Also share your ideas and charts in the comments section below! This is best way to keep it relevant, support us, keep the content here free and allow the idea to reach as many people as possible. **
-------------------------------------------------------------------------------
Disclosure: I am part of Trade Nation's Influencer program and receive a monthly fee for using their TradingView charts in my analysis.
💸💸💸💸💸💸
👇 👇 👇 👇 👇 👇