US Dollar Index (DXY) Plummets Following Labour Market DataUS Dollar Index (DXY) Plummets Following Labour Market Data
The US Dollar Index (DXY) fell by approximately 1.4% on Friday after the release of disappointing US labour market figures. According to Forex Factory:
→ The unemployment rate rose from 4.1% to 4.2%;
→ The Nonfarm Employment Change figure came in at 73K, well below the forecast of 103K. This is the lowest level of job creation in the nonfarm sector in 2025 and is roughly half the previous month’s reading (prior to revisions).
→ Furthermore, revisions for May and June were significantly more severe than usual. The May figure was revised downward by 125,000 — from +144,000 to +19,000. Similarly, the June figure was revised down by 133,000 — from +147,000 to +14,000.
These results point to a weakening labour market, which increases the likelihood of a rate cut aimed at supporting economic growth. In turn, expectations of a Fed rate cut are acting as a bearish driver for the US dollar.
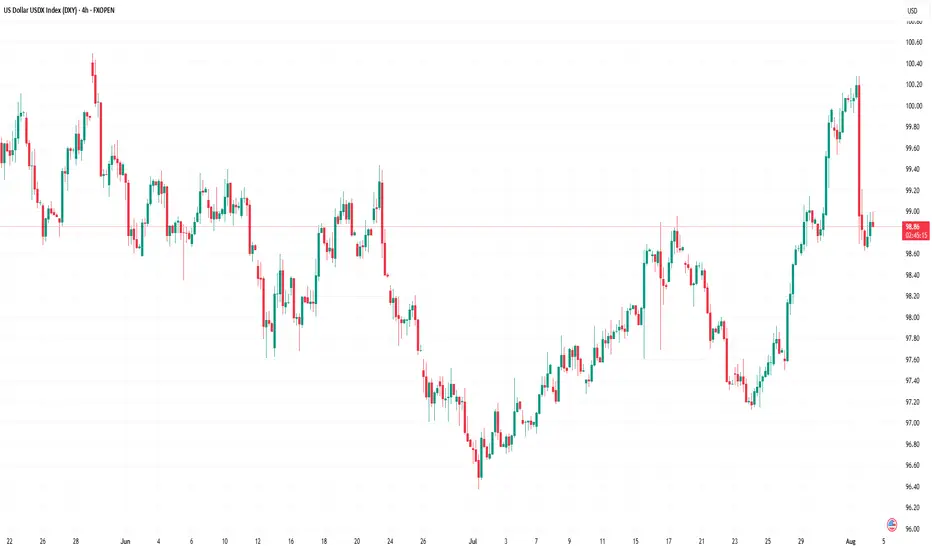
Technical Analysis of the DXY Chart
Six days ago, we highlighted two U-shaped trajectories (A and B), which together formed a bullish сup and рandle pattern on the US Dollar Index chart.
Following this, price action generated a notable upward impulse (as indicated by the arrow), breaking through the upper boundary of the pattern.
However, Friday’s news triggered the following developments:
→ A new top (4) was formed on the chart, accompanied by a false bullish breakout above the psychological level of 100.00;
→ The price declined to the 98.80 area. The downward move slowed here, as this zone had previously seen strong bullish activity during the breakout from the pattern’s upper boundary — likely explaining why the market is finding support here on Monday morning.
Overall, the technical picture has shifted towards a bearish outlook. Friday’s peak continues the summer sequence of lower highs and lows: 1 → 2 → bottom of pattern (A) → 4. This structure is part of a broader downtrend that has defined the market in 2025.
Should bearish sentiment persist, fuelled by Friday’s data, we can assume a further decline in the US Dollar Index towards the median line of the descending channel (shown in red), which has been drawn through the aforementioned price extremes.
This article represents the opinion of the Companies operating under the FXOpen brand only. It is not to be construed as an offer, solicitation, or recommendation with respect to products and services provided by the Companies operating under the FXOpen brand, nor is it to be considered financial advice.
Usdollarcurrencyindex
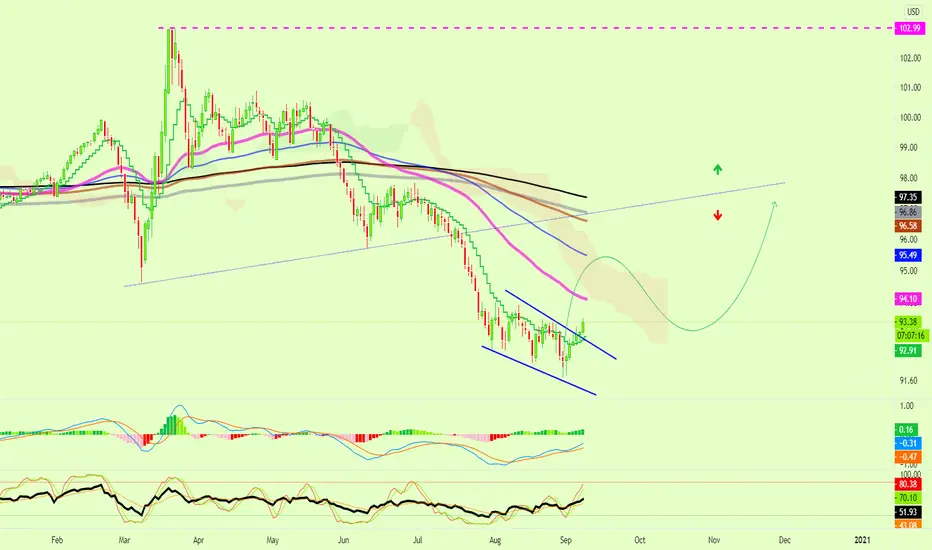
DIXIE looking horrid and next target 96.40Head and Shoulders has formed on Daily. It didn't even complete a decent looking right shoulder, which shows how strong the bears were to push the index.
Moving averages are all bearish with 200 >21 > 7 MA.
The interest rate hike has shifted attention to possible inflationary measures in the future for the US.
This has resulted in Investors taking their money out of the US Dollar and putting it in Euro...
So the first target is 96.40.

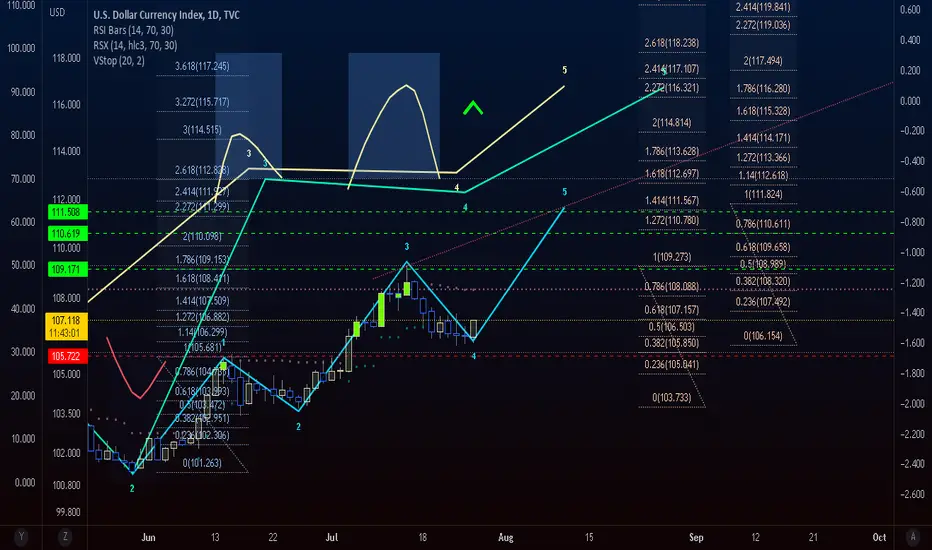
Green on greenback. DXYLooking at the US Dollar currency index, we see a major impulse for longs. This is fueled by the increased demand for greenback as people exit out of bonds and stocks, We believe. We will continue to monitor and comment on this growth.
We are not in the business of getting every prediction right, no one ever does and that is not the aim of the game. The Fibonacci targets are highlighted in green with invalidation in red. Confirmation level, where relevant, is a pink dotted, finite line. Fibonacci goals, it is prudent to suggest, are nothing more than mere fractally evident and therefore statistically likely levels that the market will go to. Having said that, the market will always do what it wants and always has a mind of its own. Therefore, none of this is financial advice, so do your own research and rely only on your own analysis. Trading is a true one man sport. Good luck out there and stay safe.
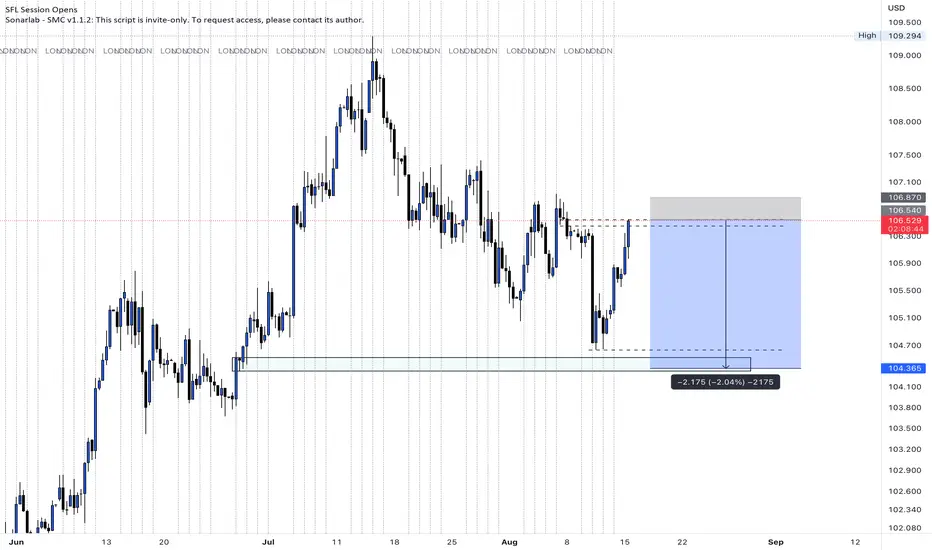
DXY potential SELLwe could see DXY selling off from here. It's an interesting level right now let's see what is gonna happen.
Entry: 106.540
SL: 106.870
TP1:105.540
TP2: 104.360
Please like and comment what you think!!
U.S. Dollar Currency Index (DXY) Moving HigherThe U.S. Dollar Currency Index (DXY) is looking to go higher.
I can see this index increasing based on multiple signals...
But this increase is looking more like a strong bounce that will take place but will be followed by a crash...
The crash part is still a bit far though...
The DXY is aiming higher.
Namaste.
DXY | H&S and Ascending Broadening WedgePlease support this idea with LIKE if you find it useful.
Price formed a Head and Shoulders pattern. In case there is a breakout of the support trendline or better of the Ichi Cloud support zone the price will go down (possible retest the 200 MA).
Nevertheless we are sitting on the 50 MA support and there is also an ascending broadening wedge pattern, which can work out if there is an upward breakout of the formation.
Thank you for reading this idea! Hope it's been useful to you and some of us will turn it into profitable.
Remember this analysis is not 100% accurate. No single analysis is. To make a decision follow your own thoughts.
The information given is not a Financial Advice.

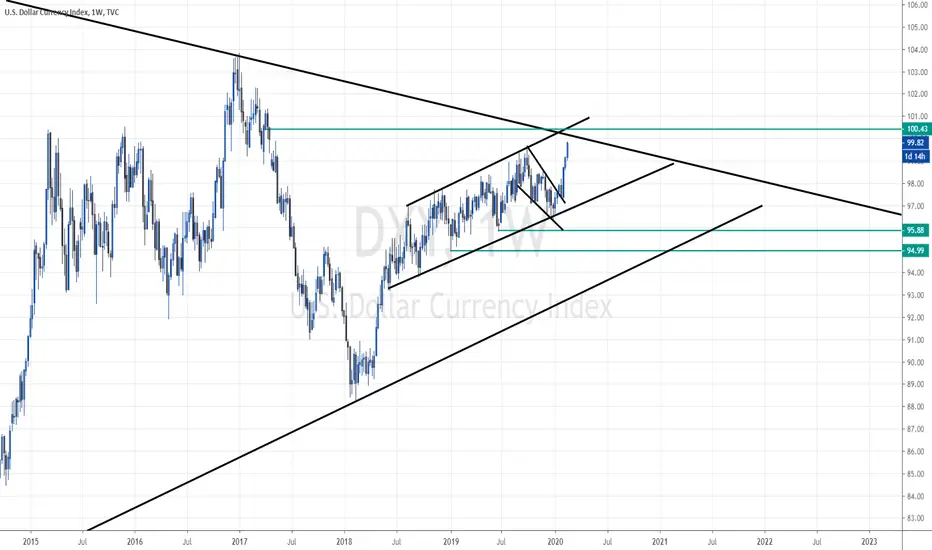
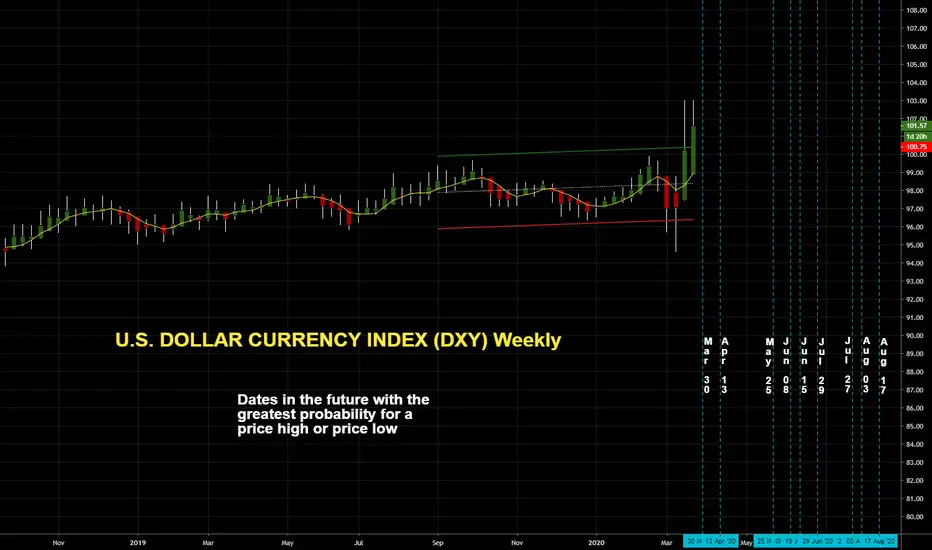
U.S. DOLLAR CURRENCY INDEX (DXY) WeeklyDates in the future with the greatest probability for a price high or price low
DollarDollar soaring. Metals soaring. Yen collapsing. Printing and potential debt monetisation going on under our nose... interesting times.
Back to the dollar - how far is it will to go, until it starts to show signs of exhaustion. And which currencies will be pick as being the strongest to bet against it, when the time comes to go long against the USD... keep a track of USD flows.